51
WHAT’S NEW IN THE SIXTH EDITION:
The
In the News
feature “Price Increases after Natural Disasters” has been updated with a new article.
LEARNING OBJECTIVES:
By the end of this chapter, students should understand:
➢ what a competitive market is.
CONTEXT AND PURPOSE:
Chapter 4 is the first chapter in a three-chapter sequence that deals with supply and demand and how
markets work. Chapter 4 shows how supply and demand for a good determines both the quantity
produced and the price at which the good sells. Chapter 5 will add precision to the discussion of supply
and demand by addressing the concept of elasticity—the sensitivity of the quantity supplied and quantity
4
THE MARKET FORCES OF
SUPPLY AND DEMAND
52 ❖ Chapter 4/The Market Forces of Supply and Demand
KEY POINTS:
• Economists use the model of supply and demand to analyze competitive markets. In a competitive
market, there are many buyers and sellers, each of whom has little or no influence on the market
price.
• The supply curve shows how the quantity of a good supplied depends on the price. According to the
law of supply, as the price of a good rises, the quantity supplied rises. Therefore, the supply curve
slopes upward.
• In addition to price, other determinants of how much producers want to sell include input prices,
technology, expectations, and the number of sellers. If one of these factors changes, the supply
curve shifts.
• To analyze how any event influences a market, we use the supply-and-demand diagram to examine
how the event affects equilibrium price and quantity. To do this we follow three steps. First, we
decide whether the event shifts the supply curve or the demand curve (or both). Second, we decide
which direction the curve shifts. Third, we compare the new equilibrium with the initial equilibrium.
Chapter 4/The Market Forces of Supply and Demand ❖ 53
CHAPTER OUTLINE:
I. Markets and Competition
A. What Is a Market?
B. What Is Competition?
1. Definition of competitive market: a market in which there are so many buyers and
C. In this chapter, we will assume that markets are perfectly competitive.
1. Characteristics of a perfectly competitive market:
2. Because buyers and sellers must accept the market price as given, they are often called
“price takers.”
You may want to provide students with examples of markets other than the
traditional retail store or the stock market. These include the online advertising sites
such as eBay and Craigslist, the college “career services” department through which
they can look for employment upon graduation, or the market for illegal drugs on a
college campus. Be sure to list the good or service being sold, the buyers, and the
sellers in each example.
Students may find the name for this type of market misleading. You will have to
point out that firms in a competitive market do not face head–to-head rivalry as in
sports competitions.
54 ❖ Chapter 4/The Market Forces of Supply and Demand
D. We will start by studying perfect competition.
1. Perfectly competitive markets are the easiest to analyze because buyers and sellers take the
II. Demand
A. The Demand Curve: The Relationship between Price and Quantity Demanded
1. Definition of quantity demanded: the amount of a good that buyers are willing and
able to purchase.
2. One important determinant of quantity demanded is the price of the product.
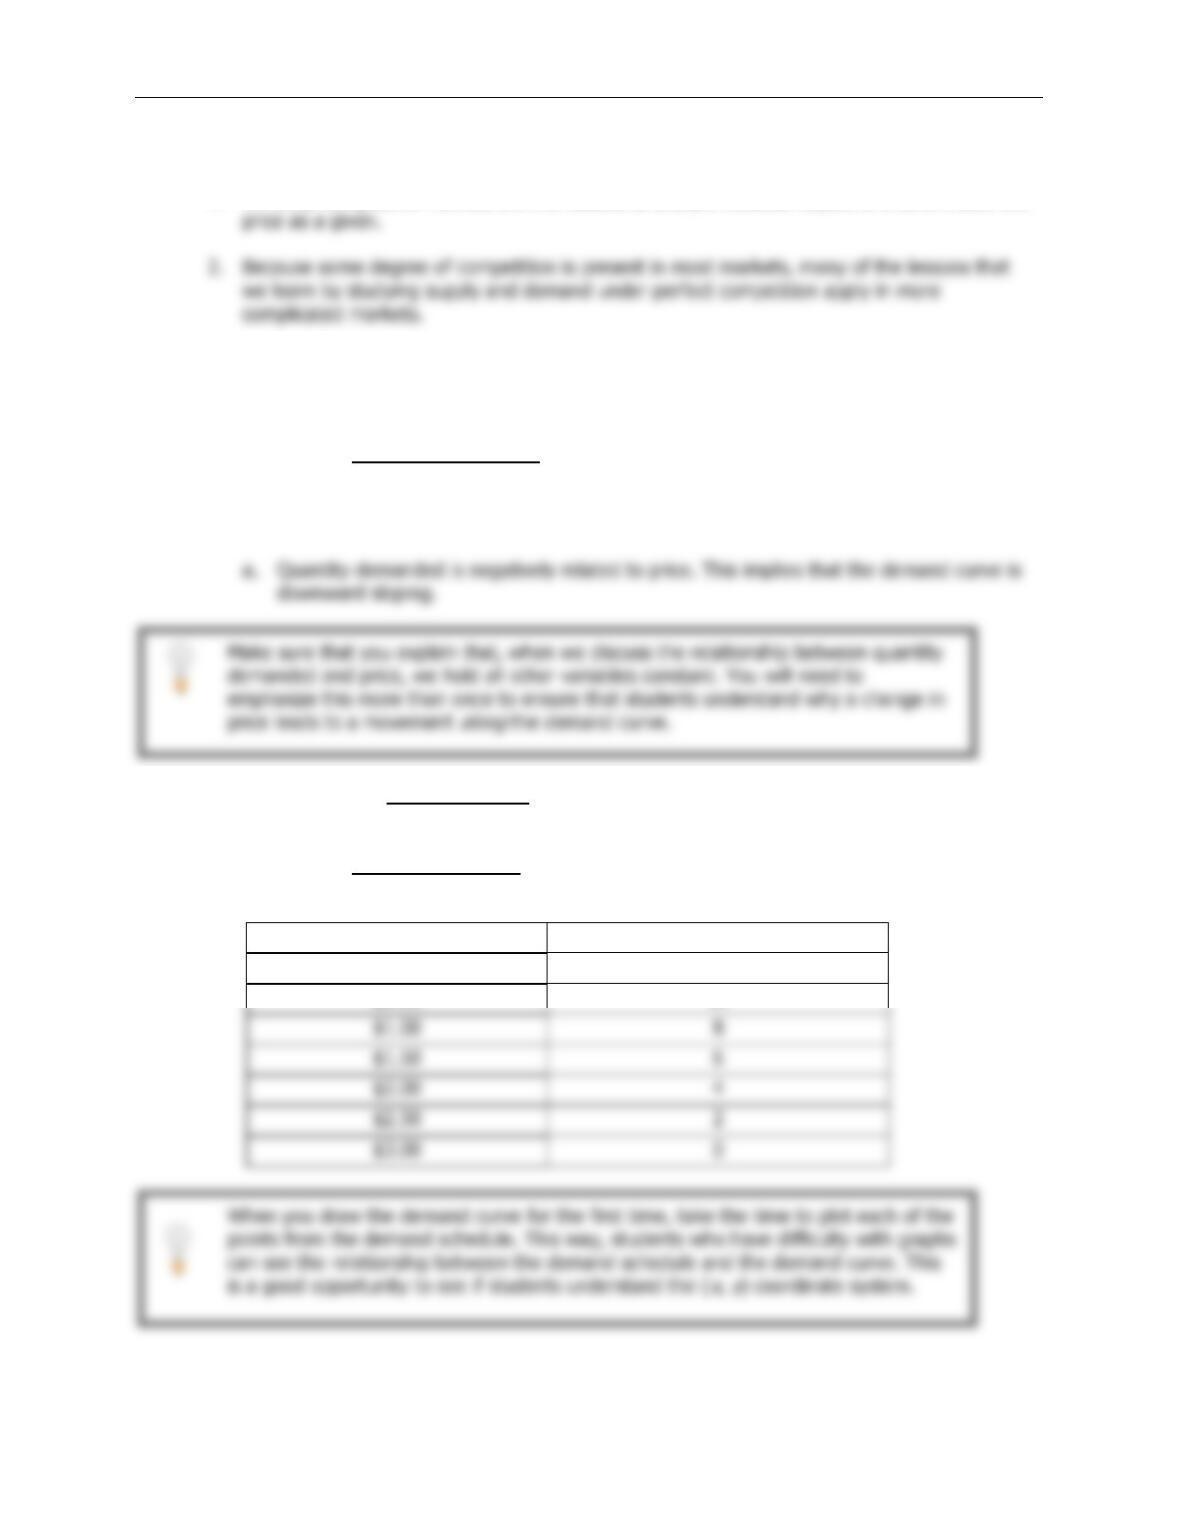
b. Definition of law of demand: the claim that, other things being equal, the
quantity demanded of a good falls when the price of the good rises.
3. Definition of demand schedule: a table that shows the relationship between the
price of a good and the quantity demanded.
Price of Ice Cream Cone
Quantity of Cones Demanded
$0.00
12
$0.50
10
$1.00
$2.00
$3.00
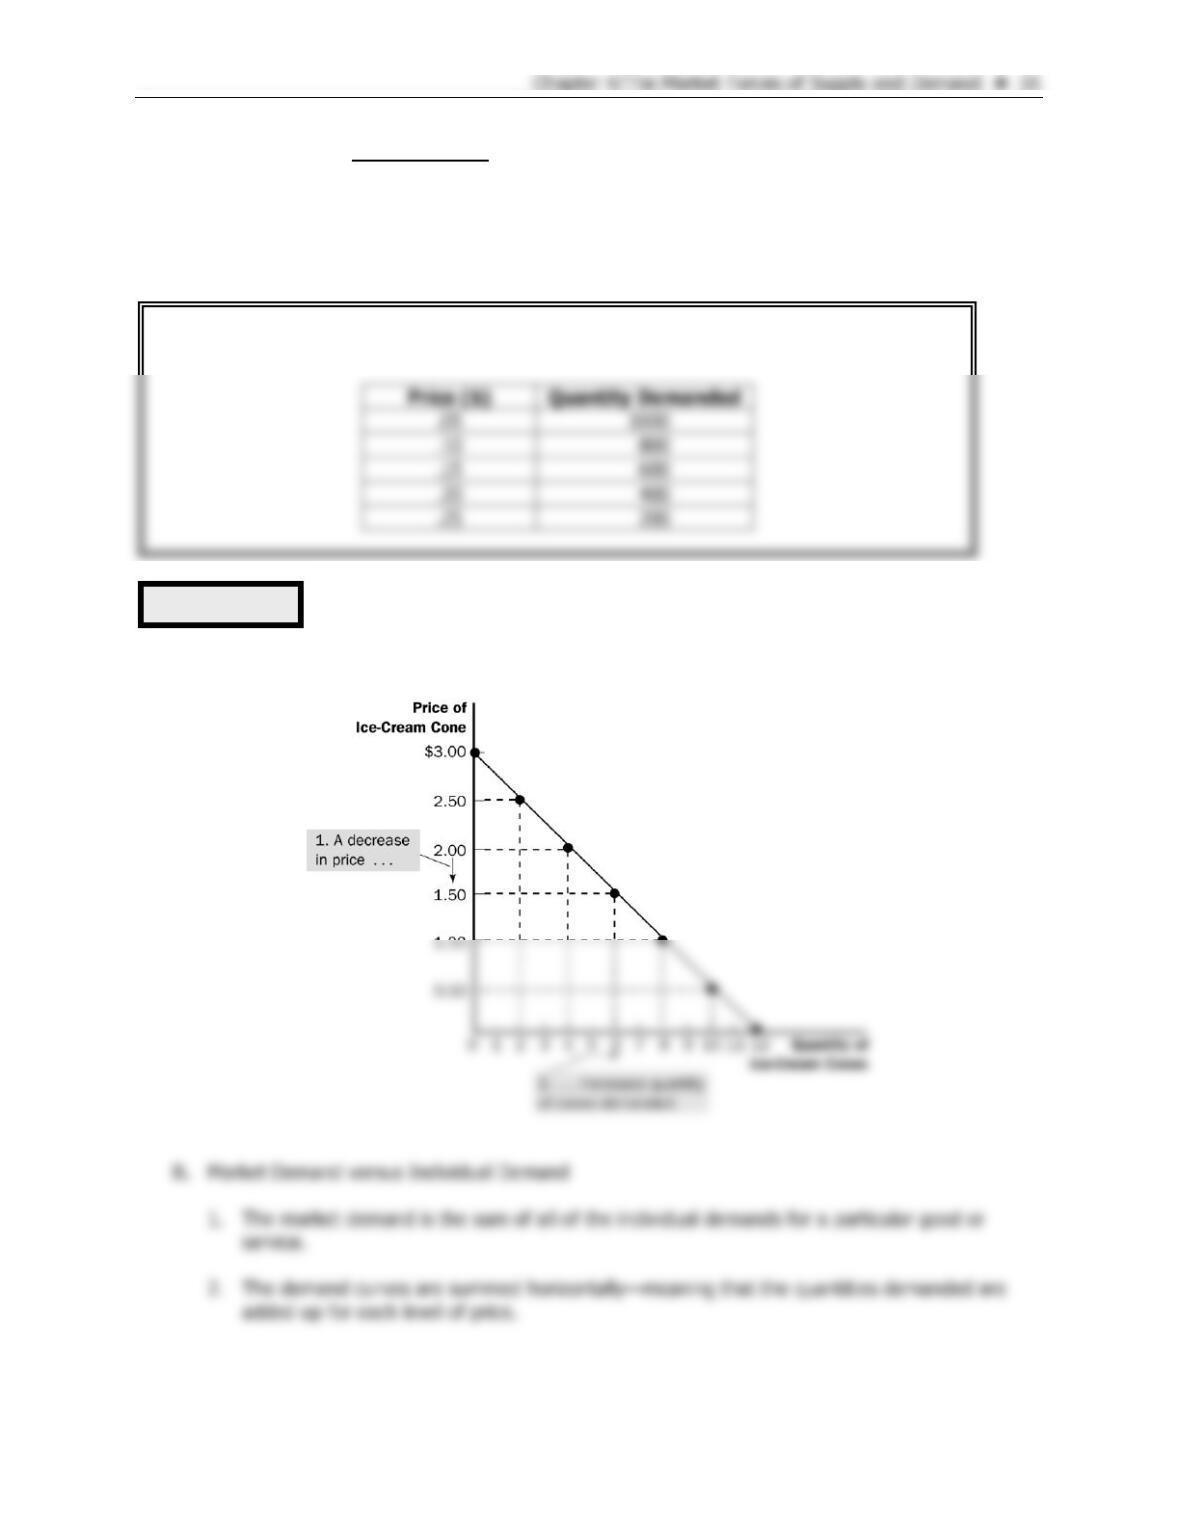
4. Definition of demand curve: a graph of the relationship between the price of a good
and the quantity demanded.
a. Price is generally drawn on the vertical axis.
b. Quantity demanded is represented on the horizontal axis.
ALTERNATIVE CLASSROOM EXAMPLE:
Here is a demand schedule for ink pens:
Figure 1
56 ❖ Chapter 4/The Market Forces of Supply and Demand
3. The market demand curve shows how the total quantity demanded of a good varies with the
price of the good, holding constant all other factors that affect how much consumers want to
buy.
1. Because the market demand curve holds other things constant, it need not be stable over
time.
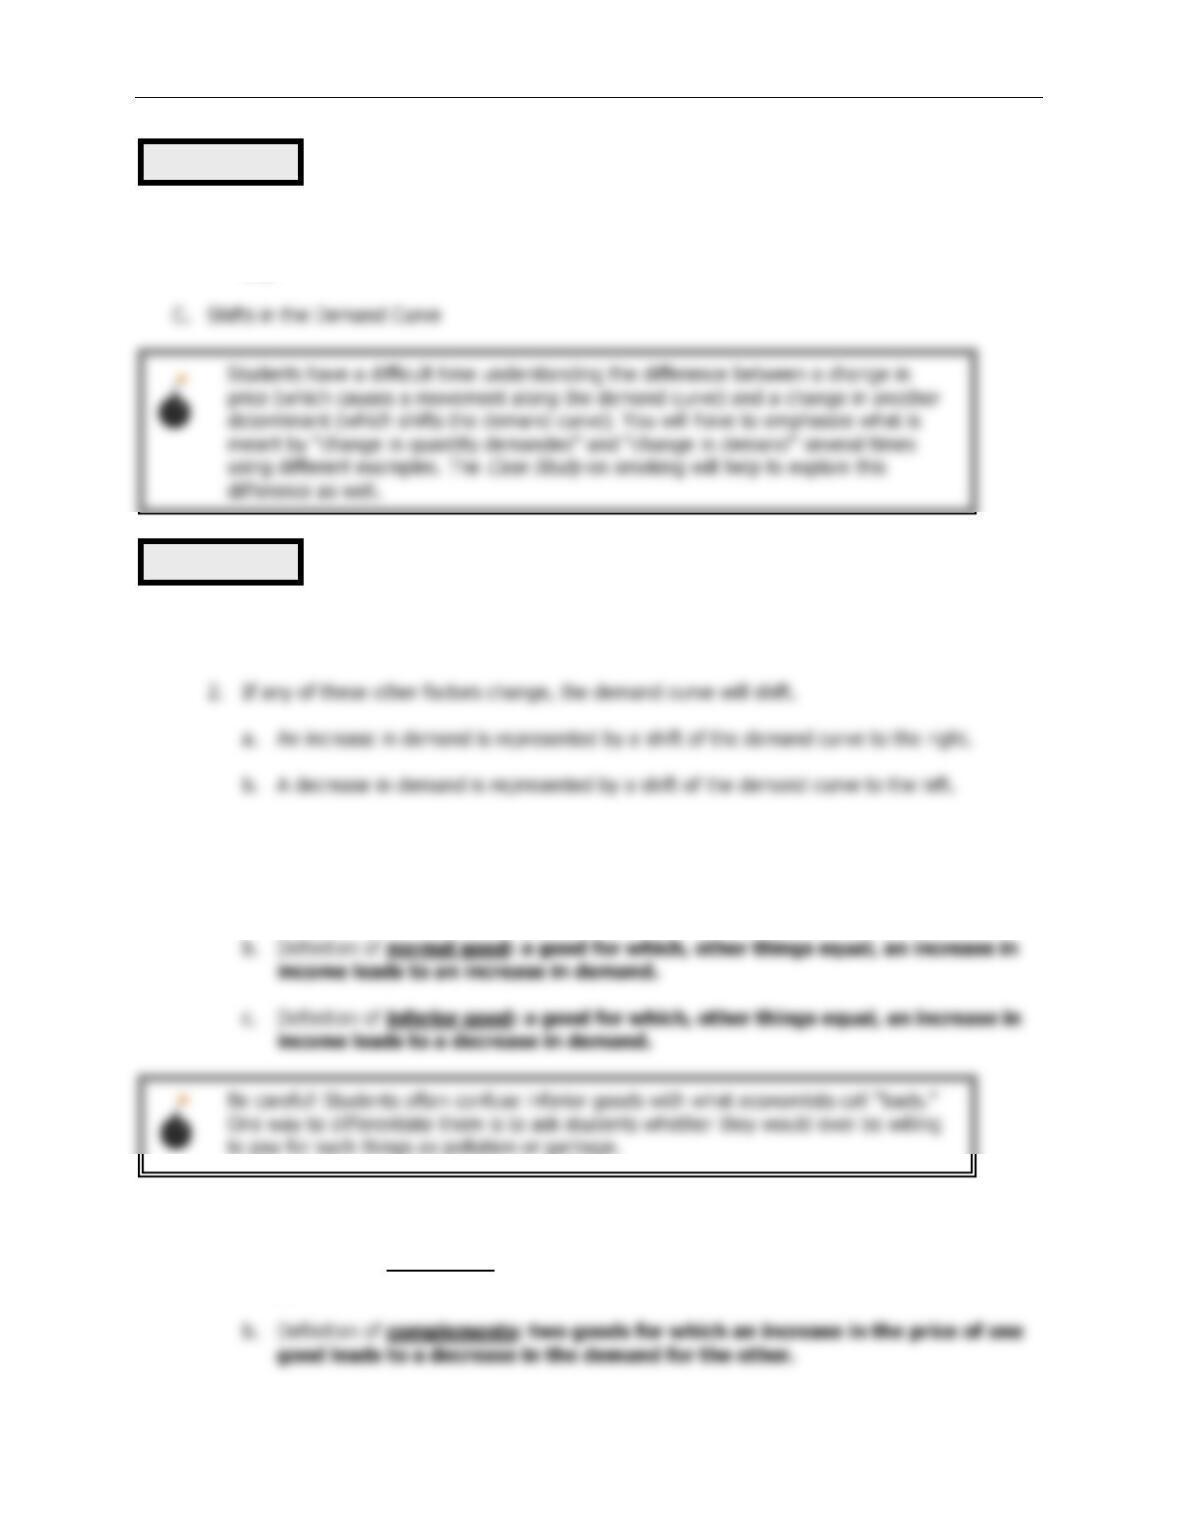
3. Income
a. The relationship between income and quantity demanded depends on what type of good
the product is.
4. Prices of Related Goods
a. Definition of substitutes: two goods for which an increase in the price of one
good leads to an increase in the demand for the other.
Figure 3
Figure 2
Chapter 4/The Market Forces of Supply and Demand ❖ 57
5. Tastes
6. Expectations
D.
Case Study: Two Ways to Reduce the Quantity of Smoking Demanded
1. Public service announcements, mandatory health warnings on cigarette packages, and the
prohibition of cigarette advertising on television are policies designed to reduce the demand
for cigarettes (and shift the demand curve to the left).
2. Raising the price of cigarettes (through tobacco taxes) lowers the quantity of cigarettes
demanded.
The Hudsucker Proxy
,
Chapter 25
. This clip is very useful to demonstrate the
difference in a change in demand and a change in quantity demanded. A store is
trying to sell Hula-Hoops with no luck. The seller tries to lower the price to raise
quantity demanded. Eventually, a change in taste leads to a large rise in the
demand.
Figure 4
58 ❖ Chapter 4/The Market Forces of Supply and Demand
III. Supply
A. The Supply Curve: The Relationship between Price and Quantity Supplied
1. Definition of quantity supplied: the amount of a good that sellers are willing and
able to sell.
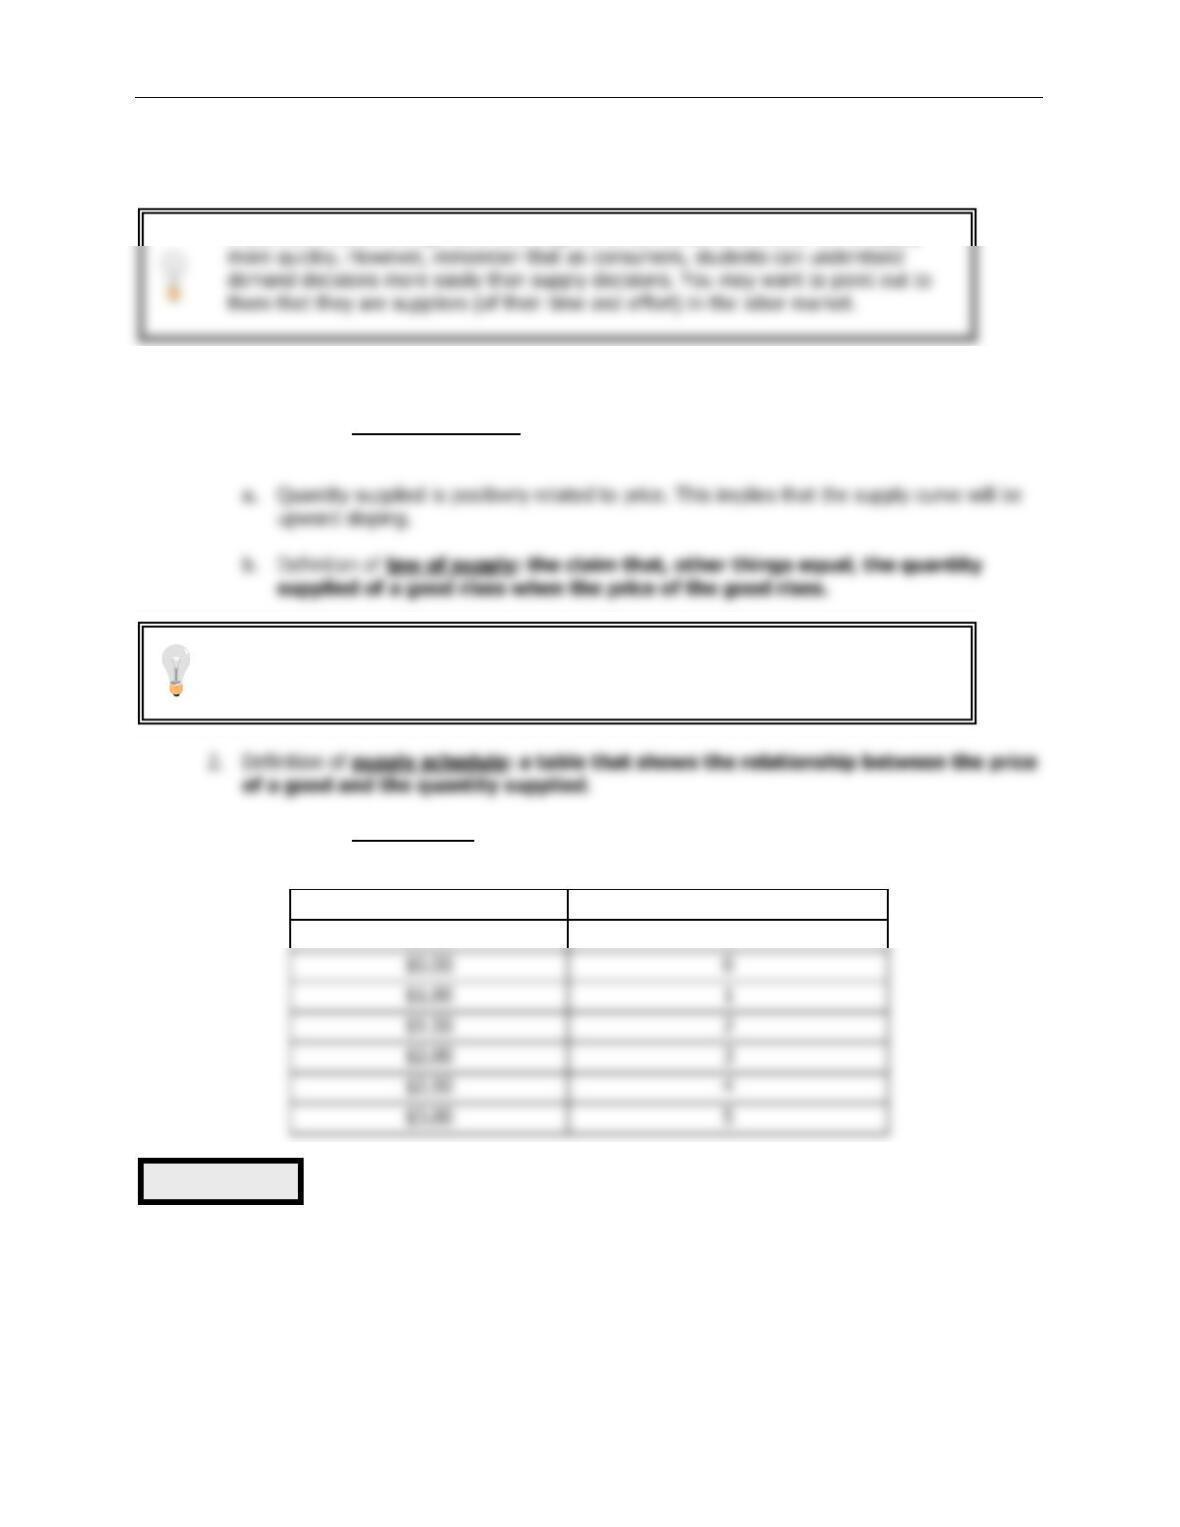
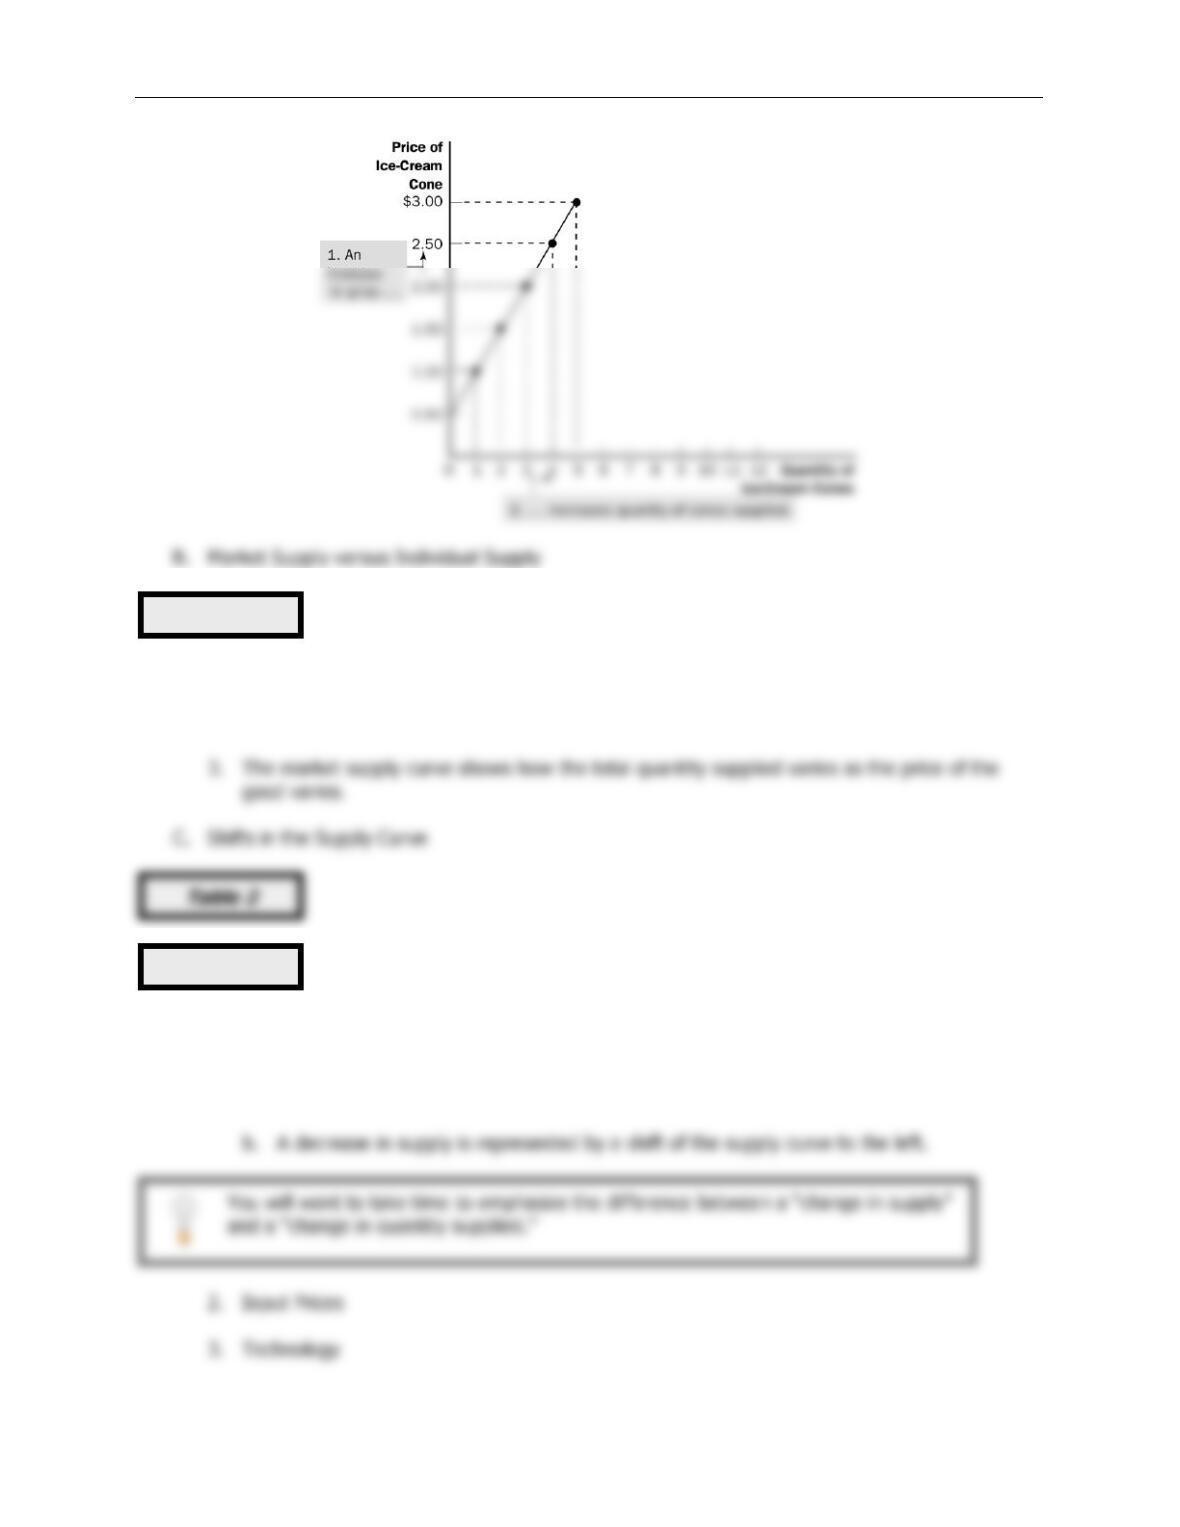
3. Definition of supply curve: a graph of the relationship between the price of a good
and the quantity supplied.
Price of Ice Cream Cone
Quantity of Cones Supplied
$0.00
0
$0.50
0
$2.00
3
$2.50
4
If you have taken enough time teaching demand, students will catch on to supply
Again you will want to point out that everything else is held constant when we
discuss the relationship between price and quantity supplied. Students should
understand that a change in price causes a movement along the supply curve.
Figure 5
Chapter 4/The Market Forces of Supply and Demand ❖ 59
1. The market supply curve can be found by summing individual supply curves.
2. Individual supply curves are summed horizontally at every price.
1. Because the market supply curve holds other things constant, the supply curve will shift if
any of these factors changes.
a. An increase in supply is represented by a shift of the supply curve to the right.
Figure 7
Figure 6
60 ❖ Chapter 4/The Market Forces of Supply and Demand
4. Expectations
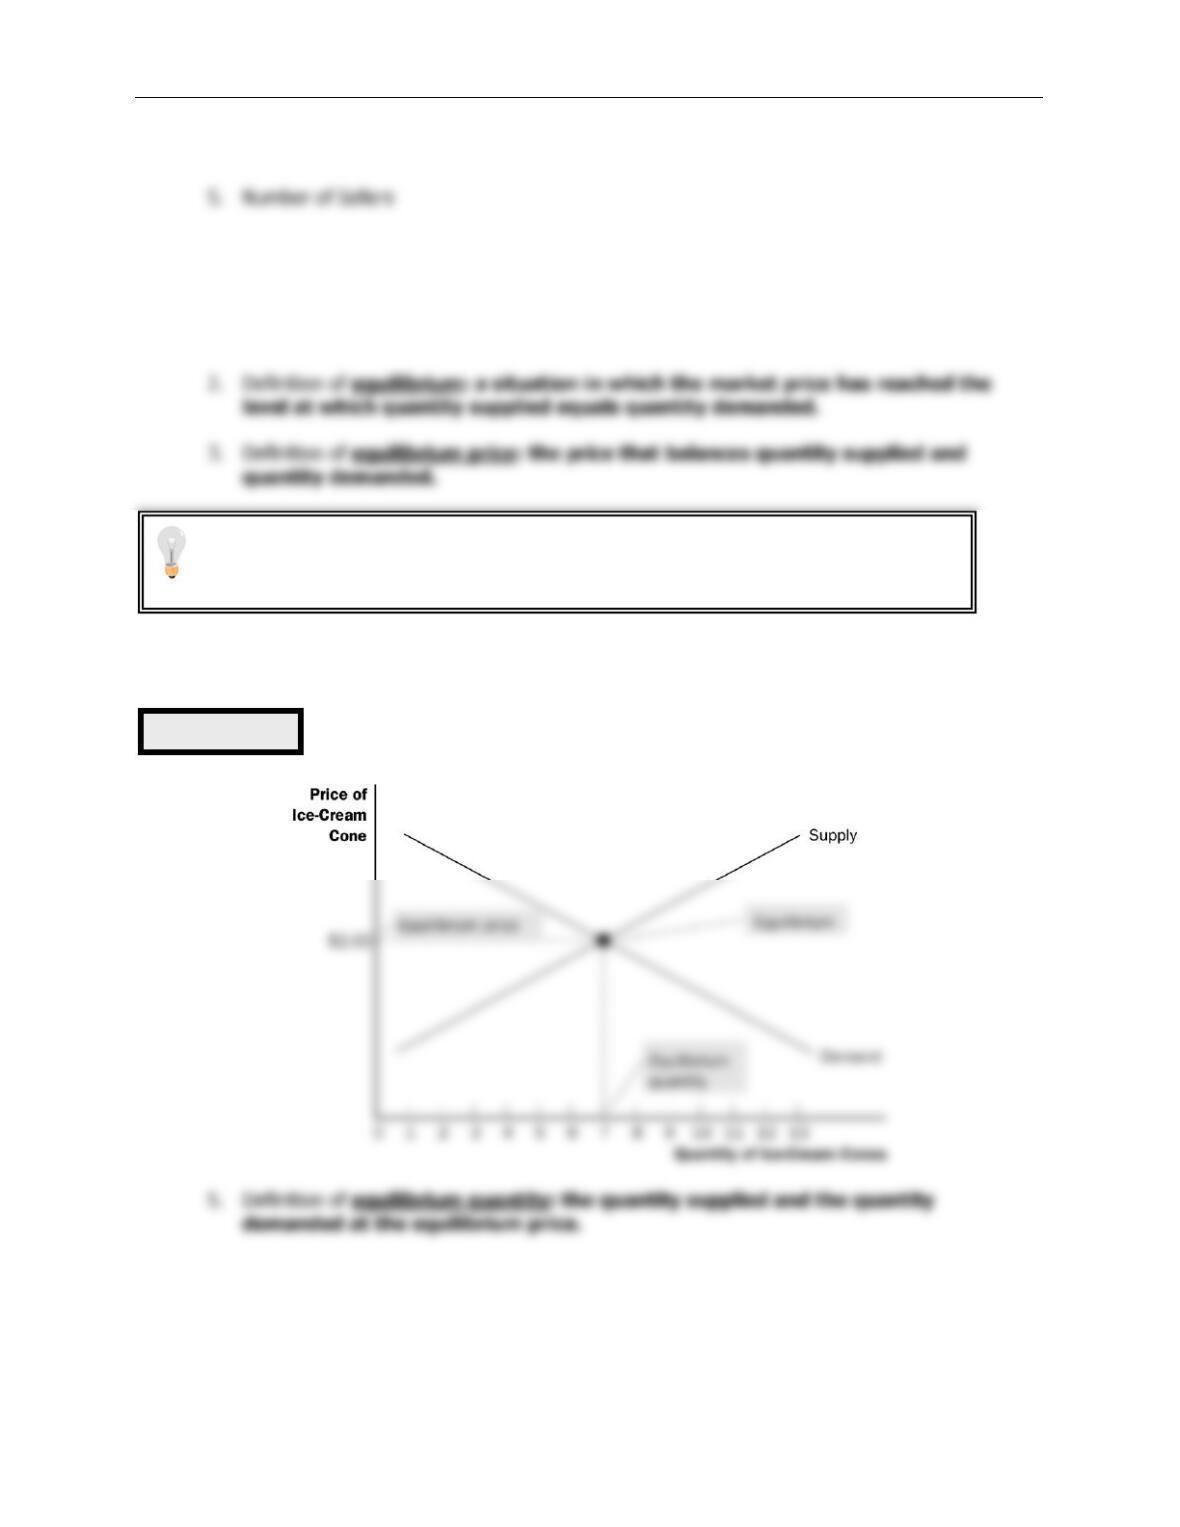
IV. Supply and Demand Together
A. Equilibrium
1. The point where the supply and demand curves intersect is called the market’s equilibrium.
4. The equilibrium price is often called the “market-clearing” price because both buyers and
sellers are satisfied at this price.
Figure 8
Students will benefit from seeing equilibrium using both a graph and a supply-and–
demand schedule. The schedule will also make it easier for students to understand
concepts such as shortages and surpluses.
Chapter 4/The Market Forces of Supply and Demand ❖ 61
Activity 1—A Market Example
Type: In-class demonstration
Topics: Individual demand, market demand, equilibrium price, allocation
Materials needed: A bag of Pepperidge Farm cookies (15 cookies), 5 volunteers
Time: 35 minutes
Class limitations: Works in large lectures or small classes with over 15 students
Purpose
Instructions
Ask five volunteers to participate in a market for Pepperidge Farm cookies. Read some of the
package copy describing these “distinctively delicious” cookies. Write each volunteer’s name
on the board.
Add the individual quantities at each price to find the market demand at that price. This
overall demand is used to find the market equilibrium. Sketch a graph of the market demand.
Supply, in this case, is fixed at the number of cookies in the bag. There are 15 cookies. No
more can be produced, and any leftovers will spoil. This gives a vertical supply curve in the
very short run at
Q
= 15. (Sketch the supply curve.)
Market demand is aggregated from individual demand curves.
62 ❖ Chapter 4/The Market Forces of Supply and Demand
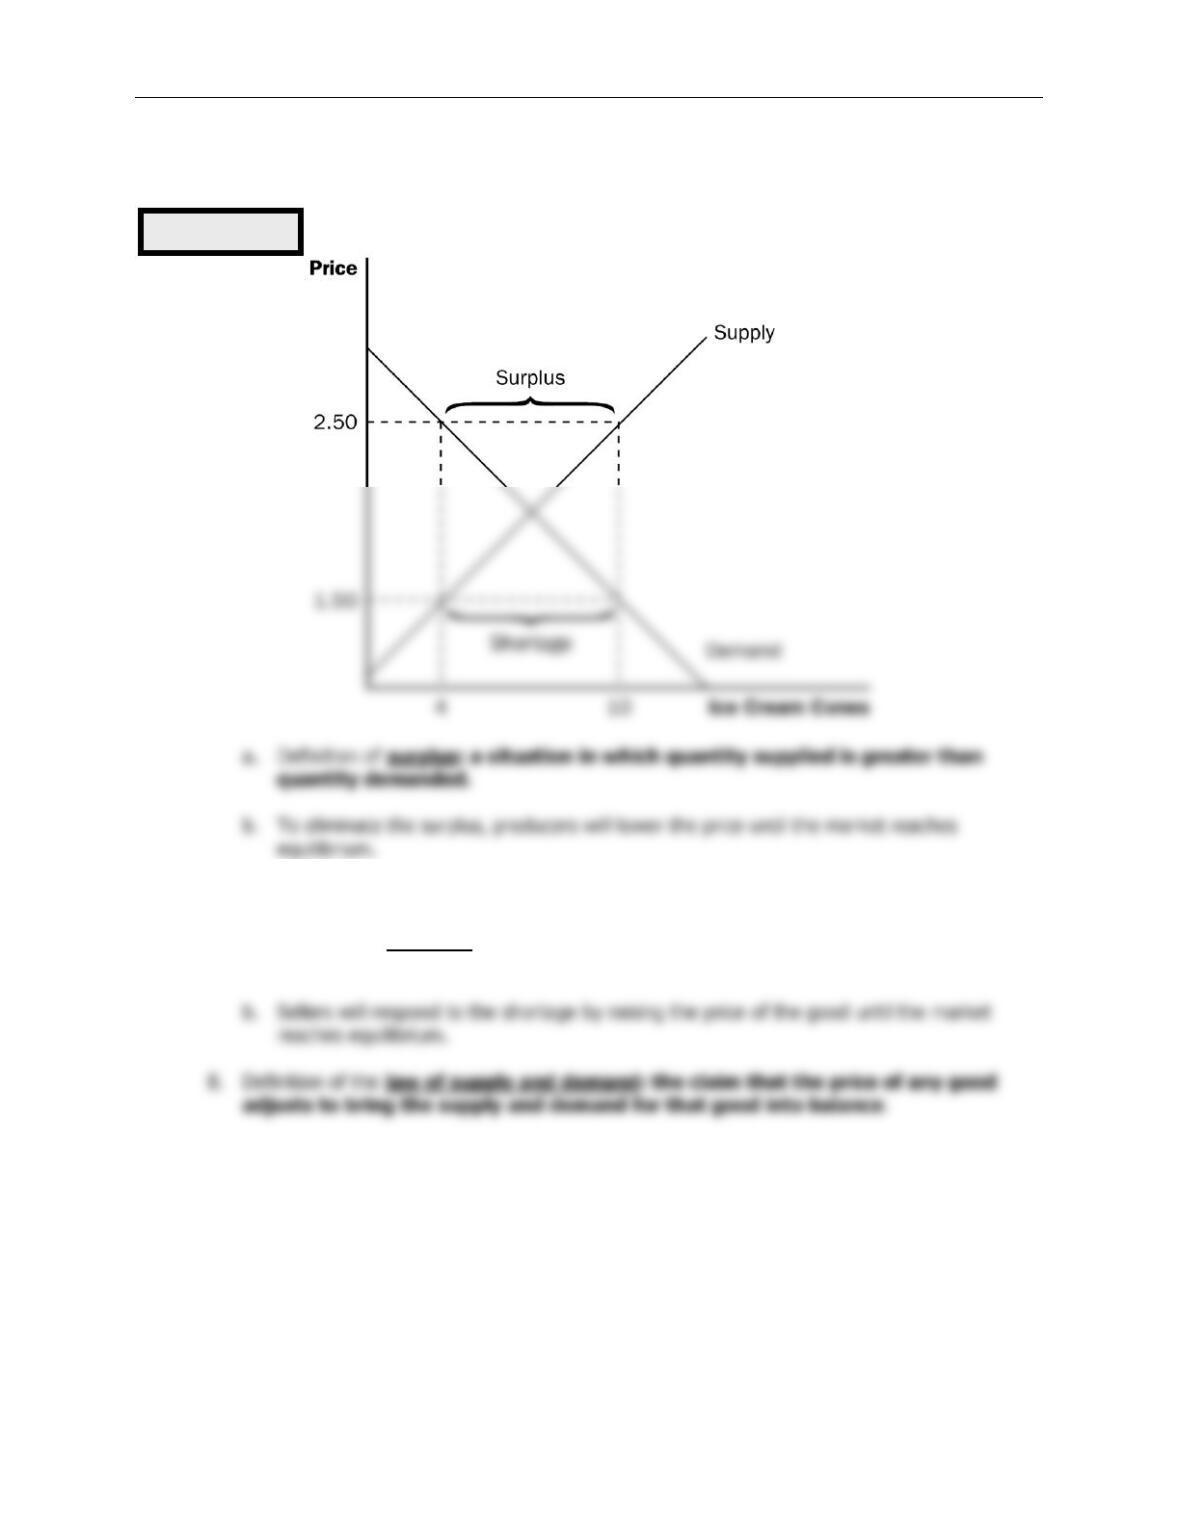
6. If the actual market price is higher than the equilibrium price, there will be a surplus of the
good.
7. If the actual price is lower than the equilibrium price, there will be a shortage of the good.
a. Definition of shortage: a situation in which quantity demanded is greater than
quantity supplied.
Figure 9
Chapter 4/The Market Forces of Supply and Demand ❖ 63
Activity 2—Campus Parking
Type: In-class assignment
Topics: Demand, supply, disequilibrium, shortage, rationing
Materials needed: A shortage of student parking on campus
Time: 35 minutes
Class limitations: Works in large lectures or small classes, if there is a campus parking
problem.
Purpose
Nothing seems to generate more heated discussion than campus parking. If your school has a
parking shortage this assignment brings the ideas of price rationing and resource allocation to
an issue close to the students’ hearts.
Instruction
Ask the class to answer the following questions. Give them time to write an answer to a
question, then discuss their answers before moving to the next question.
Common Answers and Points for Discussion
1. Write down three things that are true about the parking situation on campus.
2. What two problems do you think are most important?
3. What policies could the administration make to resolve these problems?
4. Who needs parking the most?
5. Who would pay the most for parking?
6. Use a supply-and-demand graph to analyze this problem.
64 ❖ Chapter 4/The Market Forces of Supply and Demand
B. Three Steps to Analyzing Changes in Equilibrium
1. Decide whether the event shifts the supply or demand curve (or perhaps both).
C. Example: A change in market equilibrium due to a shift in demand—the effect of hot weather on
the market for ice cream.
Table 3
Figure 10
Go through changes in supply and demand carefully. Show students why the
equilibrium price must change after one of the curves shifts. For example, point out
Many students initially have difficulty graphing this problem. They want to illustrate that
7. How would your policy proposals affect the market for parking?
Analysis of the various proposals in a supply-and-demand framework shows some popular
Chapter 4/The Market Forces of Supply and Demand ❖ 65
D. Shifts in Curves versus Movements along Curves
1. A shift in the demand curve is called a “change in demand.” A shift in the supply curve is
called a “change in supply.”
2. A movement along a fixed demand curve is called a “change in quantity demanded.” A
movement along a fixed supply curve is called a “change in quantity supplied.”
F. Example: A change in market equilibrium due to a shift in supply—the effect of a hurricane that
destroys part of the sugar-cane crop and drives up the price of sugar.
G. Example: Shifts in both supply and demand—the effect of hot weather and a hurricane that
destroys part of the sugar cane crop.
ALTERNATIVE CLASSROOM EXAMPLE:
Go through these examples of events that would shift either the demand or supply of #2 lead
pencils:
Emphasize that students should not think about the curves shifting “up” and “down”
It would helpful to students if you draw all four graphs (increase in demand,
decrease in demand, increase in supply, and decrease in supply) on the board at the
Figure 11
66 ❖ Chapter 4/The Market Forces of Supply and Demand
I. Summary
A. When an event shifts the supply or demand curve, we can examine the effects on the equilibrium
price and quantity.
V. Conclusion: How Prices Allocate Resources
A. The model of supply and demand is a powerful tool for analyzing markets.
B. Supply and demand together determine the prices of the economy’s goods and services.
1. These prices serve as signals that guide the allocation of scarce resources in the economy.
Figure 12
Make sure that you explain to students that two possible outcomes might result,
Table 4

Chapter 4/The Market Forces of Supply and Demand ❖ 67
Activity 3—Supply and Demand Article
Type: Take-home assignment
Topics: Shifts in supply or demand, changing equilibrium
Class limitations: Works in any class
Purpose
This assignment is an excellent way to determine which students need extra help in
understanding supply and demand. Students who have difficulty with it often need remedial
help. Allowing students to correct errors and then resubmit the assignment can be worthwhile
because it is fundamental to their understanding of how markets work.
Instructions
Give the students the following assignment:
Find an article in a recent newspaper or magazine illustrating a change in price or quantity in
some market. Analyze the situation using economic reasoning.
1. Has there been an increase or decrease in demand? Factors that could shift the
demand curve include changes in preferences, changes in income, changes in the
graph and clearly indicate which curve shifts.
Ask students to turn in a copy of the article along with their explanation. Warn students to
avoid advertisements because they contain little information. They should be wary of
commodity and financial markets unless they have a good understanding of the particular
market. Markets for ordinary goods and services are most easily analyzed.
Points for Discussion