CA 4-7
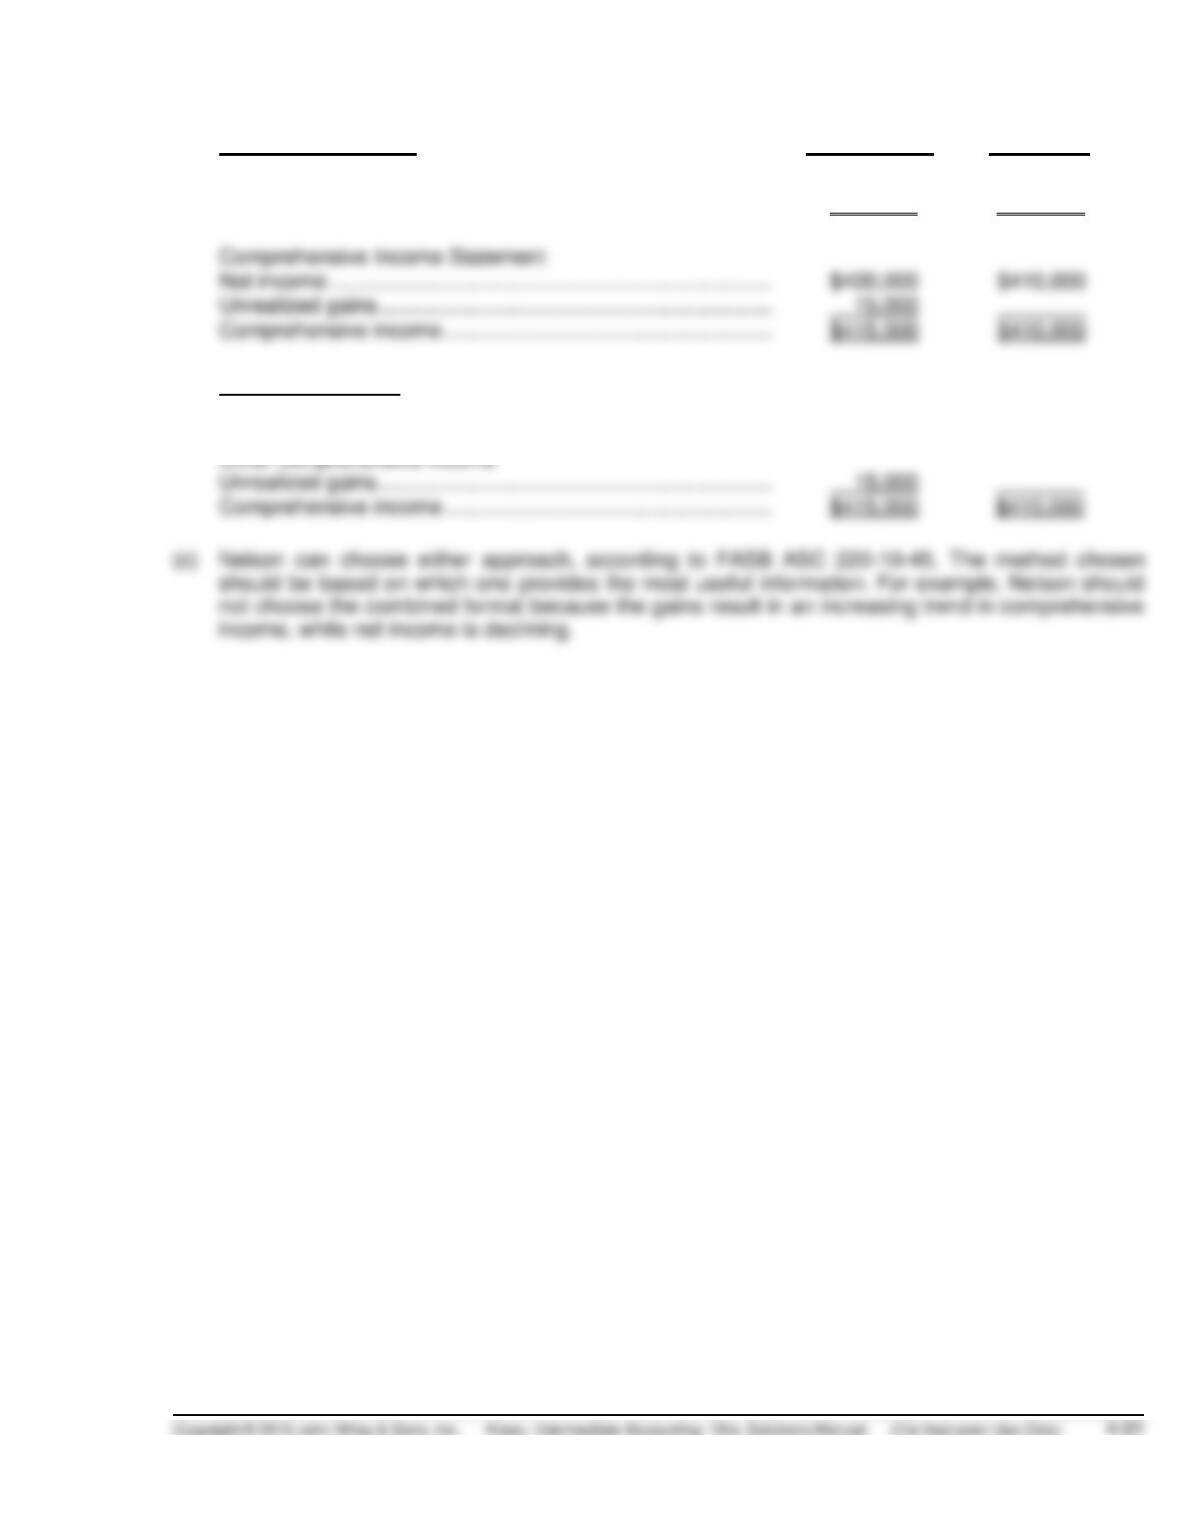
(a) Separate Statement
Current Year
Prior Year
. . . income components . . .
Net income ………………………………………………………………….
$400,000
$410,000
Comprehensive Income Statement
Net income ………………………………………………………………….
Unrealized gains …………………………………………………………..
15,000
(b) Combined Format
. . . income components . . .
Net income …………………………………………………………………..
$400,000
$410,000
Other comprehensive income
Unrealized gains ……………………………………………………………
15,000
FINANCIAL REPORTING PROBLEM
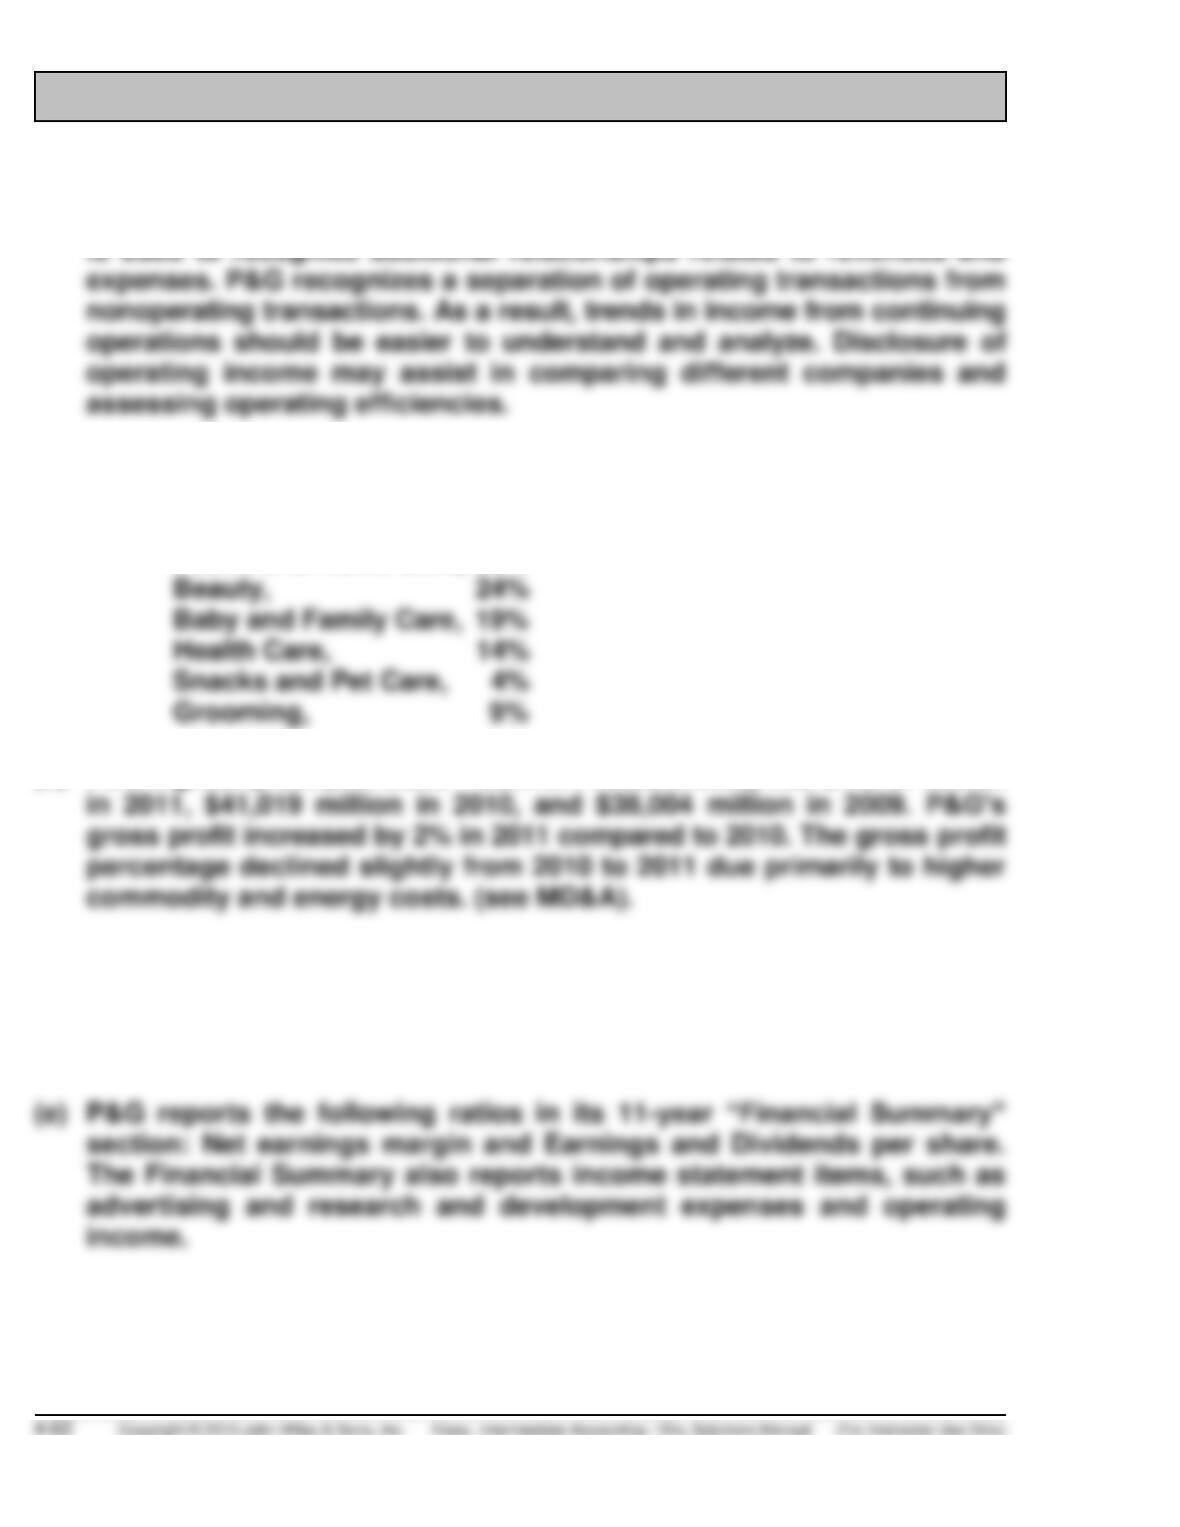
(a) P&G uses the multiple-step income statement because it separates
operating from nonoperating activities. A multiple-step income statement
(b) P&G operates in the consumer products market. The company separates
its operations into six global segments: (sales by segment)
Fabric and Home Care, 30%
(c) P&G’s gross profit (Net Sales – Cost of Products Sold) was $41,791 million
(d) P&G probably makes a distinction between operating and nonoperating
revenue for the reasons mentioned in the solution to Part (a). By
separating out these revenue and expense items, the statement reader
can see the separate impacts of operating and financing activities.
COMPARATIVE ANALYSIS CASE
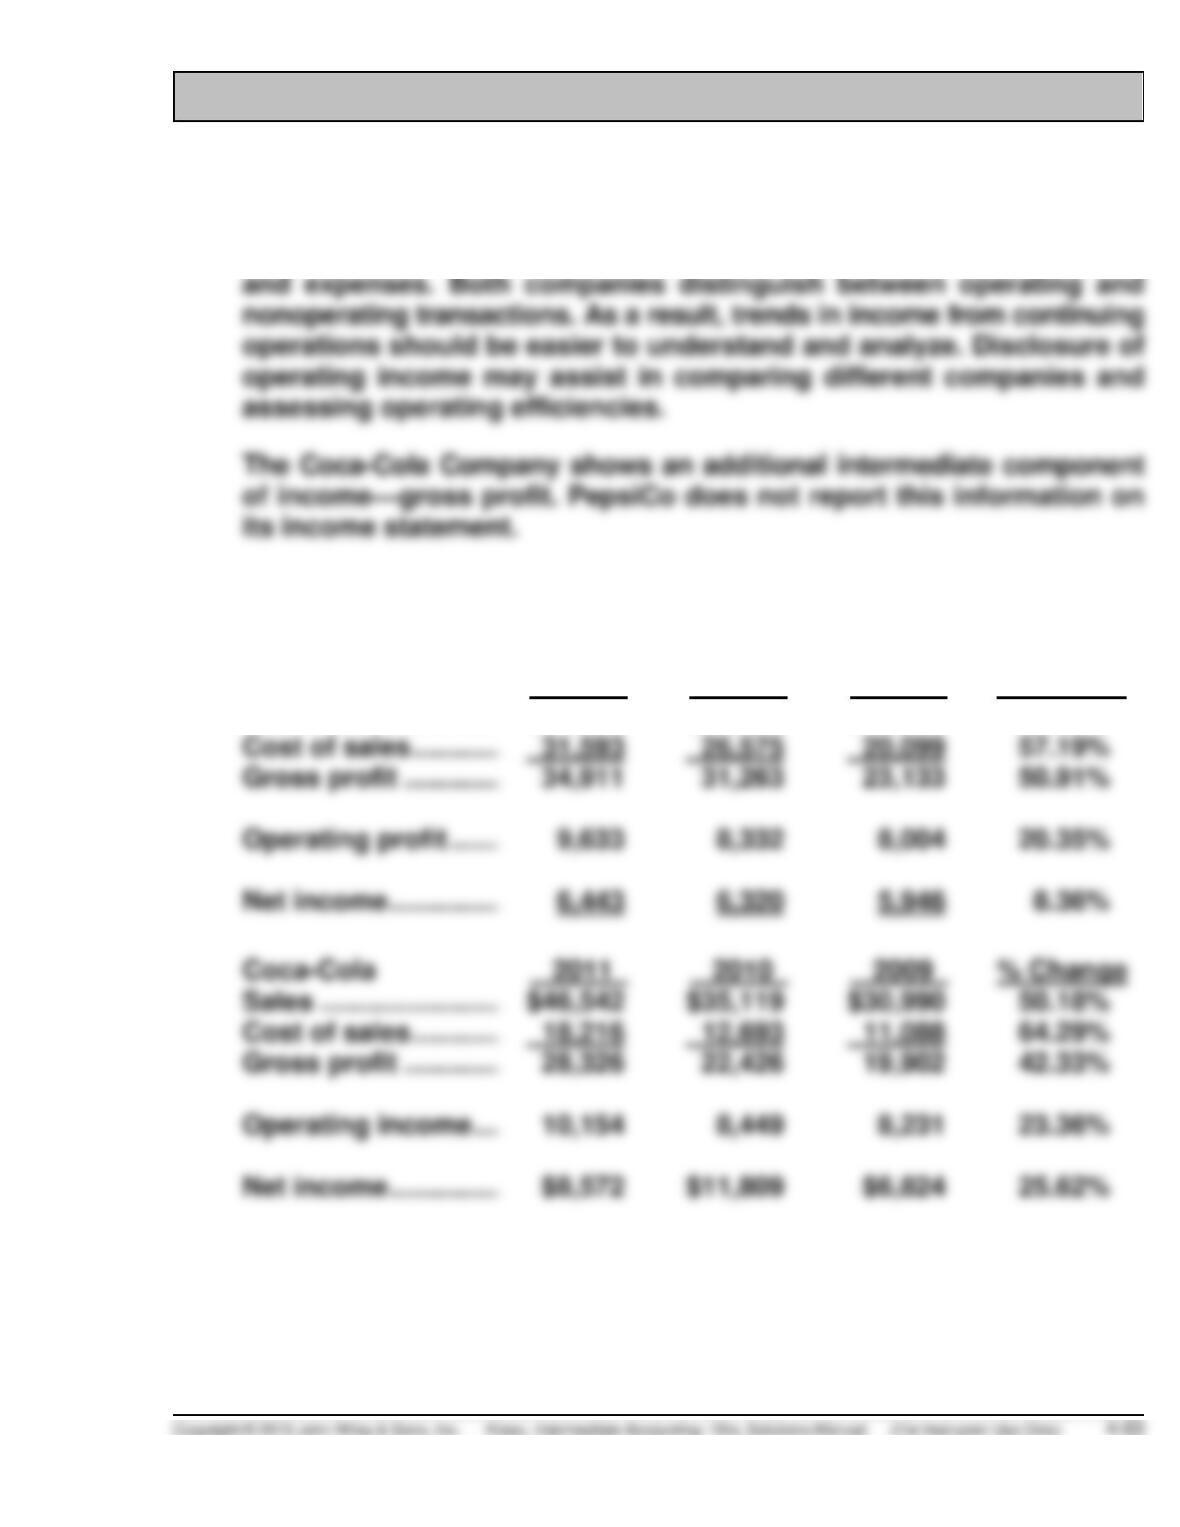
(a) Both companies are using the multiple-step format in presenting
income statement information. Companies use the multiple-step in–
come statement to recognize additional relationships related to revenues
(b) The gross profit, operating profit, and net income for these two companies
are as follows:
PepsiCo
2011
2010
2009
% Change
Net revenue ……………….
$66,504
$57,838
$43,232
53.83%
Net income …………………
Gross profit …………….
42.33%
As shown in the table above, however, Coca-Cola had greater growth
in net income from 2009 to 2011. PepsiCo reported stronger growth in
net sales over the three-year period. Both companies are doing well.
COMPARATIVE ANALYSIS CASE (Continued)
(c) Coca-Cola has reported gains on the equity transactions related to
bottling operations. PepsiCo reported gains on its equity investments.
PepsiCo provided the following disclosure for Items Affecting
Comparability:
ITEMS AFFECTING COMPARABILITY
The year-over-year comparisons of our financial results are affected
by the following items:
53rd Week
Inventory Fair Value Adjustments
In 2011, we recorded $46 million ($28 million after–tax or $0.02 per share) of
incremental costs in cost of sales related to fair value adjustments to the
Venezuela Currency Devaluation
As of the beginning of our 2010 fiscal year, we recorded a one– time $120 million
net charge related to our change to hyperinflationary accounting for our
COMPARATIVE ANALYSIS CASE (Continued)
Asset Write– Off
In 2010, we recorded a $145 million charge ($92 million after– tax or
$0.06 per share) related to a change in scope of one release in our
Foundation Contribution
In 2010, we made a $100 million ($64 million after– tax or $0.04 per share)
contribution to The PepsiCo Foundation, Inc., in order to fund charitable
and social programs over the next several years. This contribution
was recorded in corporate unallocated expenses.
Debt Repurchase
In 2010, we paid $672 million in a cash tender offer to repurchase $500 million
Non–GAAP Measures
Certain measures contained in this Annual Report are financial measures that
are adjusted for items affecting comparability (see “Items Affecting
Comparability” for a detailed list and description of each of these items), as
well as, in certain instances, adjusted for foreign currency. These measures
COMPARATIVE ANALYSIS CASE (Continued)
our ongoing performance and with how management evaluates our
operational results and trends. These measures are not, and should
not be viewed as, a substitute for U.S. GAAP reporting measures.
In the discussions of net revenue and operating profit below, effective
Servings
Since our divisions each use different measures of physical unit volume
(i.e., kilos, gallons, pounds and case sales), a common servings metric is
necessary to reflect our consolidated physical unit volume. Our
FINANCIAL STATEMENT ANALYSIS CASE 1
(a) Depending on the company chosen, student answers will vary. Given
the ready availability, the analysis for Walgreens is provided below:
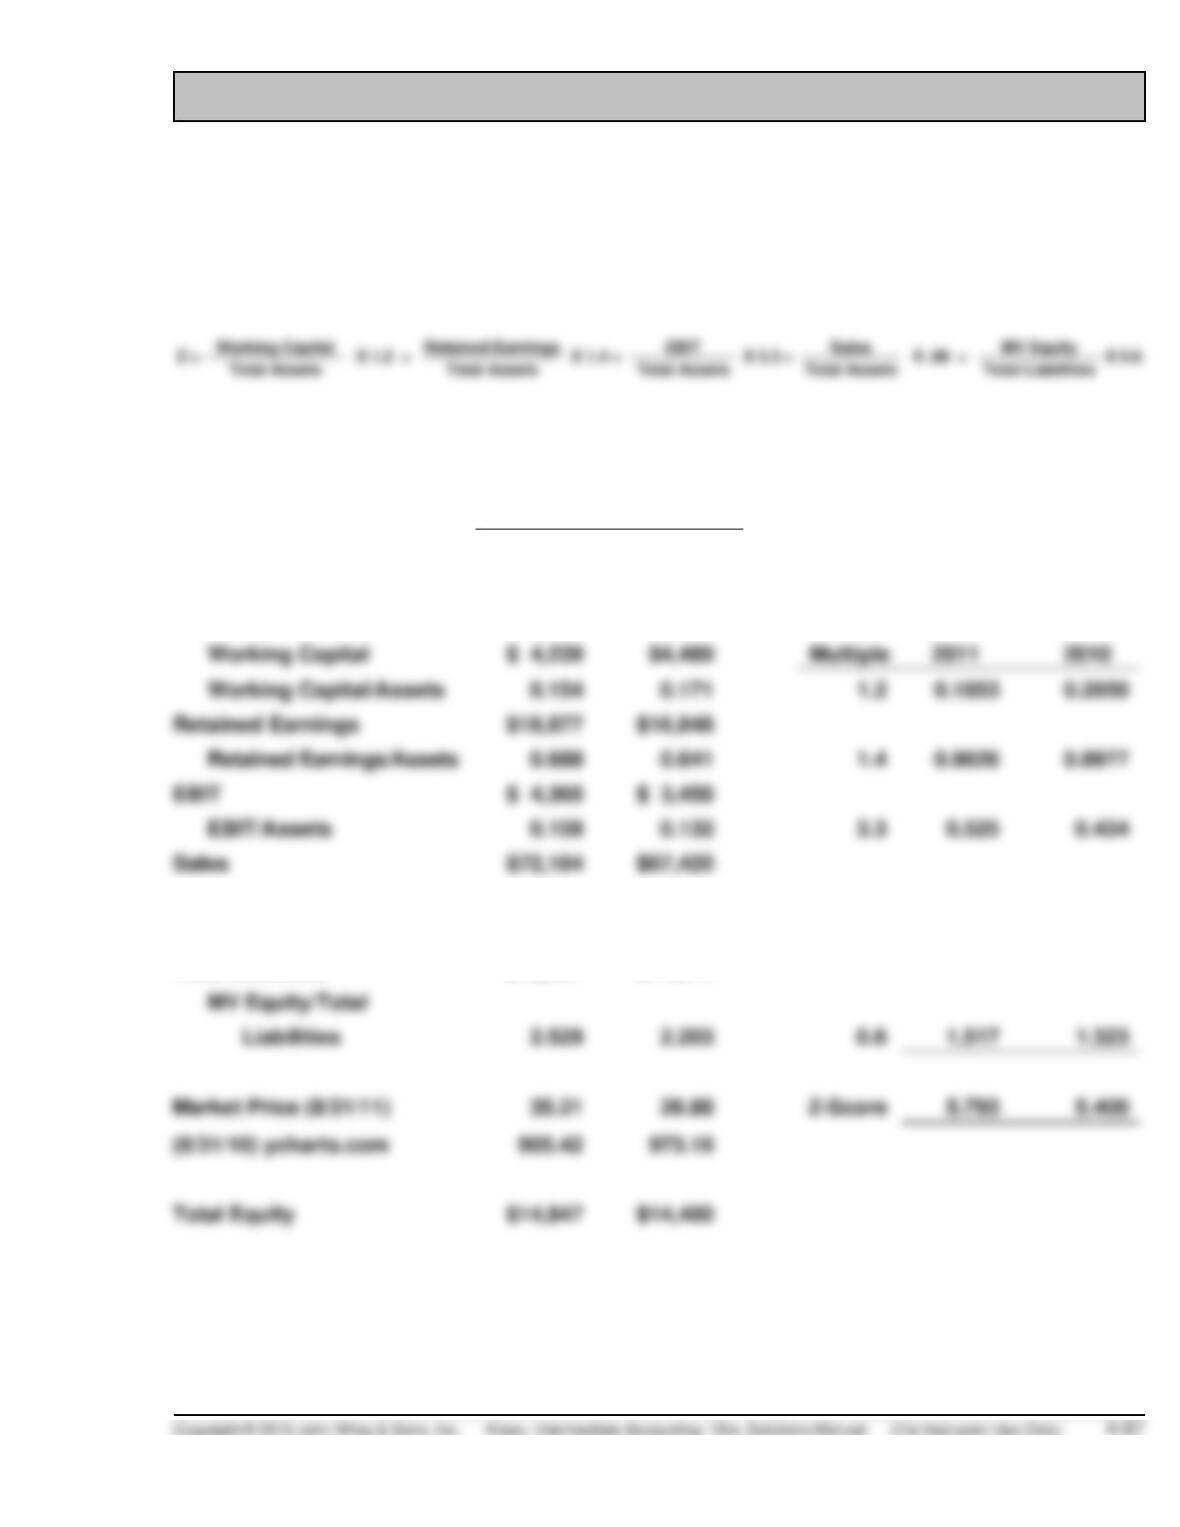
Z-Score Analysis
Walgreens ($ 000,000)
2011
2010
Total Assets
$27,454
$26,275
Current Assets
$12,322
$11,922
Current Liabilities
$ 8,083
$ 7,433
Working Capital
$ 4,239
Working Capital/Assets
0.154
0.171
0.1853
Retained Earnings
$18,877
$16,848
Retained Earnings/Assets
0.688
0.641
0.9626
EBIT/Assets
0.159
0.132
0.525
0.434
Sales
$67,420
Z-Score
Z-Score
Sales/Assets
2.629
2.566
0.99
2.603
2.540
MV Equity
$31,880
$26,159
Total Liabilities
$12,607
$11,875
Liabilities
2.529
2.203
1.517
1.323
Market Price (8/31/11)
35.21
26.88
Z-Score
5.793
905.42
Total Equity
$14,847
$14,400
FINANCIAL STATEMENT ANALYSIS CASE 1 (Continued)
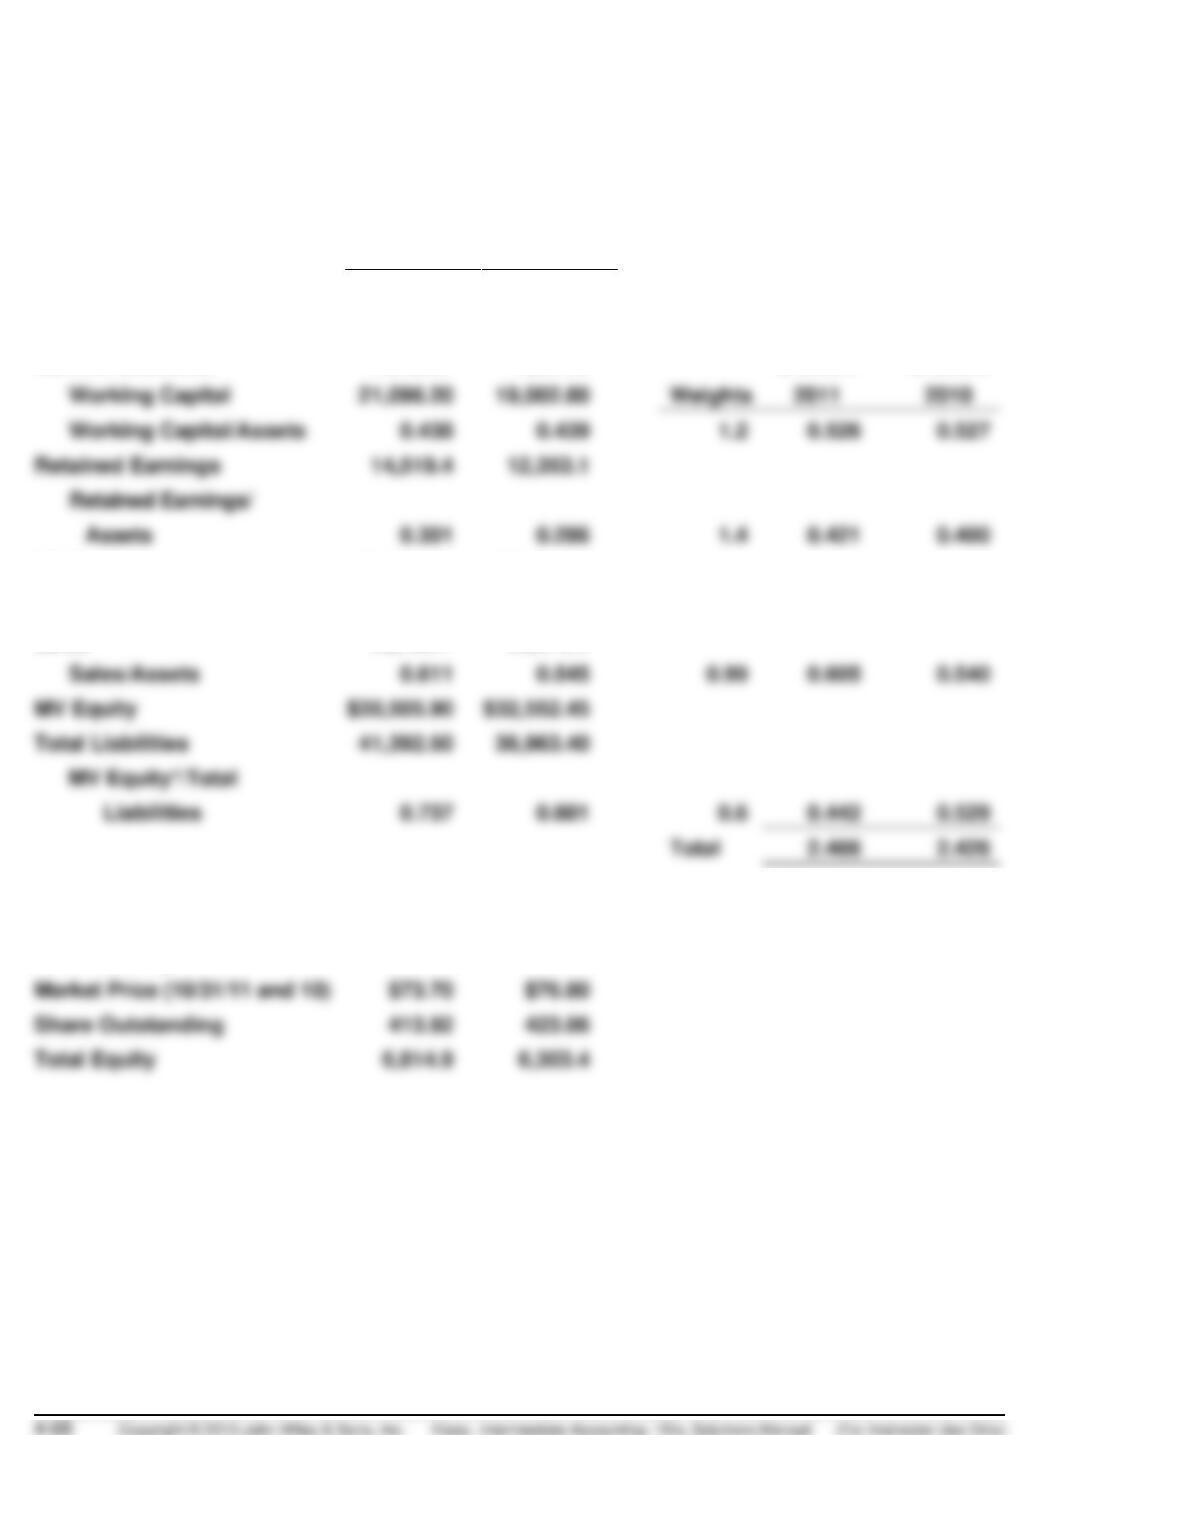
Deere & Co. ($ 000,000)
Oct. 31,
2011
Oct. 31,
2010
Total Assets
48,207.4
43,266.8
Current Assets
38,816.7
33,366.8
Current Liabilities
17,720.5
14,364.0
2011
Working Capital
21,096.20
19,002.80
Weights
Working Capital/Assets
0.438
0.439
1.2
0.527
Retained Earnings
14,519.4
12,353.1
Retained Earnings/
Assets
1.4
0.421
0.400
Z-Score
Z-Score
EBIT
$6,904.80
$5,661.90
EBIT/Assets
0.143
0.131
3.3
0.472
0.432
Sales
29,466.1
23,573.2
Sales/Assets
0.611
0.545
MV Equity
Total Liabilities
41,392.50
36,963.40
Total
2.426
*Market price X Shares
Outstanding
Market Price (10/31/11 and 10)
Share Outstanding
Total Equity
FINANCIAL STATEMENT ANALYSIS CASE 1 (Continued)
(b) Walgreens’ Z-score in 2011 has increased but is still well above the
cutoff score for companies that are unlikely to fail. The company has
improved on just about all components of the Z-score.
FINANCIAL STATEMENT ANALYSIS CASE 2
Earnings (loss) per common share
Earnings from continuing operations
($97,700,000 ÷ 177,636,000) ……………………………………….
$0.55
Discontinued operations………………………………………………….
Extraordinary items ……………………………………………………….
FINANCIAL STATEMENT ANALYSIS CASE 3
(a) Assumptions and estimates related to items such as bad debt expense,
warranties, or the useful lives or residual values for fixed assets could
result in income being overstated.
(b) See the table below.