20-1
Kinkead Equipment, Ltd.
Teaching Commentary
OVERVIEW
Profit variance analysis is the process of summarizing what happened to profits during the period to highlight the salient
managerial issues. Variance analysis is the formal step leading to determining what corrective actions management calls
for. Thus, it is a key link in the management control process. This element is underutilized in many companies because
of the lack of a meaningful analytical framework. The accountants handle it in a way that is too technical. This case
illustrates a different profit variance framework as a “new idea” in management control.
Historically, variance analysis involved a simple methodology where actual results were compared with the
budget, line by line (Phase I thinking). Shank and Churchill (Accounting Review, 1977), who proposed a management–
PHASE I THINKING: THE “ANNUAL REPORT” APPROACH TO VARIANCE ANALYSIS
A straightforward, simple-minded explanation of the difference between actual profit (£1,270) and the budgeted
profit (£1,246) might proceed as follows:
PLAN ACTUAL
Sales £6,215 £6,319
Gross Margin £2,590 (41.7%) £2,660 (42.1%)
20-2
Incidentally, this type of variance analysis is
what one usually sees in published annual reports (where
the comparison is typically between last year and this
year). If we limit ourselves to this type of analysis, we
PHASE I THINKING
PERFORMANCE EVALUATION SUMMARY
• Good sales performance (1+% above plan)
• Good manufacturing cost control (margins above
plan)
How accurately does the above summary reflect
the actual performance of Kinkead? One objective of this
case is to demonstrate that the above analysis is
dangerously inept and very misleading. Part of the reason
PHASE II THINKING: A MANAGEMENT-
ORIENTED APPROACH TO VARIANCE
ANALYSIS
1. Identify the key causal factors that affect profits.
2. Break down the overall profit variance by these
key causal factors.
3. Focus always on the profit impact of variation in
each causal factor.
6. Stop the process when the added complexity at a
newly created level is not justified by added
useful insights into the causal factors underlying
the overall profit variance.
20-3
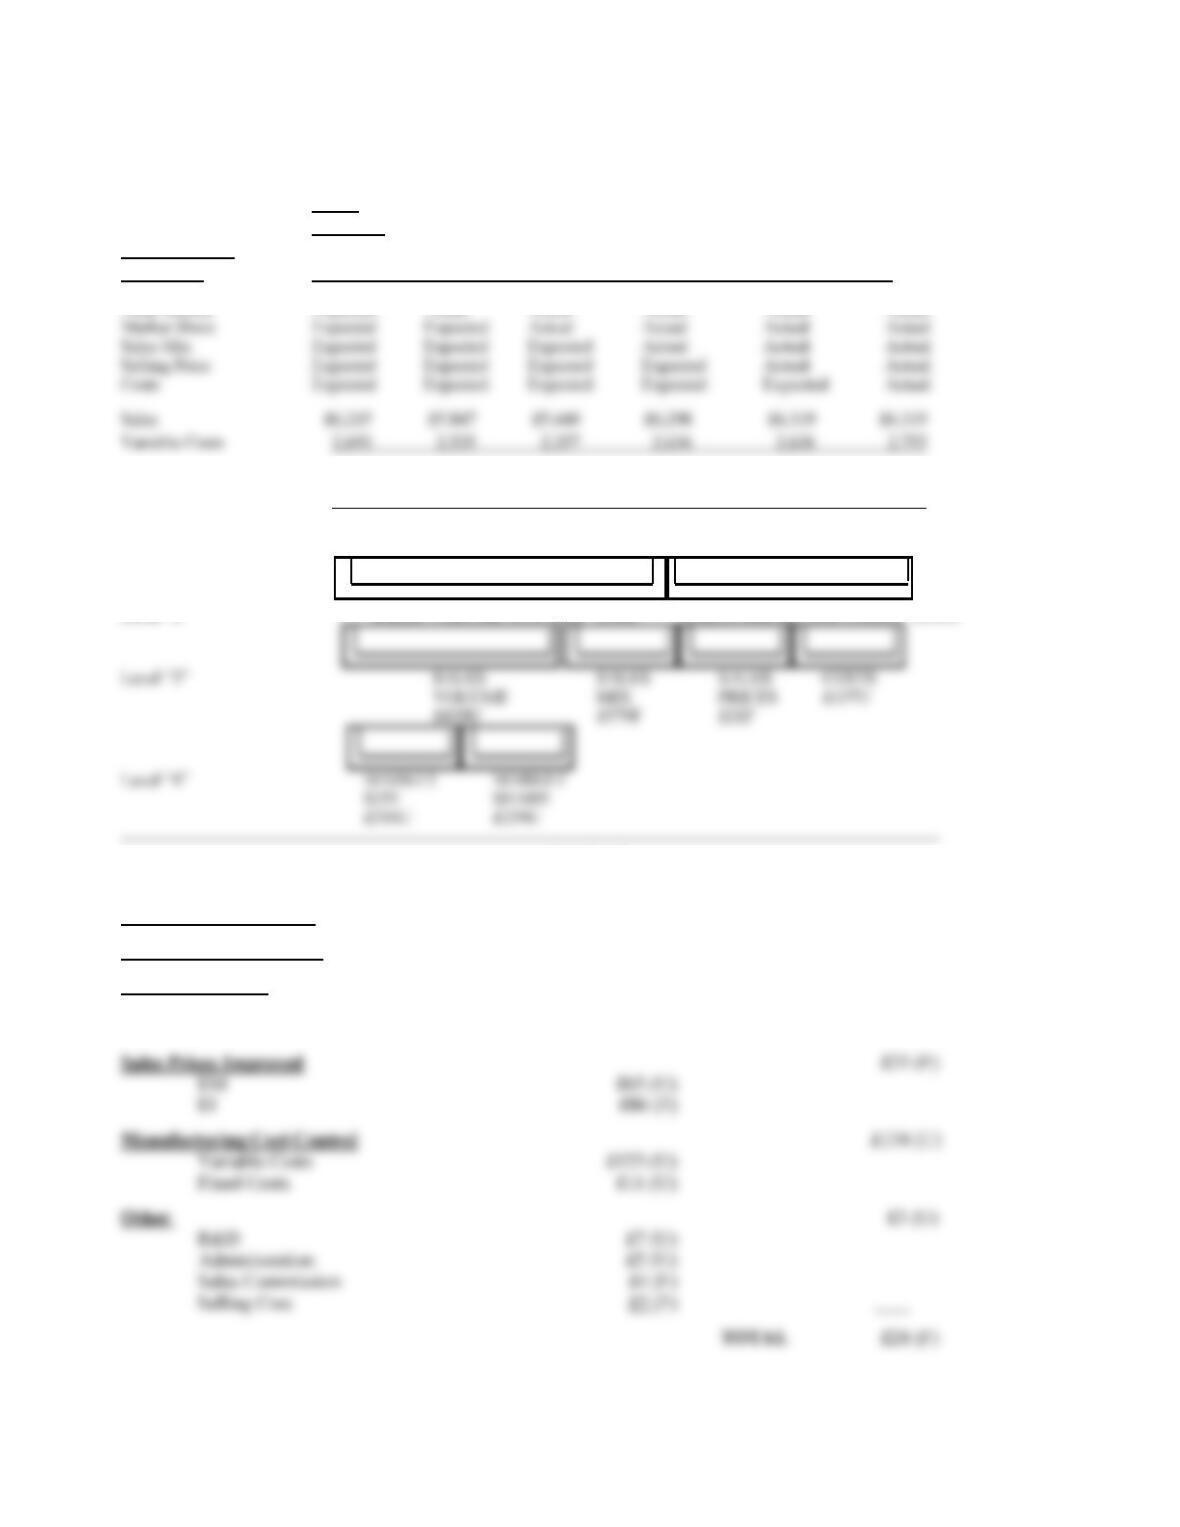
Exhibit 2
Variance Summary for the Phase II Approach
Overall Market Decline £210 (U)
Share of Market Decline £229 (U)
Sales Mix Change £579 (F)
EM £1,222 (U)
EI £1,801 (F)
Exhibit 1
Variance Calculations Using Shank and Churchill’s Management-Oriented Framework
PLAN
ACTUAL
KEY CAUSAL
FACTORS 1 2 3 4 5 6
Total Market Expected Actual Actual Actual Actual Actual
Contribution £3,522 £3,312 £3,083 £3,662 £3,683 £3,564
Fixed Costs 2,276 2,276 2,276 2,276 2,276 2,294
Profit £1,246 £1,036 £807 £1,386 £1,407 £1,270
Level “1” OVERALL VARIANCE £24F
Level “2” SALES VOLUME AND MIX £140F SALES PRICES AND COSTS £116U
20-4
PHASE II THINKING
PERFORMANCE EVALUATION SUMMARY
The overall evaluation of the general manager
would probably be “satisfactory,” although there are
1. Sales volume, share of market, and sales mix
variances are calculated on the presumption that
Kinkead is essentially a single-product firm with
two different varieties of the product. This
means that the target customers for EM and EI
are the same and that they view the two products
characteristics and compete in very different
markets, thereby requiring quite different
strategies. It is, therefore, more useful to
calculate market size and market share variances
separately for EM and EI. Just introducing the
concept of a sales mix variance implies that the
average standard profit contribution across EM
and EI together is meaningful.
firm such as General Electric, it is much less
clear whether a sales mix variance across jet
engines, steam turbines, and light bulbs really
makes any sense. This is more nearly the case
for Kinkead since one unit of EM (which costs
An important issue in the history of
many industries is to determine when product
differentiation has progressed sufficiently that
what was a single business with two varieties is
now two businesses. Some examples include the
PHASE III THINKING: VARIANCE ANALYSIS
USING A STRATEGIC FRAMEWORK
Performance evaluation—which is a critical
component of the management control process—needs to
optimize performance with respect to those dimensions.
Thus, superior performance can best be achieved by
tailoring control systems to the requirements of particular
strategies.
Let’s first define and briefly elaborate the
concept of strategy before illustrating how to link
strategic considerations with variances for management
control and evaluation. Strategy has been conceptualized
following three strategic missions that a business unit can
adopt.
Build: This mission implies a goal of increased market
share, even at the expense of short-term earnings
20-5
that the cash throw-off from its current
operations would usually be insufficient to meet
Hold: This strategic mission is geared to the protection
of the business unit’s market share and
Harvest: This mission implies a goal of maximizing
short-term earnings and cash flow, even at the
In terms of competitive strategy, Porter (1980)
has proposed the following two generic ways in which
businesses can develop substainable competitive
advantage.
Low Cost: The primary focus of this strategy is to
achieve low cost relative to competitors. Cost
leadership can be achieved through approaches
such as economics of scale in production,
Differentiation: The primary focus of this strategy is to
differentiate the product offering of the business
(Caterpillar Tractors in construction equipment),
product design and product features (Hewlett–
Packard in electronics), and/or product
Although they both are industrial measuring instruments,
they face very different competitive conditions that most
likely call for different strategies. Exhibit 3 summarizes
the differing environments and the resulting strategic
EM and EI as two varieties of one product, competing as
substitutes, with a single strategy. Thus, a sales mix
variance was computed. Exhibits 4 and 5 treat EM and EI
as different products with dissimilar strategies.
Therefore, there is no attempt to calculate a sales mix
variance. The basic idea is that even though a sales mix
variance can always be calculated, the concept is only
meaningful when a single business framework is
applicable. For the same reason, Exhibits 4 and 5 report
the market size and market share variances for EM and EI

20-6
The overall performance of Kinkead would
probably be judged as seriously “unsatisfactory.” The
analysis to strategic objectives. Neither Phase I nor Phase
II analyses explicitly focused on ways to improve

20-7
EXHIBIT 3
Strategic Contexts of the Two Businesses
EM EI
Overall Market (Units): Plan 828,670 248,600
Actual 653,690 361,375
Kinkead’s Margin: Plan £14 £95
Actual £12 £96
Industry Prices: Actual £40 £99
We are well below “market” We are well above
“market”
Selling Commission 3% of Sales (£1 per unit) 10% of Sales (£15 per
unit)
Kinkead’s Apparent Strategic Mission “Hold” “Skim” or “Harvest”
Kinkead’s Apparent Competitive Strategy The low price implies The high price implies
we are trying for low cost we are trying for a
position differentiation position
A More Plausible Strategy “Harvest” “Build”
20-8
Exhibit 4
Variance Calculations Using a Strategic Framework
(1) (2) (3) (4) (5)
Key Causal Factors Plan Actual
Total Market Expected Actual Actual Actual Actual
EM
Sales £2,486 £1,961 £1,961 £1,896 £1,896
Variable Costs 1,326 1,046 1,046 1,046 1,110
Contribution £1,160 £915 £915 £850 £786
MARKET MARKET SALES VARIABLE
SIZE SHARE PRICE COSTS
£245(U) -0- £65(U) £64(U)
FIRMWIDE FIXED COSTS (By Responsibility Centers)
Budget Actual Variance
Manufacturing £1,388 £1,399 £11U
20-9
EXHIBIT 5
Variance Summary for the Phase III Approach
ELECTRIC METERS £374 (U)
Market Size £245 (U)
ELECTRONIC INSTRUMENTS £416 (F)
Market Size 1,071 (F)
FIRMWIDE FIXED COSTS £18 (U)
Manufacturing 11 (U)
20–10
EXHIBIT 6
Phase III Thinking
Performance Evaluation Summary
Electric Meters
“Harvest” vs. “Hold”
Electronic Instruments
“Build” vs. “Skim”
Functional Areas
Comments
Overall
Evaluation
Comments
Overall
Evaluation
Marketing
here in the face of our major
marketing problem?
We underspent the selling
cost budget (3 + 5) £8F
But, why are we cutting back
here in the face of our major
marketing problem?
If we had held prices and
share, decline in this mature
business would have cost us
£245U
This market declined 22%.
Why are we sacrificing
margins to hold market
position in this mature,
declining, lower- margin
business?
We raised prices to maintain
margins and to ration our
scarce capacity (our price
was £153 versus the industry
that grew 45% during this
period. Why did we decide
to improve margins at the
expense of SOM in this fast
growing, higher-margin
business?
Manufacturing
leader, where are the benefits
of our cumulative experience
or our scale economies?
Performance
product perceived as better?
Apparently not, based on
share data.
Performance
Manufacturing cost control
was lousy and cost the firm
(65 + 11)
£76U
Variable manufacturing costs
showed an unfavorable
variance of £58U.
Does the higher
R&D
Why did manufacturing costs
not go down as a result of
overspending the R&D
budget?
Poor
Performance
If this is process R&D, it
isn’t working. If it is product
R&D, where are the results?
Poor
Performance
Administration
Inadequate control over
overhead costs, given the
need to become the low cost
producer
Poor
Performance
Administration budget
overspent a bit (£5U).
How does this relate to cost
control?
Not Satisfactory

20–11
CONCLUSIONS FROM THE ANALYSIS
Variance analysis represents a key link in the
management control process. It involves two steps. First,
one needs to break down the overall profit variance by
different implications for this first step. That is, the
detailed variance calculations do differ across the three
approaches. Their implications differ even more for the
second step. The calculational aspects identify the
variance, on the one hand, and favorable or unfavorable
performance, on the other, depends on the strategic
context of the business under evaluation.
No doubt, judgments about managerial
performance can be dramatically different under Phase I,
TEACHING STRATEGY