18-1
Graham, Inc.
Teaching Commentary
OVERVIEW
This short case involves no business issues regarding the product, the market, the competition, the value chain, or the
company’s operating practices. In this sense, the case is very shallow. It deals with only one issue—choice of an
ANSWERS TO ASSIGNMENT QUESTIONS
Question 1
The answer to Question 1 is given as line 4 in Exhibit A. I like to start the class by handing out a blank version
of this exhibit (both columns left blank) and then working through each line for both months (July and August). Line 4
Question 2
A Normal Month
Sales ~1,600,000
Production ~1,600,000
(at sales value)
“Profit Model” (per the technical note)
Direct Costing
Absorption Costing
18-2
Actual Profit vs. “Normal” Profit for August
Direct Absorption
August Profit 34 (23)
1. Sales Effect
(855 vs. 1,008) 153U (635 vs. 742) 107U
Question 3
JULY PROFIT
DC AC
–73
18-3
AUGUST PROFIT
DC AC
Sales 1347 .63 = 849 Sales 633
Question 4
It certainly can! The problem arises whenever the production level and the sales level are not matched, whether
that is for a day, a week, a month, or a year.
Question 5
I like to try to answer this question by first asking students which month was “better” for Graham: July or
Which month was “better”?
Sales July = ~70% of Normal
Spending July = 9U on Normal Production
August = 4U on 60% of Normal Production
Overall Assessment Neither month was very good! That is, both months are so poor, one way or another, that “common
In many businesses, there are time periods when sales exceeds production, and vice versa. The answer here is
not to always build a factory big enough to meet sales demand in peak periods. Consider “seasonal” businesses, for
example. Level production versus level inventory is a classic choice in such situations that cannot be resolved simple-
mindedly.
Consider a Christmas toys manufacturer that sells in only two months (October and November) but produces
equally across twelve months. Absorption costing will show profit in all twelve months, which doesn’t seem “right” to
many managers. But direct costing will show losses in ten months, which also seems stilted.
The “All–Fixed” Company in the technical note does not fit either of these two extreme examples. And it has
Profit
Units Units
Produced Sold Absorption Direct
January 2,000 1,000 $550 $(200)
For this example, neither set of three profit numbers seems to be a very good reflection of the underlying
economic facts. The $550 profit in January under absorption costing seems “unduly” inflated by the big inventory build
up. But the $800 profit in March under direct costing also seems “unduly” inflated as a result of the losses in January,
Question 6
What I recommend is the following:
18-5
5. For any particular business setting, some choice must be made. In the “real world,” that choice comes down to
absorption costing or direct costing. Each will have plusses and minuses.
TEACHING STRATEGY
I use this case as part of the sequence on choosing a cost system in the required managerial accounting course at Tuck.
It can be covered in one ninety-minute class session. But the instructor must make a choice. If the purpose of the class is
primarily drill on the basic calculational issues, most of the time can be devoted to Questions 1, 2, 3, and 4, with some
attention at the end to Questions 5 and 6. My experience is that students will take all the class time you allow them on
calculational issues.
18-6
EXHIBIT A
August July
1. “Standard” or “Normal” Fixed Factory Overhead
(per the Direct Costing Income Statements) 270,280 263,448
5. Fixed Factory Overhead % of Sales
712 −492 =220
1,347 =16.3%
192
1,132 =16.9% *
*This difference must be due to changes in product mix.
18-7
EXHIBIT B
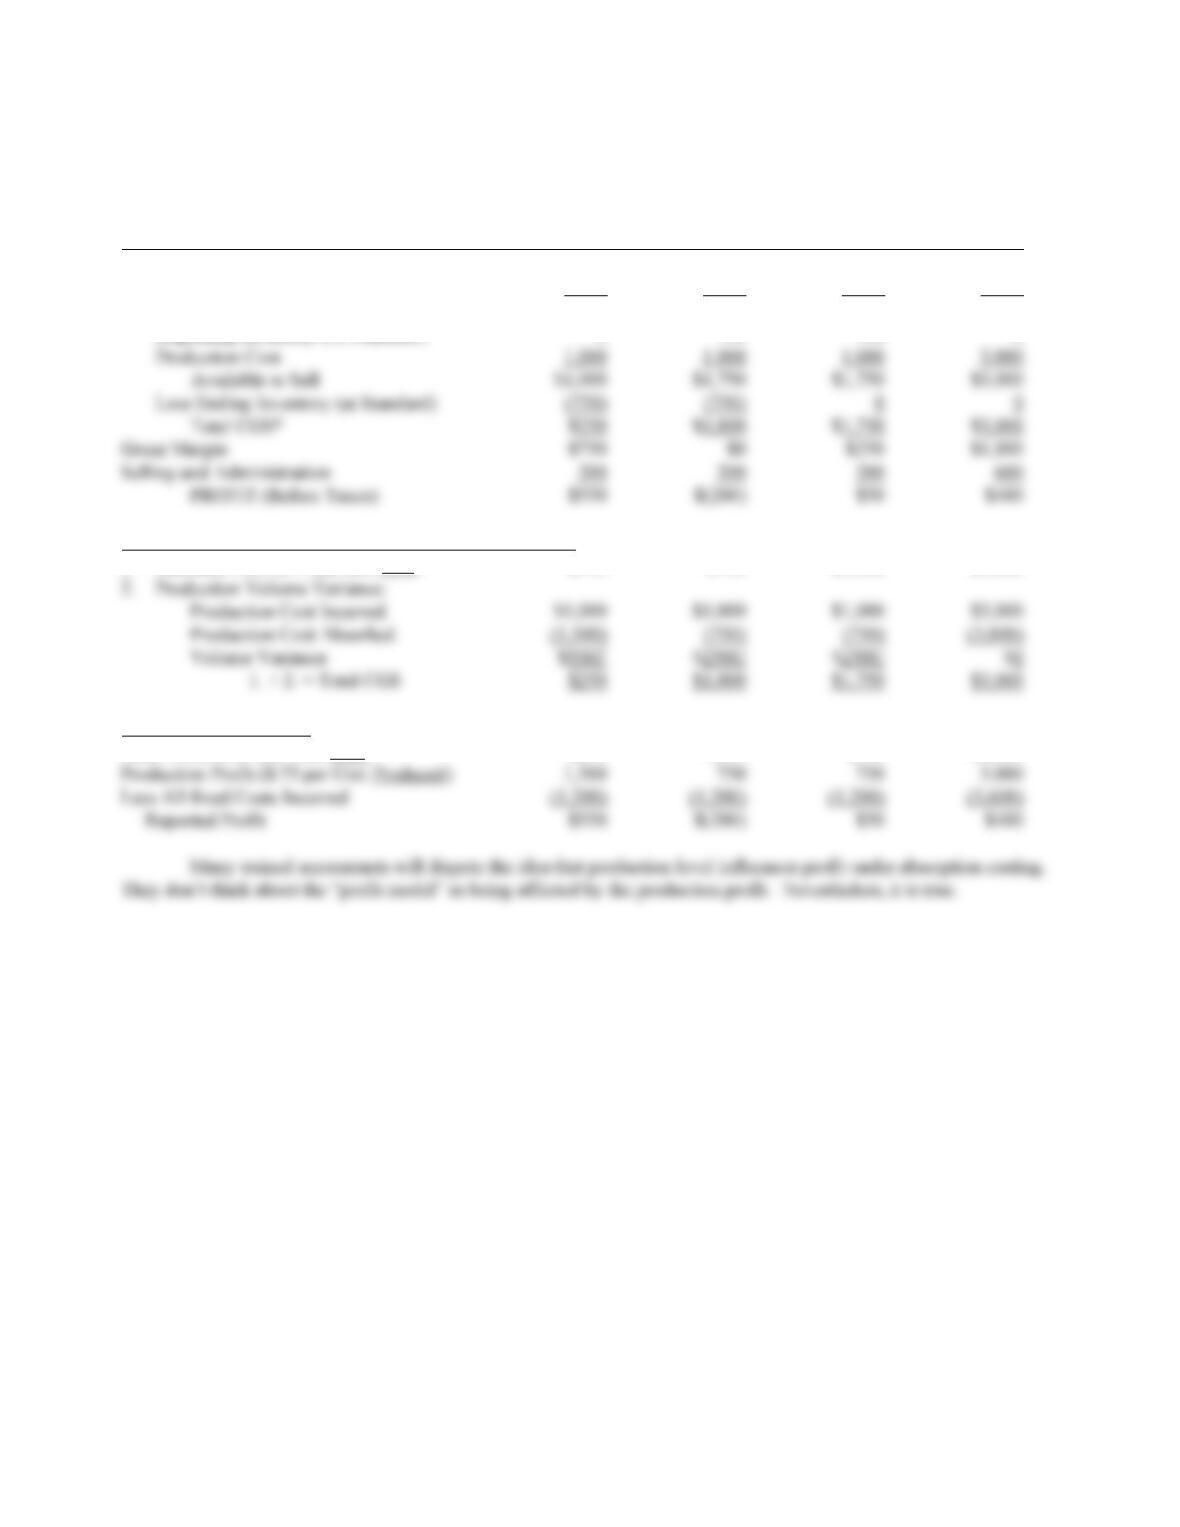
Conventional GAAP Accounting (Absorption Costing)
January February March Total
Sales $1,000 $1,000 $2,000 $4,000
Cost of Goods Sold:
Beginning Inventory (At Standard) 0 750 750 0
*An alternative way of thinking about the CGS calculation:
1. Standard CGS ($.75 per unit sold) $750 $750 $1,500 $3,000
The “Profit Model” Idea
Sales Profit ($.25 per Unit Sold) $250 $250 $500 $1,000
18-8
EXHIBIT C
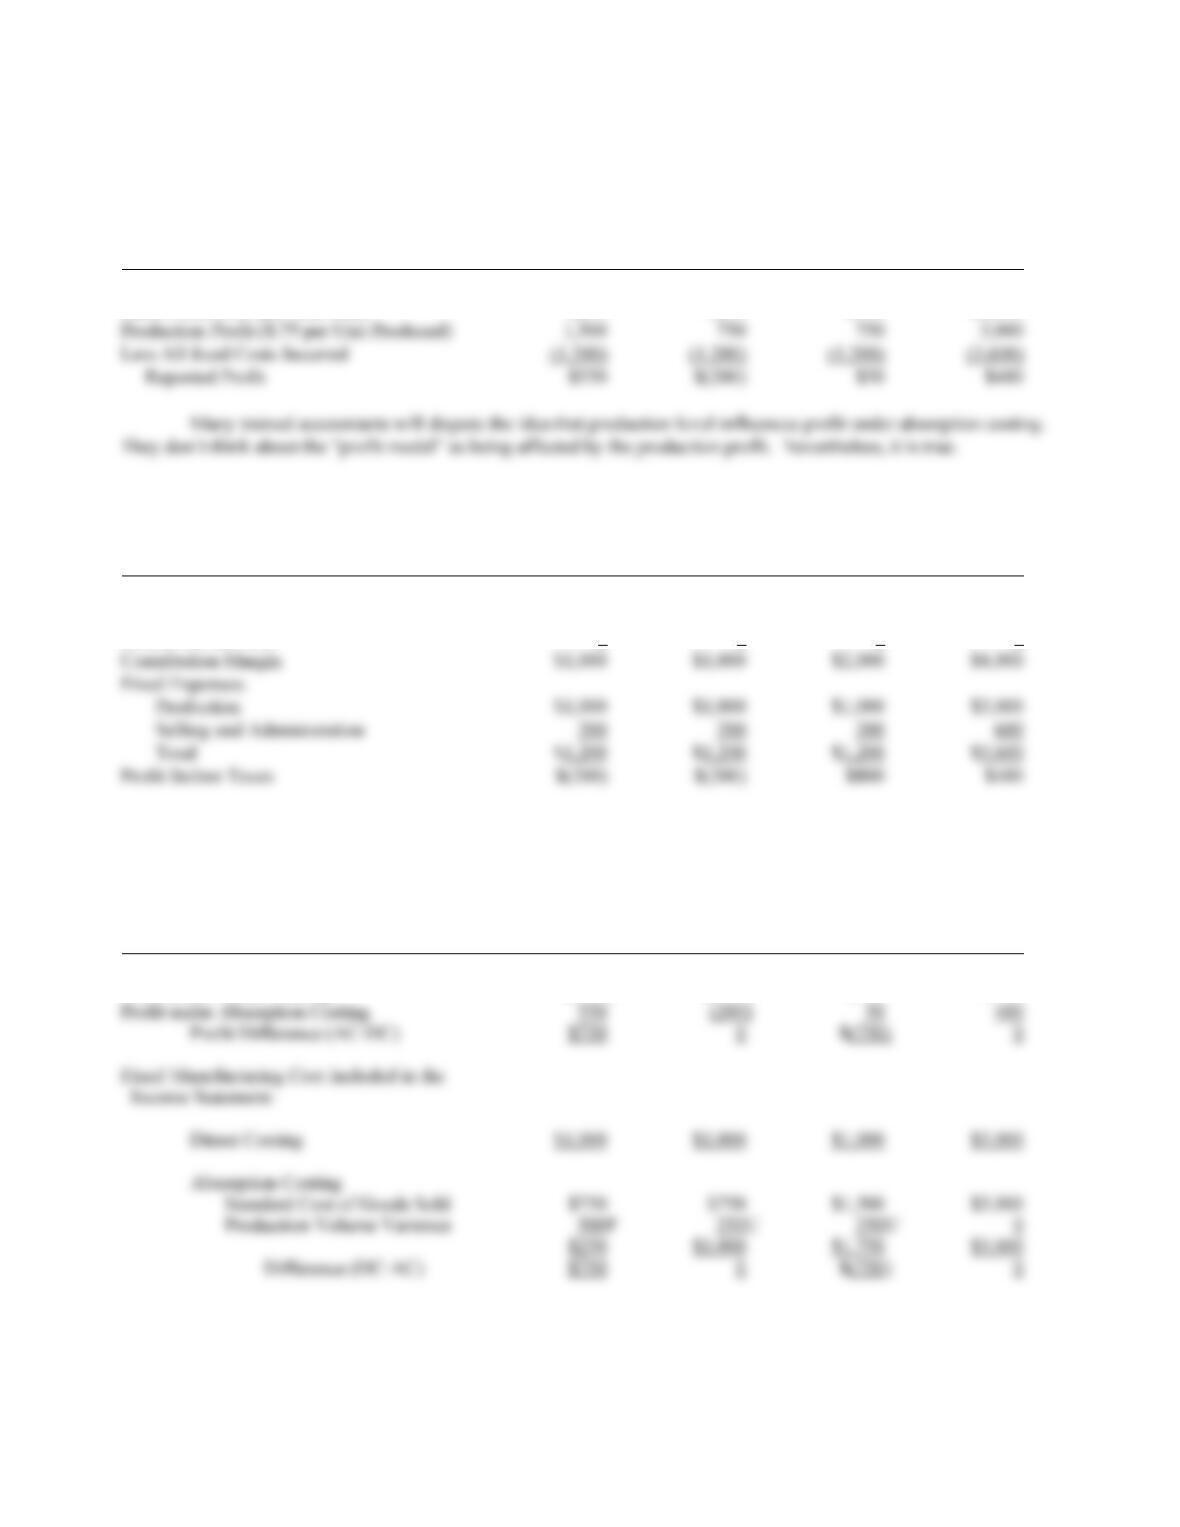
Absorption Costing “Profit Model”
January February March Total
Sales Profit ($.25 per Unit Sold) $250 $250 $500 $1,000
Direct Costing “Profit Model”
January February March Total
Sales $1,000 $1,000 $2,000 $4,000
Cost of Goods Sold* 0 0 0 0
*Since there are no volume dependent production costs in this example, there is no CGS. Profit contribution here equals
100% of sales
January February March Total
Profit under Direct Costing $(200) $(200) $800 $400