Solution
1. A survey indicated that chocolate is the most popular flavor of ice cream in America.
For each of the following, indicate the possible effects on demand, supply, or both as
well as equilibrium price and quantity of chocolate ice cream.
a. A severe drought in the Midwest causes dairy farmers to reduce the number of
milk – producing cattle in their herds by a third. These dairy farmers supply cream
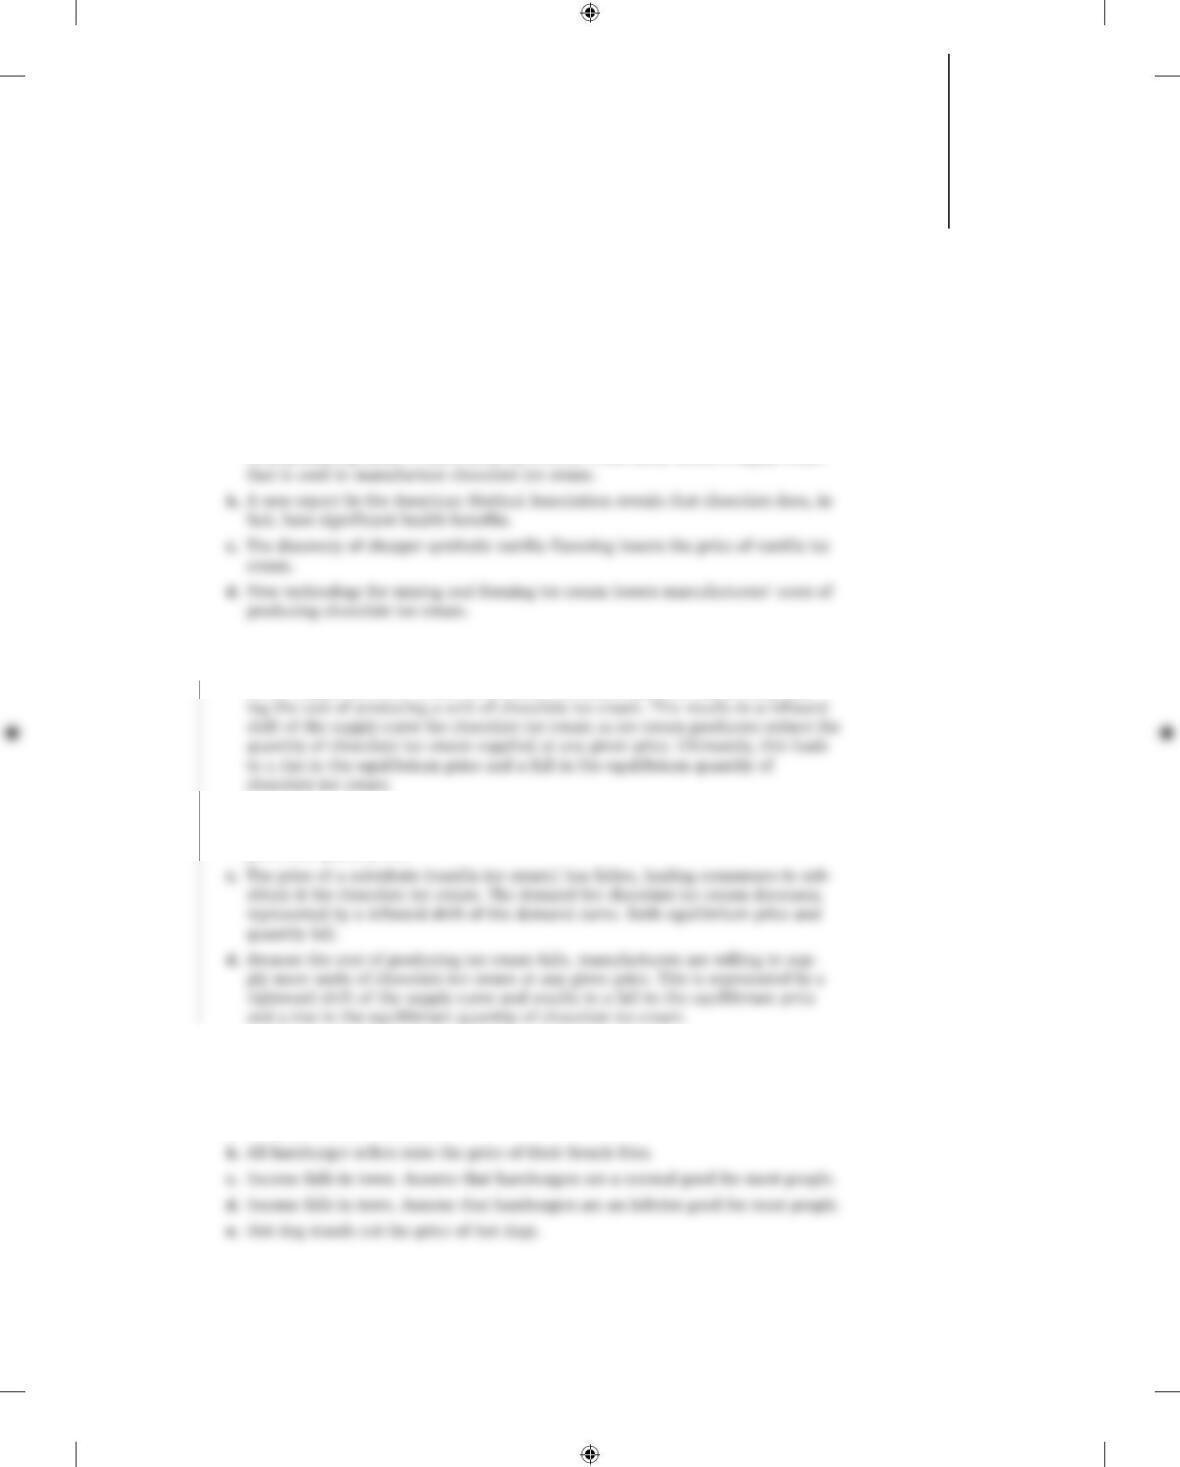
1. a. By reducing their herds, dairy farmers reduce the supply of cream, a leftward shift
of the supply curve for cream. As a result, the market price of cream rises, rais-
b. Consumers will now demand more chocolate ice cream at any given price, rep-
resented by a rightward shift of the demand curve. As a result, both equilibrium
price and quantity rise.
2. In a supply and demand diagram, draw the shift of the demand curve for hamburg-
ers in your hometown due to the following events. In each case, show the effect on
equilibrium price and quantity.
a. The price of tacos increases.
S-33
3
CHAPTER
Supply and Demand
KrugWellsECPS4e_Micro_CH03.indd S-33KrugWellsECPS4e_Micro_CH03.indd S-33 9/23/14 9:35 AM9/23/14 9:35 AM

S-34 CHAPTER 3 SUPPLY AND DEMAND
Solution
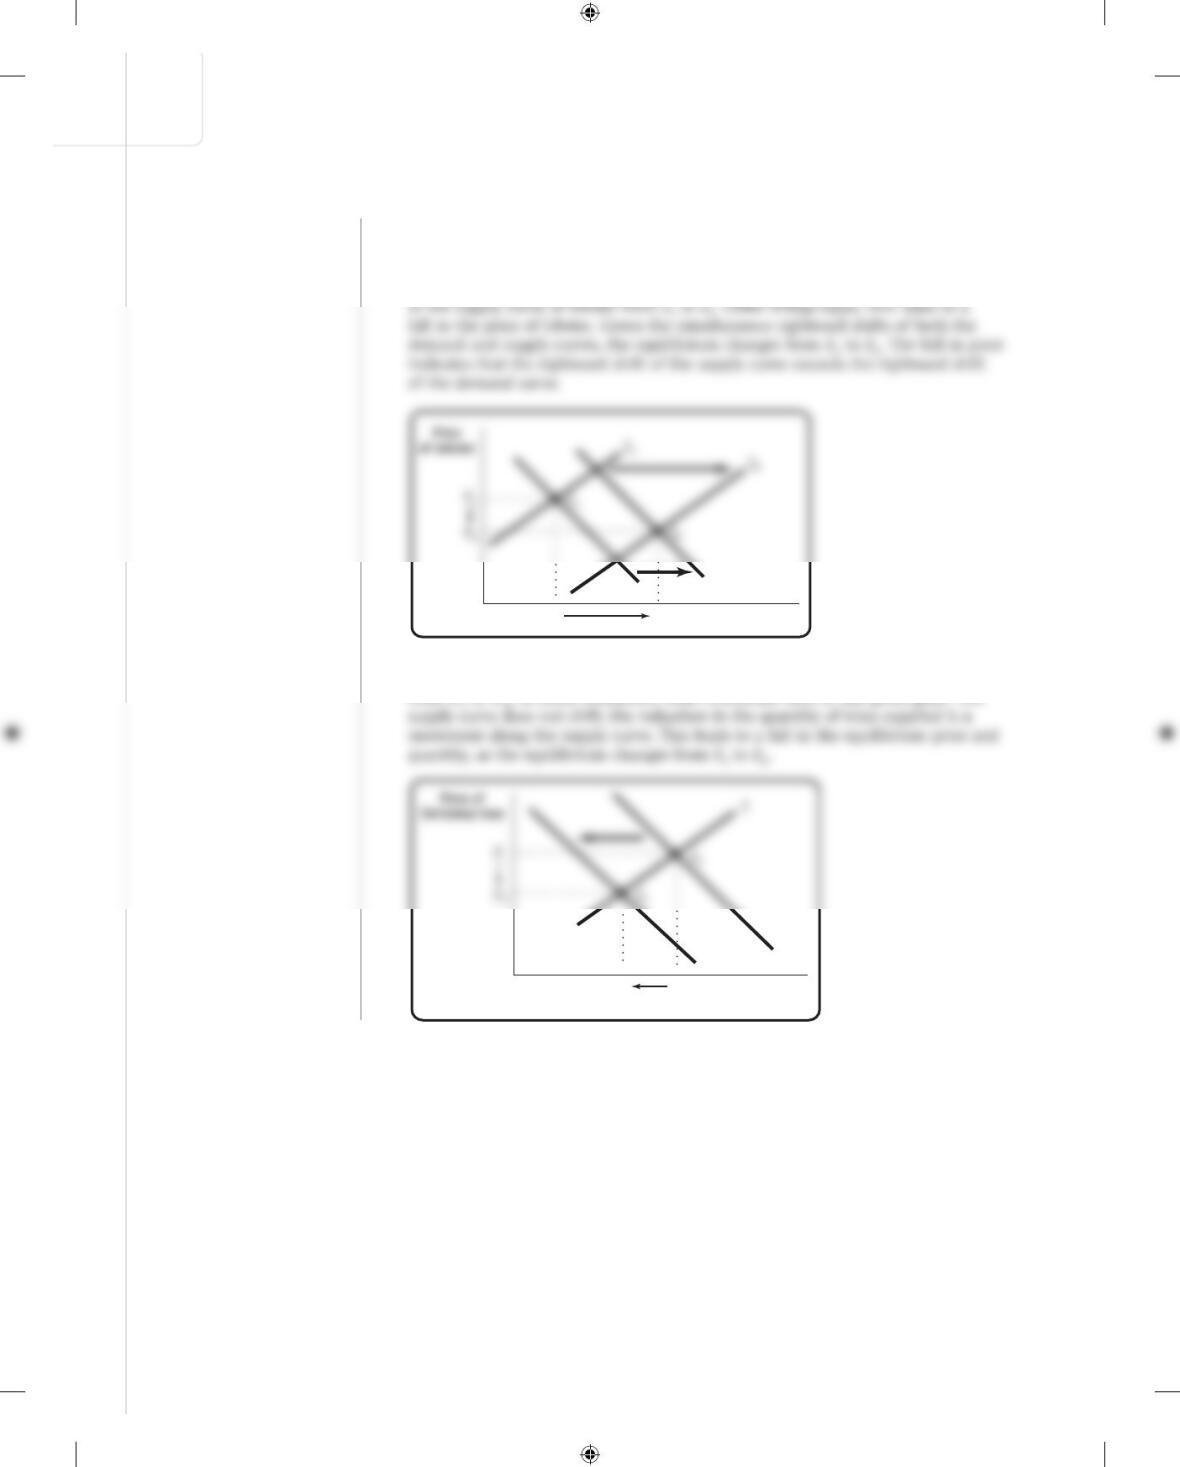
2. a. A rise in the price of a substitute (tacos) causes the demand for hamburgers to
increase. This represents a rightward shift of the demand curve from D1 to D2 and
results in a rise in the equilibrium price and quantity as the equilibrium changes
from E1 to E2.
Price
of hamburger
S
b. A rise in the price of a complement (french fries) causes the demand for ham-
burgers to decrease. This represents a leftward shift of the demand curve from D1
to D2 and results in a fall in the equilibrium price and quantity as the equilibrium
changes from E1 to E2.
Price
of hamburger
S
c. A fall in income causes the demand for a normal good (hamburgers) to decrease.
This represents a leftward shift of the demand curve from D1 to D2 and results in a
fall in the equilibrium price and quantity as the equilibrium changes from E1 to E2.
Price
of hamburger
S
KrugWellsECPS4e_Micro_CH03.indd S-34KrugWellsECPS4e_Micro_CH03.indd S-34 9/23/14 9:35 AM9/23/14 9:35 AM

CHAPTER 3 SUPPLY AND DEMAND S-35
d. A fall in income causes the demand for an inferior good (hamburgers) to increase.
This represents a rightward shift of the demand curve from D1 to D2 and results
in a rise in the equilibrium price and quantity as the equilibrium changes from E1
to E2.
Price
of hamburger
S
e. A fall in the price of a substitute (hot dogs) causes demand for hamburgers to
decrease. This is represented by a leftward shift of the demand curve from D1 to
D2 and results in a fall in the equilibrium price and quantity as the equilibrium
changes from E1 to E2.
3. The market for many goods changes in predictable ways according to the time of
year, in response to events such as holidays, vacation times, seasonal changes in pro-
duction, and so on. Using supply and demand, explain the change in price in each of
the following cases. Note that supply and demand may shift simultaneously.
a. Lobster prices usually fall during the summer peak lobster harvest season, despite
the fact that people like to eat lobster during the summer more than at any other
KrugWellsECPS4e_Micro_CH03.indd S-35KrugWellsECPS4e_Micro_CH03.indd S-35 9/23/14 9:35 AM9/23/14 9:35 AM
S-36 CHAPTER 3 SUPPLY AND DEMAND
Solution
3. a. There is a rightward shift of the demand curve from D1 to D2 during the summer
because consumers prefer to eat more lobster during the summer than at other
times of the year. Other things equal, this leads to a rise in the price of lobster.
Simultaneously, lobster fishermen produce more lobster during the summer peak
harvest time, when it is cheaper to harvest lobster, representing a rightward shift
Q1
D1
D2
Q2
Quantity of lobster
b. There is a leftward shift of the demand curve for Christmas trees after Christmas
from D1 to D2, as fewer consumers want Christmas trees at any given price. The
Q1
D2
Q2
Quantity of Christmas trees
D1
KrugWellsECPS4e_Micro_CH03.indd S-36KrugWellsECPS4e_Micro_CH03.indd S-36 9/23/14 9:35 AM9/23/14 9:35 AM
CHAPTER 3 SUPPLY AND DEMAND S-37
c. There is a leftward shift of the demand curve for tickets to Paris in September,
after the end of school vacation, from D1 to D2. Other things equal, this leads
to a fall in the price of tickets. At the same time, as the cost of operating flights
Q1
P2
P1
E2
D2
Q2Quantity of tickets
E1
D1
4. Show in a diagram the effect on the demand curve, the supply curve, the equilibrium
price, and the equilibrium quantity of each of the following events.
a. The market for newspapers in your town
Case 1: The salaries of journalists go up.
KrugWellsECPS4e_Micro_CH03.indd S-37KrugWellsECPS4e_Micro_CH03.indd S-37 9/23/14 9:35 AM9/23/14 9:35 AM

S-38 CHAPTER 3 SUPPLY AND DEMAND
Solution
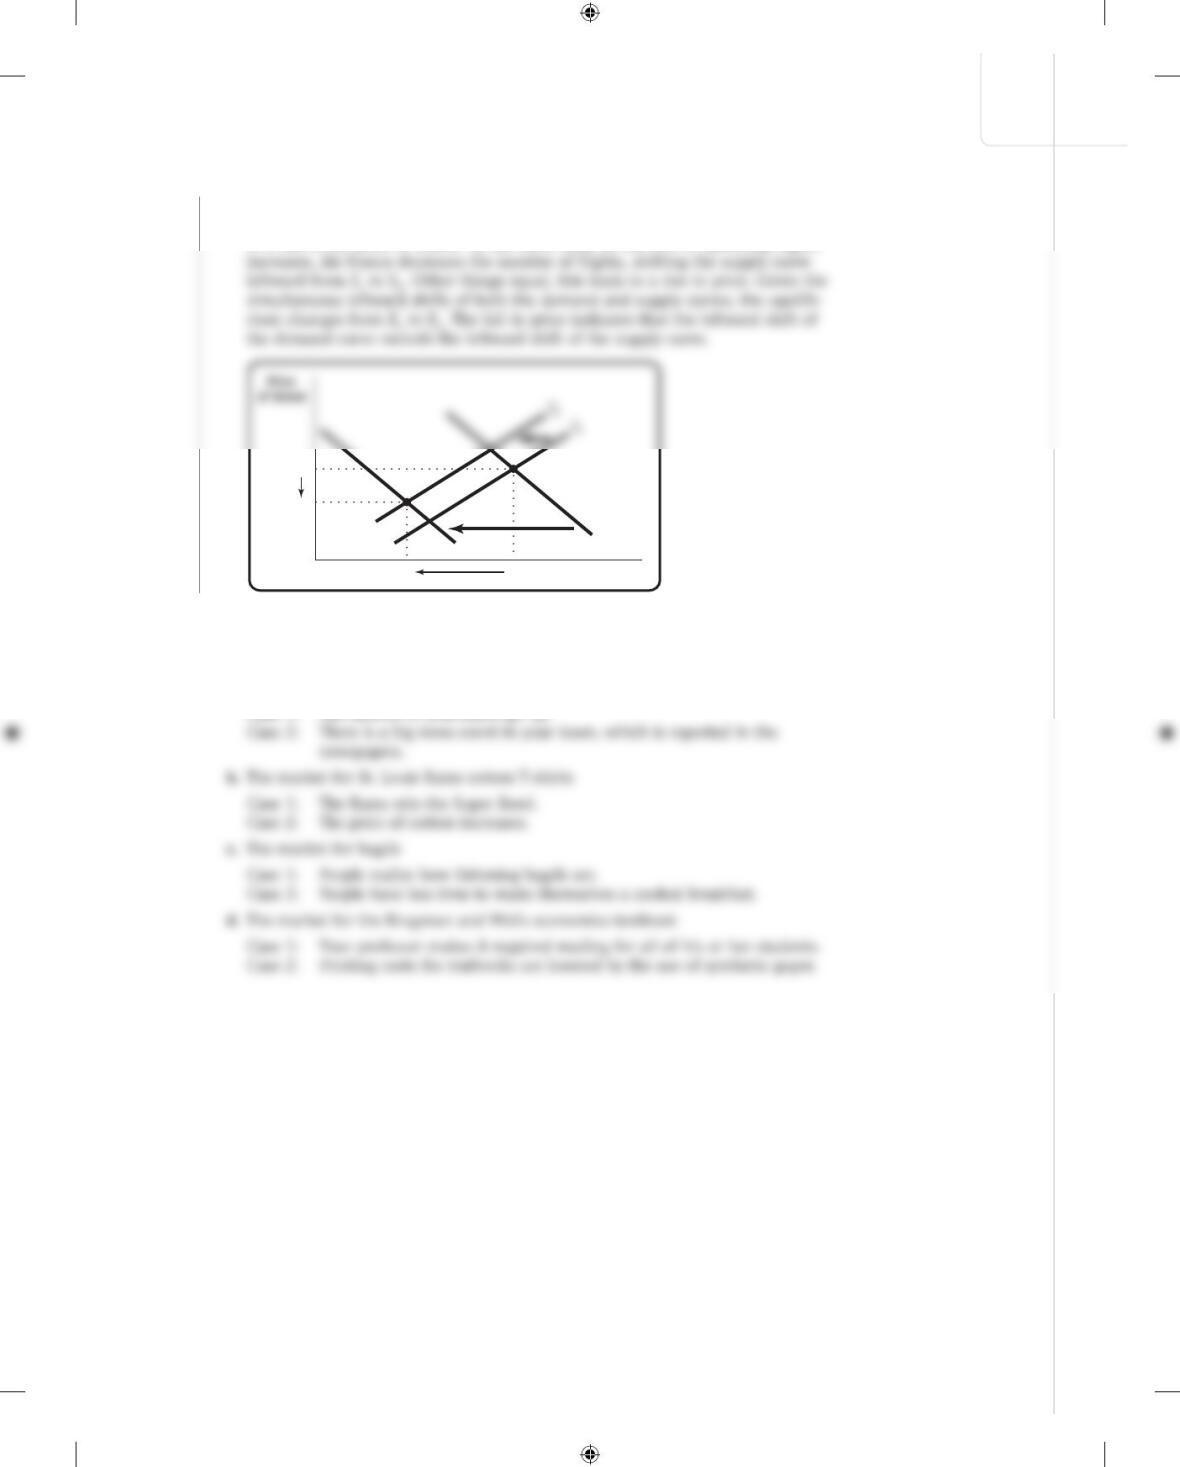
4. a. Case 1: Journalists are an input in the production of newspapers; an increase in
their salaries will cause newspaper publishers to reduce the quantity supplied at
any given price. This represents a leftward shift of the supply curve from S1 to S2
and results in a rise in the equilibrium price and a fall in the equilibrium quantity
as the equilibrium changes from E1 to E2.
P2
S1
E2
S2
Price of
newspaper
Case 2: Townspeople will wish to purchase more newspapers at any given price.
Q1
D1
D2
Q2Quantity of newspapers
b. Case 1: Fans will demand more St. Louis Rams memorabilia at any given price.
Q1
P1
E1
D1
Q2Quantity of T-shirts
D2
KrugWellsECPS4e_Micro_CH03.indd S-38KrugWellsECPS4e_Micro_CH03.indd S-38 9/23/14 9:35 AM9/23/14 9:35 AM

Case 2: Cotton is an input into T-shirts; an increase in its price will cause T-shirt
manufacturers to reduce the quantity supplied at any given price, representing a
leftward shift of the supply curve from S1 to S2. This leads to a rise in the equilib-
rium price and a fall in the equilibrium quantity as the equilibrium changes from
E1 to E2.
P2
S1
E2
S2
Price of
T-shirt
c. Case 1: Consumers will demand fewer bagels at any given price. This represents a
leftward shift of the demand curve from D1 to D2 and leads to a fall in both the
equilibrium price and quantity as the equilibrium changes from E1 to E2.
S
Price
of bagel
Case 2: Consumers will demand more bagels (a substitute for cooked breakfasts)
at any given price. This represents a rightward shift of the demand curve from D1
to D2 and leads to a rise in both the equilibrium price and quantity as the equilib-
rium changes from E1 to E2.
S
Price
of bagel
KrugWellsECPS4e_Micro_CH03.indd S-39KrugWellsECPS4e_Micro_CH03.indd S-39 9/23/14 9:35 AM9/23/14 9:35 AM
S-40 CHAPTER 3 SUPPLY AND DEMAND
d. Case 1: A greater quantity of textbooks will be demanded at any given price, rep-
resenting a rightward shift of the demand curve from D1 to D2. Equilibrium price
and quantity will rise as the equilibrium changes from E1 to E2.
S
Price of
textbook
Case 2: The textbook publisher will offer more textbooks for sale at any given
price, representing a rightward shift of the supply curve from S1 to S2. Equilibrium
price will fall and equilibrium quantity will rise as the equilibrium changes from
E1 to E2.
S1
S2
Price of
textbook
5. Let’s assume that each person in the United States consumes an average of 37 gal-
lons of soft drinks (nondiet) at an average price of $2 per gallon and that the U.S.
KrugWellsECPS4e_Micro_CH03.indd S-40KrugWellsECPS4e_Micro_CH03.indd S-40 9/23/14 9:35 AM9/23/14 9:35 AM
CHAPTER 3 SUPPLY AND DEMAND S-41
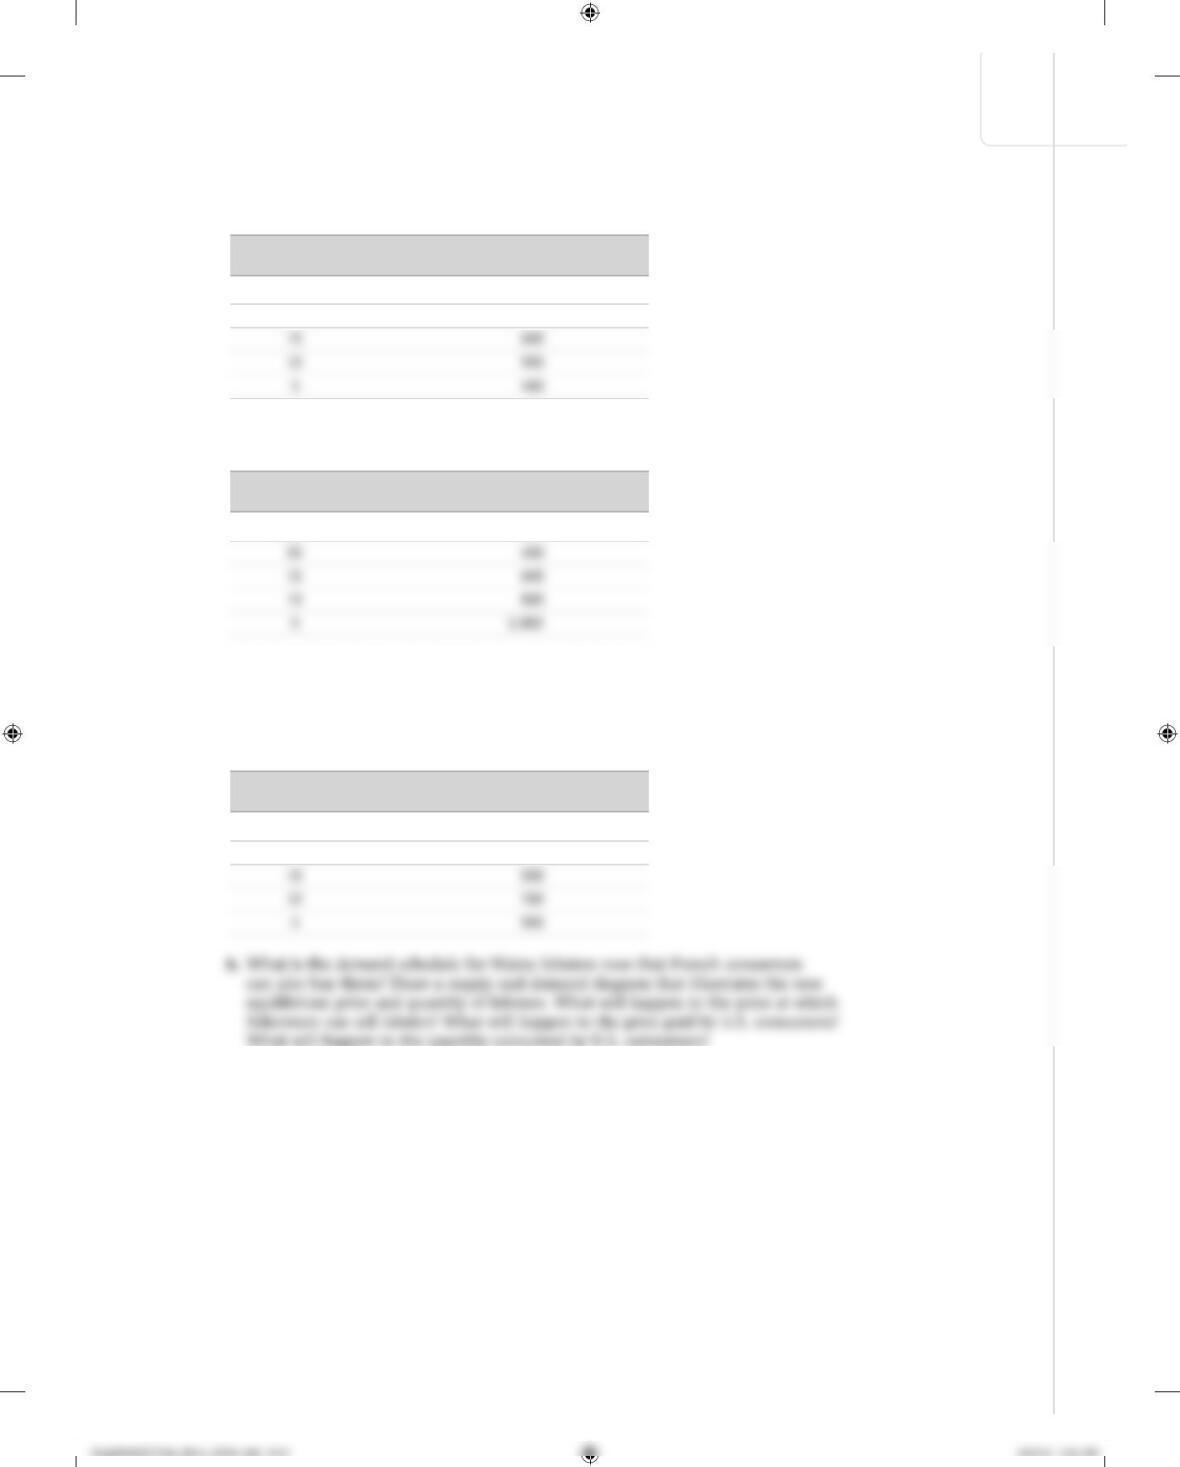
6. Suppose that the supply schedule of Maine lobsters is as follows:
Suppose that Maine lobsters can be sold only in the United States. The U.S. demand
schedule for Maine lobsters is as follows:
a. Draw the demand curve and the supply curve for Maine lobsters. What are the
equilibrium price and quantity of lobsters?
Now suppose that Maine lobsters can be sold in France. The French demand sched-
ule for Maine lobsters is as follows:
What will happen to the quantity consumed by U.S. consumers?
Price of lobster Quantity of lobster demanded
(per pound) (pounds)
$25 100
$20 300
Price of lobster Quantity of lobster demanded
(per pound) (pounds)
$25 200
Price of lobster Quantity of lobster supplied
(per pound) (pounds)
$25 800
$20 700
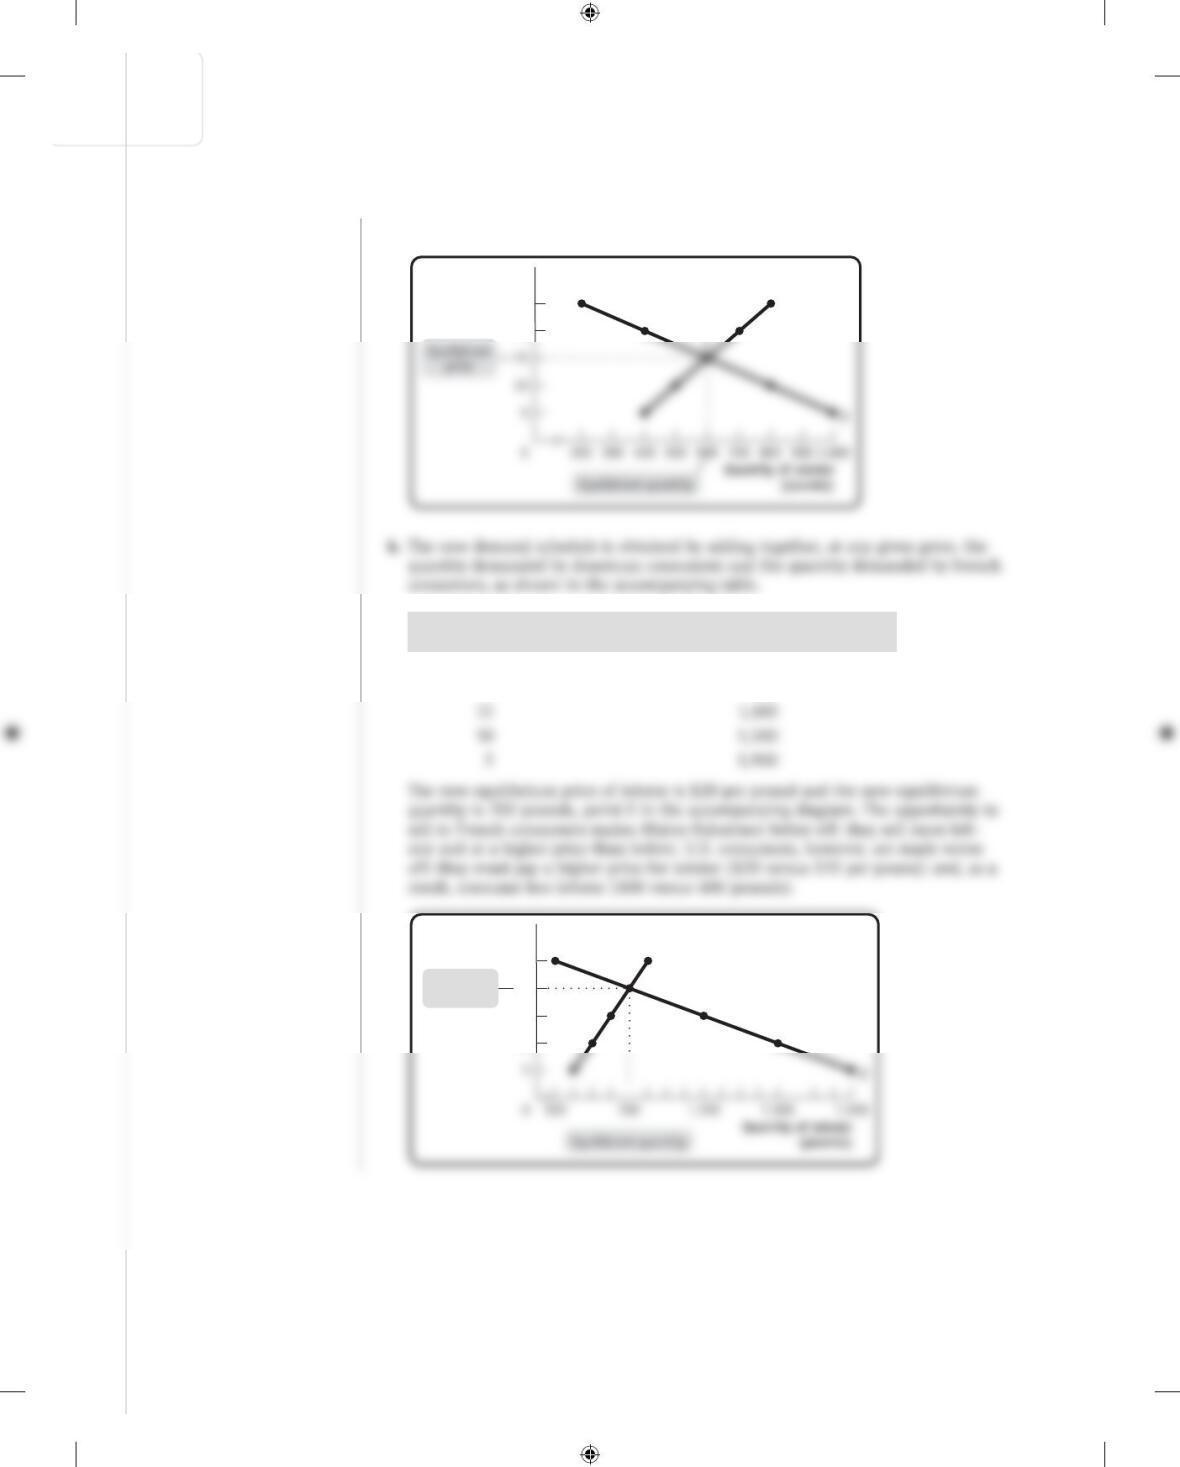
S-42 CHAPTER 3 SUPPLY AND DEMAND
Solution
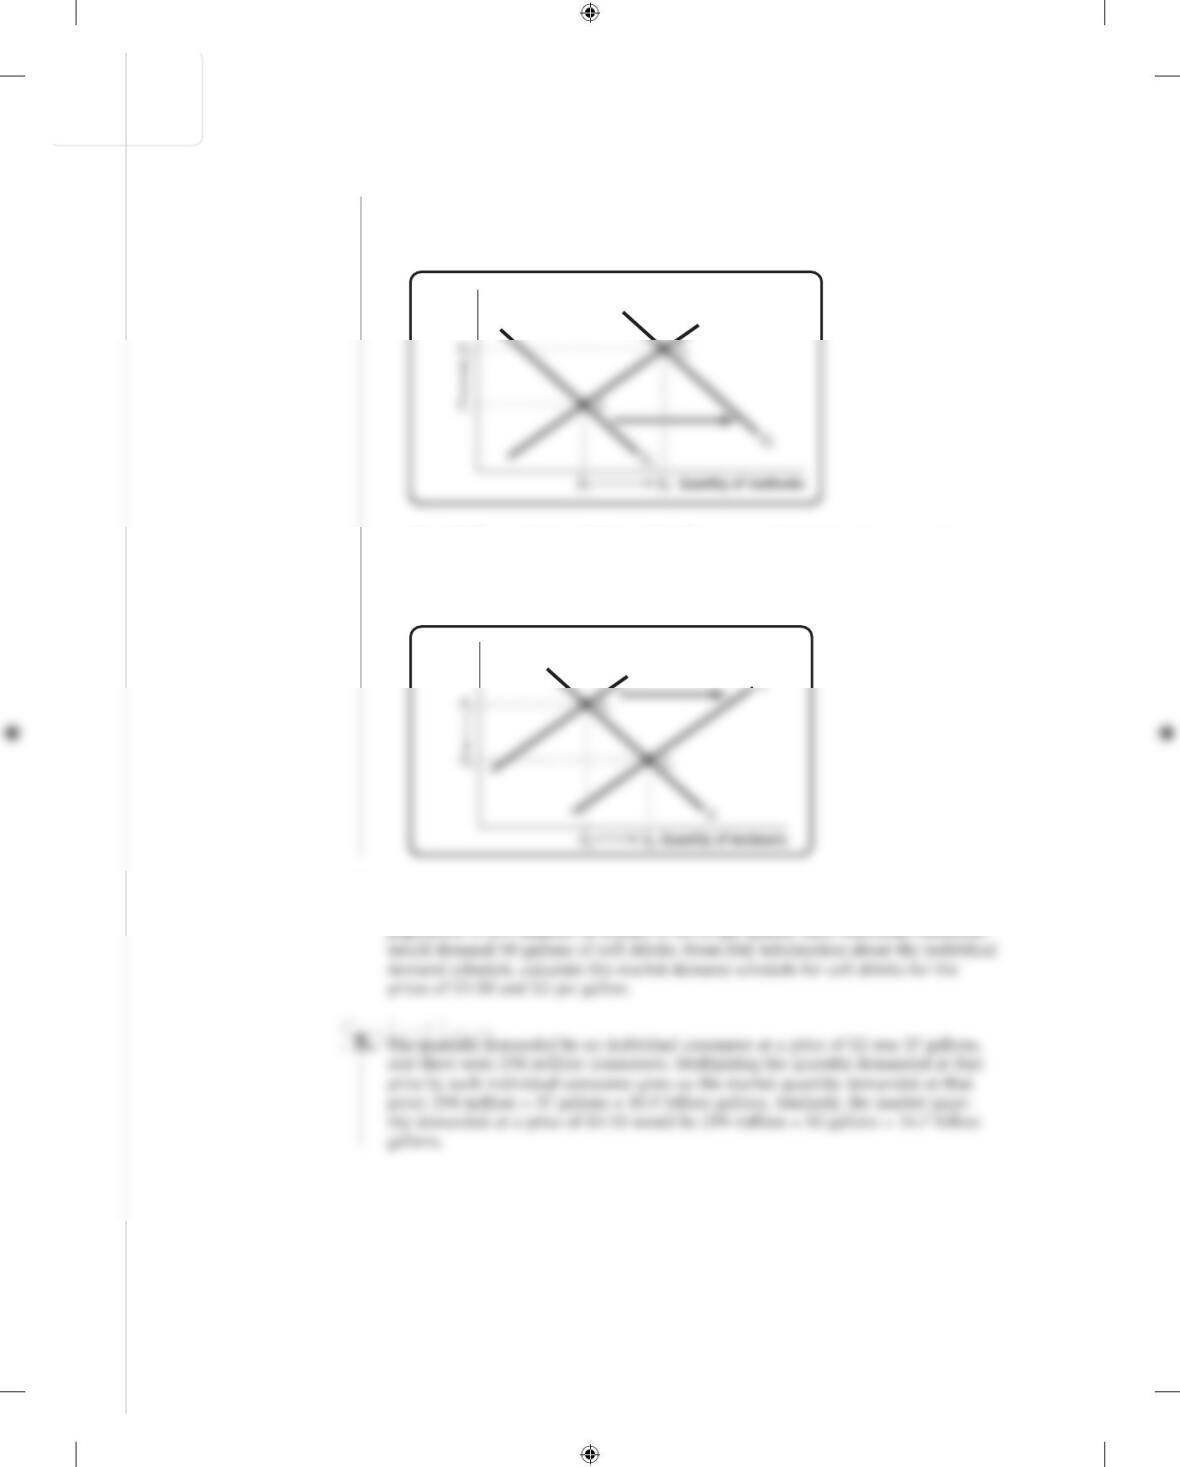
6. a. The equilibrium price of lobster is $15 per pound and the equilibrium quantity is
600 pounds, point E in the accompanying diagram.
S
$25
20
Price of lobster
(per pound)
Price of lobster Quantity of lobster demanded
(per pound) (U.S. pounds plus French pounds)
$25 300
20 700
S
E
$25
20
15
10
Price of lobster
(per pound)
Equilibrium
price
KrugWellsECPS4e_Micro_CH03.indd S-42KrugWellsECPS4e_Micro_CH03.indd S-42 9/23/14 9:35 AM9/23/14 9:35 AM
CHAPTER 3 SUPPLY AND DEMAND S-43
Solution
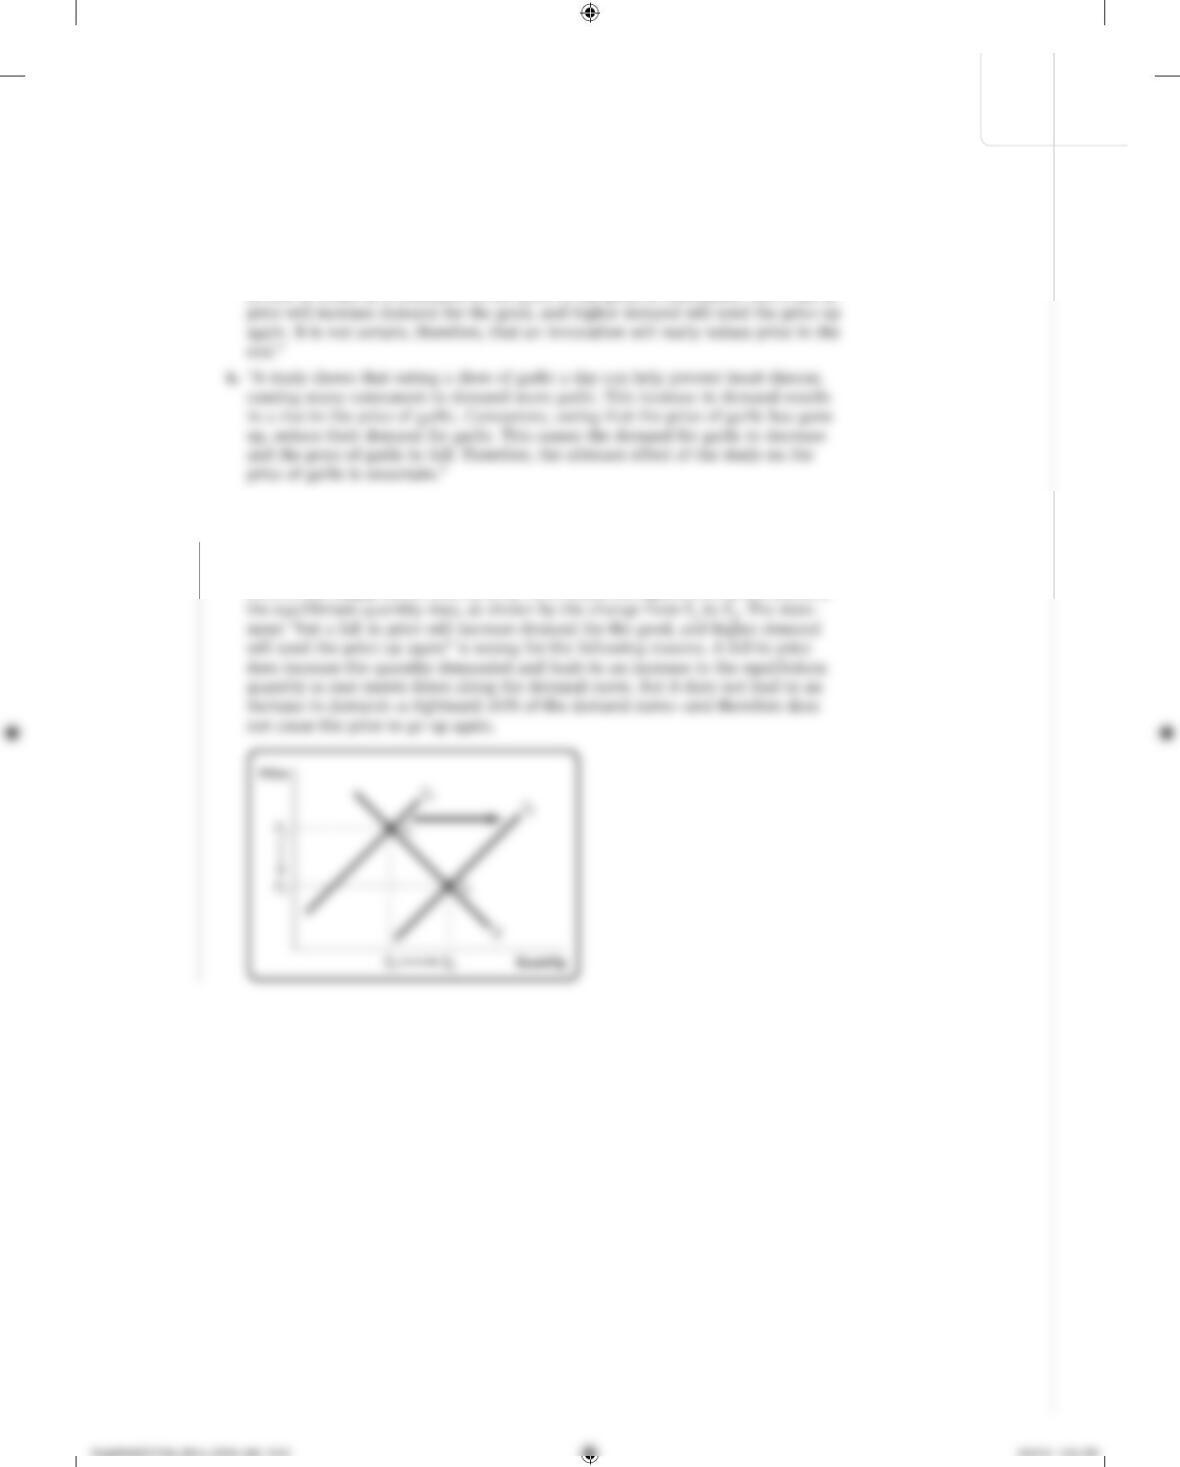
7. Find the flaws in reasoning in the following statements, paying particular attention
to the distinction between shifts of and movements along the supply and demand
curves. Draw a diagram to illustrate what actually happens in each situation.
a. “A technological innovation that lowers the cost of producing a good might seem
at first to result in a reduction in the price of the good to consumers. But a fall in
7. a. This statement confuses a shift of a curve with a movement along a curve. A
technological innovation lowers the cost of producing the good, leading produc-
ers to offer more of the good at any given price. This is represented by a rightward
shift of the supply curve from S1 to S2. As a result, the equilibrium price falls and
S-44 CHAPTER 3 SUPPLY AND DEMAND
Solution
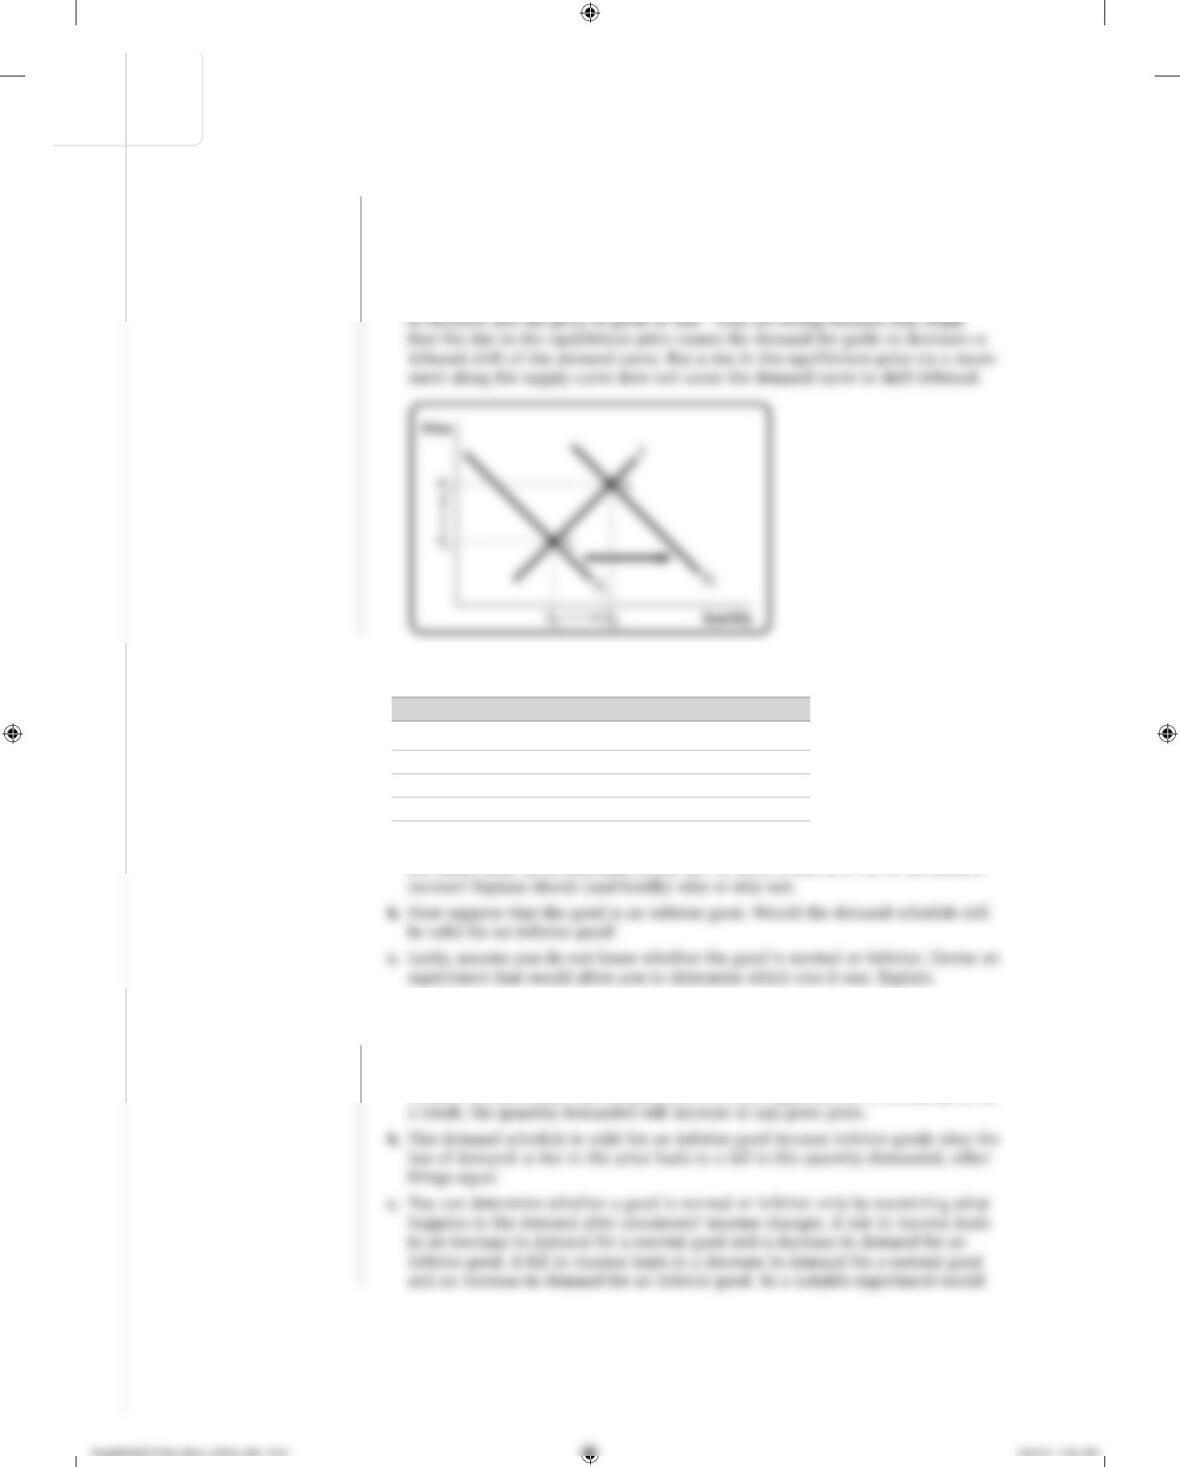
b. This statement also confuses a shift of a curve with a movement along a curve.
The health report generates an increase in demand—a rightward shift of the
demand curve from D1 to D2. This leads to a higher equilibrium price and quan-
tity as we move up along the supply curve, and the equilibrium changes from E1 to
E2. The following statements are wrong: “Consumers, seeing that the price of gar-
lic has gone up, reduce their demand for garlic. This causes the demand for garlic
8. The following table shows a demand schedule for a normal good.
a. Do you think that the increase in quantity demanded (say, from 90 to 110 in
the table) when price decreases (from $21 to $19) is due to a rise in consumers’
8. a. The increase in quantity demanded from 90 to 110 when the price declines from
$21 to $19 is not due to a rise in consumers’ income. Rather, it represents a
movement along the demand curve as the price falls. In contrast, a rise in con-
sumers’ income causes the demand curve to shift rightward for a normal good; as
Price Quantity demanded
$23 70
$21 90
$19 110
$17 130
CHAPTER 3 SUPPLY AND DEMAND S-45
Solution
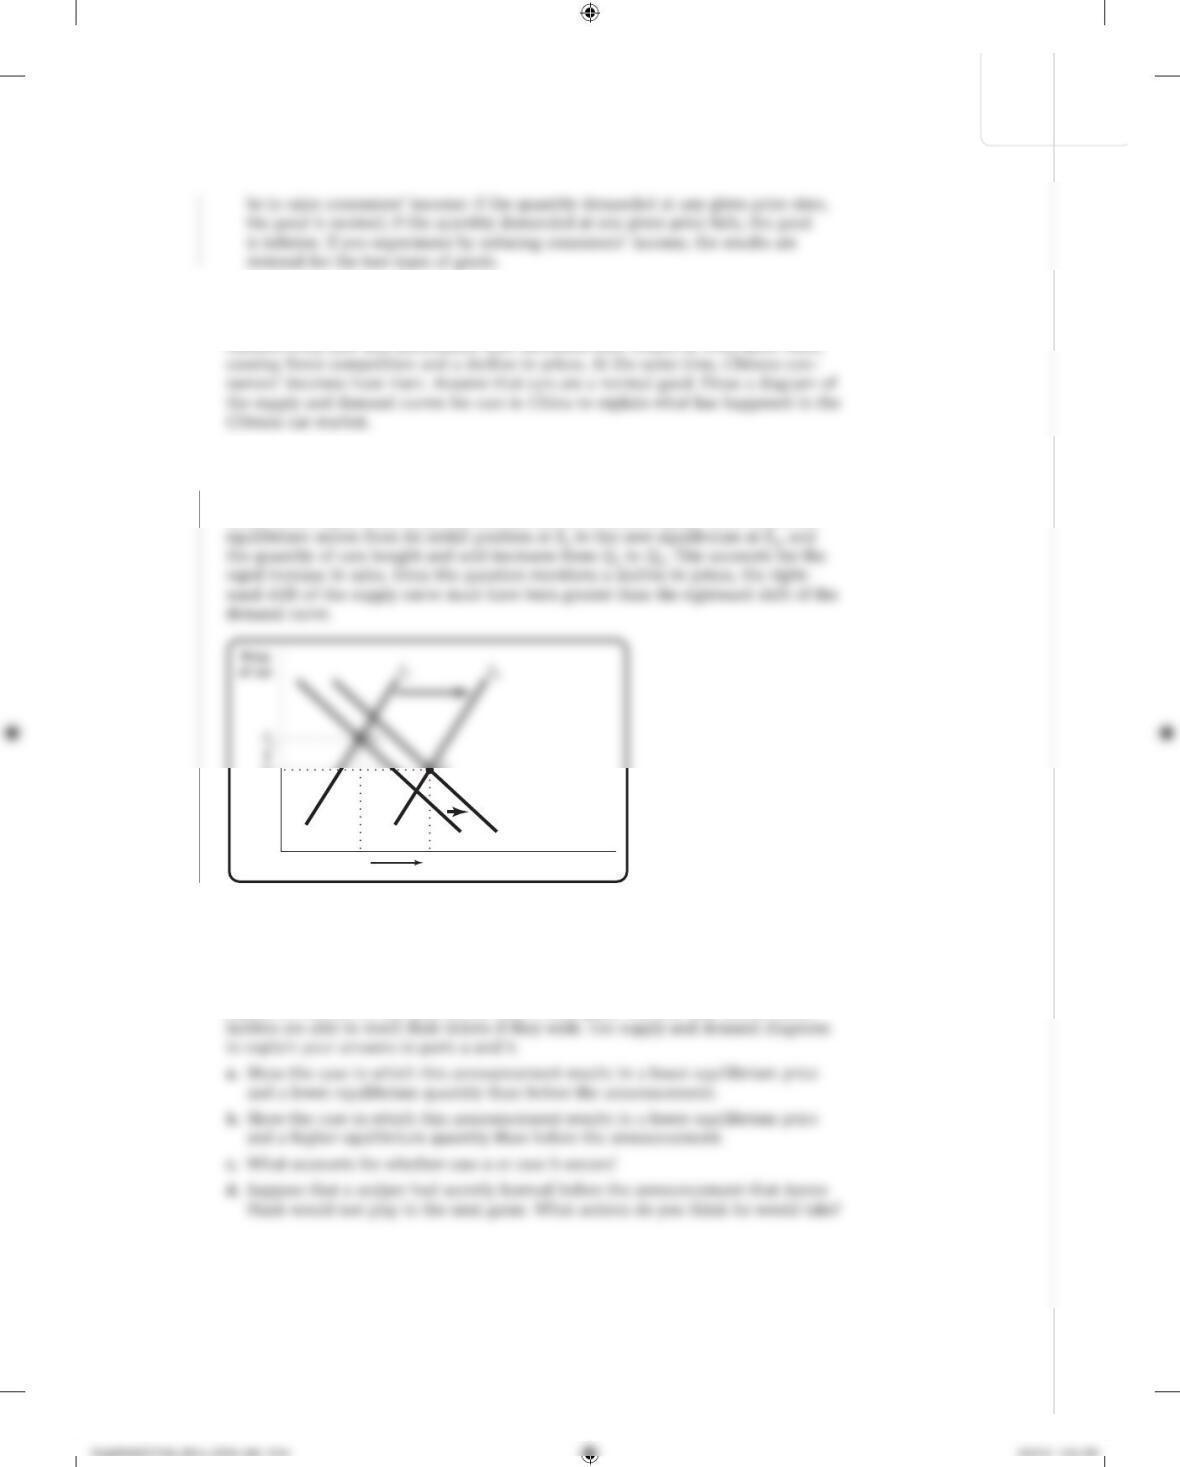
9. In recent years, the number of car producers in China has increased rapidly. In fact,
China now has more car brands than the United States. In addition, car sales have
climbed every year and automakers have increased their output at even faster rates,
9. As more automakers enter the Chinese market, the supply curve shifts to the right,
from S1 to S2. And as Chinese consumers’ incomes rise, the demand curve for cars
shifts to the right, from D1 to D2, because cars are a normal good. As a result, the
Q1
E2
P2
Q2
D2
D1
Quantity of cars
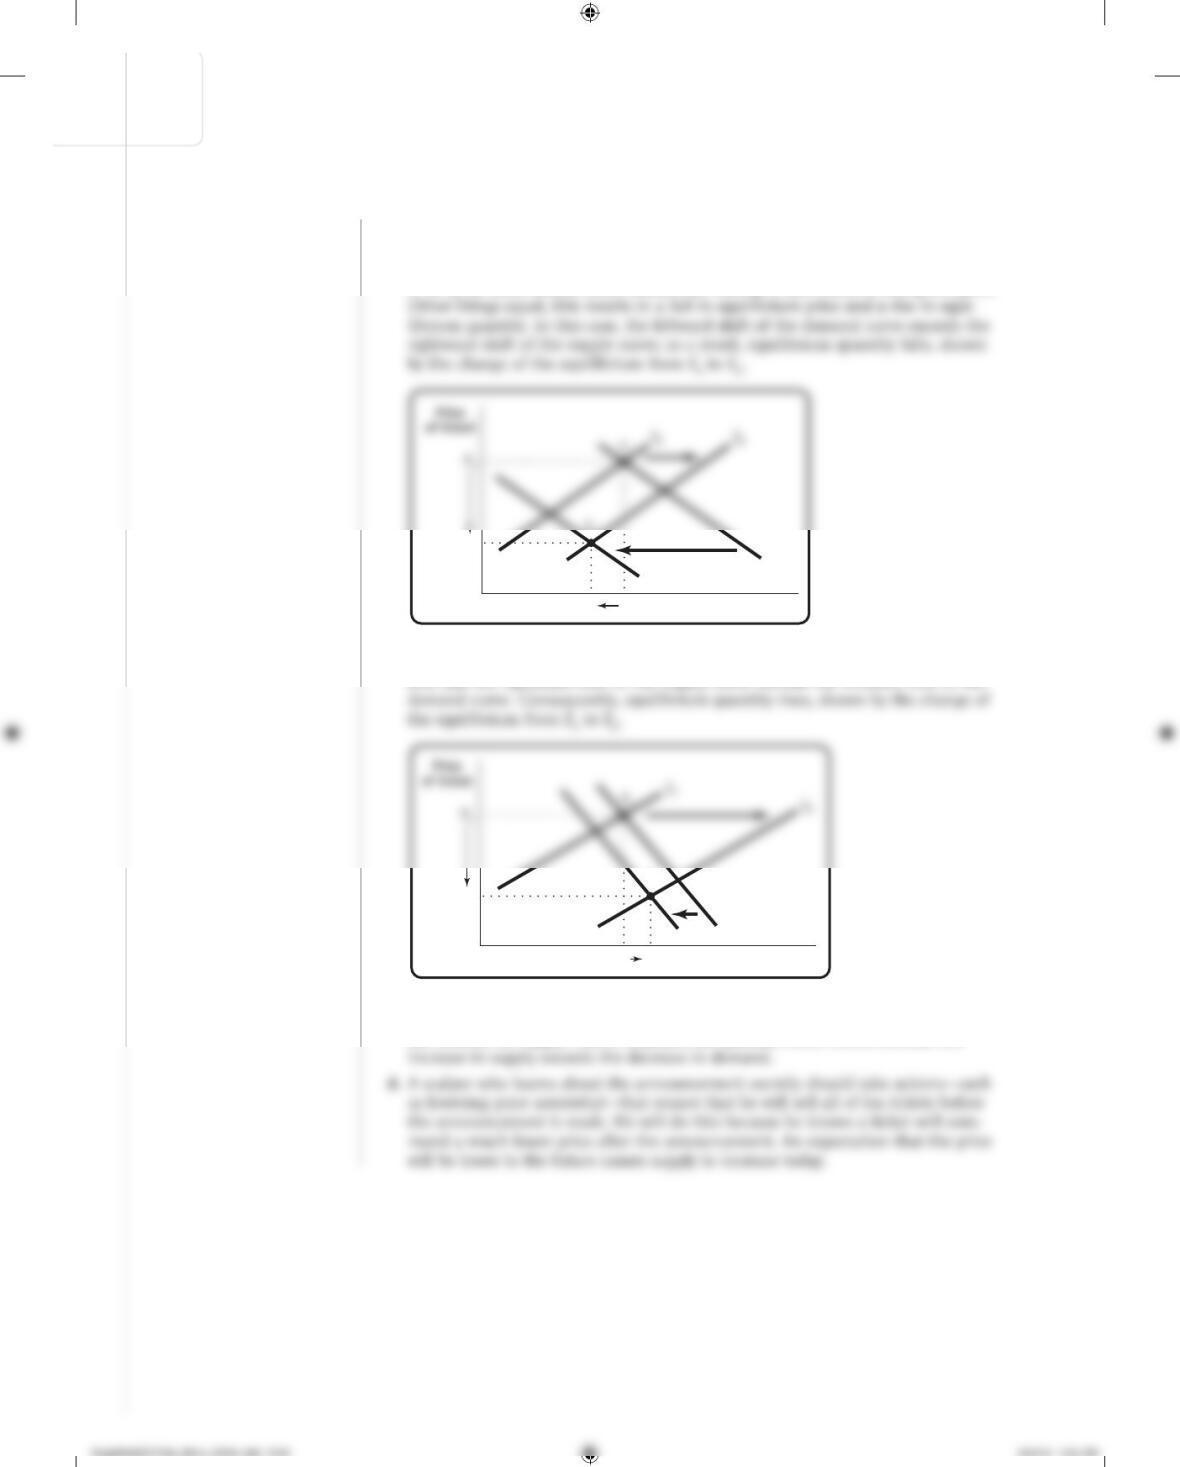
10. Aaron Hank is a star hitter for the Bay City baseball team. He is close to breaking the
major league record for home runs hit during one season, and it is widely anticipated
that in the next game he will break that record. As a result, tickets for the team’s
next game have been a hot commodity. But today it is announced that, due to a knee
injury, he will not in fact play in the team’s next game. Assume that season ticket –
S-46 CHAPTER 3 SUPPLY AND DEMAND
Solution
10. a. Fewer fans want to attend the next game after the announcement is made. As a
result, the demand curve will shift leftward from D1 to D2, as fewer tickets are
demanded at any given price; other things equal, this results in a fall in both equi-
librium price and quantity. In addition, the supply curve will shift rightward from
S1 to S2, as more season ticket – holders are willing to sell tickets at any given price.
Q1
P2
D2
Q2Quantity of tickets
D1
b. The supply and demand curves shift in the same manner as in part a, but in
Q2
P2
D2
D1
Q1Quantity of tickets
E2
c. Case a (equilibrium quantity falls) occurs because the decrease in demand exceeds
the increase in supply. Case b (equilibrium quantity rises) occurs because the