Chapter 3
GRAPHING LINEAR EQUATIONS AND
INEQUALITIES IN TWO VARIABLES
3.1 Introduction to Graphing
Exercises
2. The horizontal number line on a coordinate
plane is usually referred to as the x-axis.
8.
12. III
14. II
16. IV
18. I
20.
22. IV
24. III
26.
Chapter 3 Graphing Linear Equations and Inequalities in Two Variables
46
30. a.
32. The graph shows that, although the value of the
stock changed (increased or decreased) on a
daily basis, the overall value of a share of a
technology stock increased over the course of
the year.
Mindstretchers
1. a.
Both use a letter and number coordinate to
2. Answers may vary. Some possible answers are
given.
(
)
(
)
(
)
(
)
2, 2 2, 1 2, 0 2,1
−− →−−→− →−
3. Possible answer: The third point is the midpoint
of the line segment connecting the first two
points.
3.2 Slope
Exercises
only if the product of their slopes is 1−.
10.
()
54 11
011
m−
===
−−
Section 3.2 Slope
47
16. 00 0 0
53 2
m−
===
−
18. 4.5 2.5 2
41 3
m−
==
−
20.
A
D
HJJG
:
()
()
42 66
21 1
m−−
===−
−−− −
A
30.
32.
The lines are perpendicular.
b. PQ
H
JJG
: 40 4 1
08 8 2
m−
===−
−−
Chapter 3 Graphing Linear Equations and Inequalities in Two Variables
48
40. Negative slope; neither
42.
A
D
HJJG
:
()
2131
33 6 2
m−−
===−
−− −
A
is
1
6.
44.
()
()
15
42
2463
m−−−
===
−−
A
46.
(
)
1.5 4.5 6 3
242
m−− −
===−
−−−
A
H
H
48. a. The slope is negative.
b.
A negative slope indicates that the value of
52. Brother: 83 51 32 8
73 4
m−
===
−
Sister: 63 29 34 17
m−
===
54. a.
c. BC
H
JJG
:
()
144 64 80 80
32 1
m−−− −
===−
−
The slopes of the two lines are not equal;
therefore the rate of fall was not constant
()
336
−−
Triangle ABC is not a right triangle, since no
two sides are perpendicular.
Section 3.3 Linear Equations and Their Graphs
49
Mindstretchers
1. a.
The slope of
A
B
HJJG
increases.
b.
The slope of
A
B
HJJG
decreases.
3.3 Linear Equations and
Their Graphs
Exercises
2. The graph of a linear equation in two variables
consists of all points whose coordinates satisfy
the equation.
8.
(
)
25
20 5 5
yx
y
=−
=−=−
10. 10
1
10 2
5
yx
y
=−
⎛⎞
⎟
⎜
=− =−
⎟
⎜⎟
⎜
⎝⎠
10. (continued)
610
3
5
x
x
−=−
=
()
110
x
−=−
20 8
12
y
y
+=
=−
(
)
40 8
8
y
y
+=
=
(
)
408
48
2
x
x
x
+=
=
=
14. 32
2
yx=− +
()
2
32
5
y
y
y
=− − +
=+
=
Chapter 3 Graphing Linear Equations and Inequalities in Two Variables
50
14. (continued)
16.
18.
20.
22.
24.
Section 3.3 Linear Equations and Their Graphs
51
32. 45 20xy+=
(
)
40 5 20
520
4
y
y
y
+=
=
=
34.
()
72 7
70 2 7
27
7
2
xy
y
y
y
−=−
−=−
−=−
=
36. 4510yx−=
()
45010
410
10
y
y
y
−=
=
=
38. 48 4yx+=−
(
)
480 4
y
+=−
Chapter 3 Graphing Linear Equations and Inequalities in Two Variables
52
40. 55
4
yx=−
42.
46.
50.
Section 3.3 Linear Equations and Their Graphs
53
54. 34 6xy−=
(
)
30 4 6
46
3
2
y
y
y
−=
−=
=−
56. 24xy−=
(
)
(
)
20 4
4
40,4
y
y
y
−=
−=
=− −
()
()
204
24
22,0
x
x
x
−=
=
=
58. 33
2
yx=−
()
(
)
303
2
30,3
y
y
=−
=− −
60. 3
4
yx=
Chapter 3 Graphing Linear Equations and Inequalities in Two Variables
54
60. (continued)
62.
64.
66. a. 212sp=− +
()
2 1 12 10
s
=− + =
b.
c. Since both quantities in this situation (price
and number of items sold) are nonnegative,
only points whose coordinates are both
nonnegative need to be considered. The
points on the graph that have positive or
zero coordinates lie in the first quadrant.
d. $4
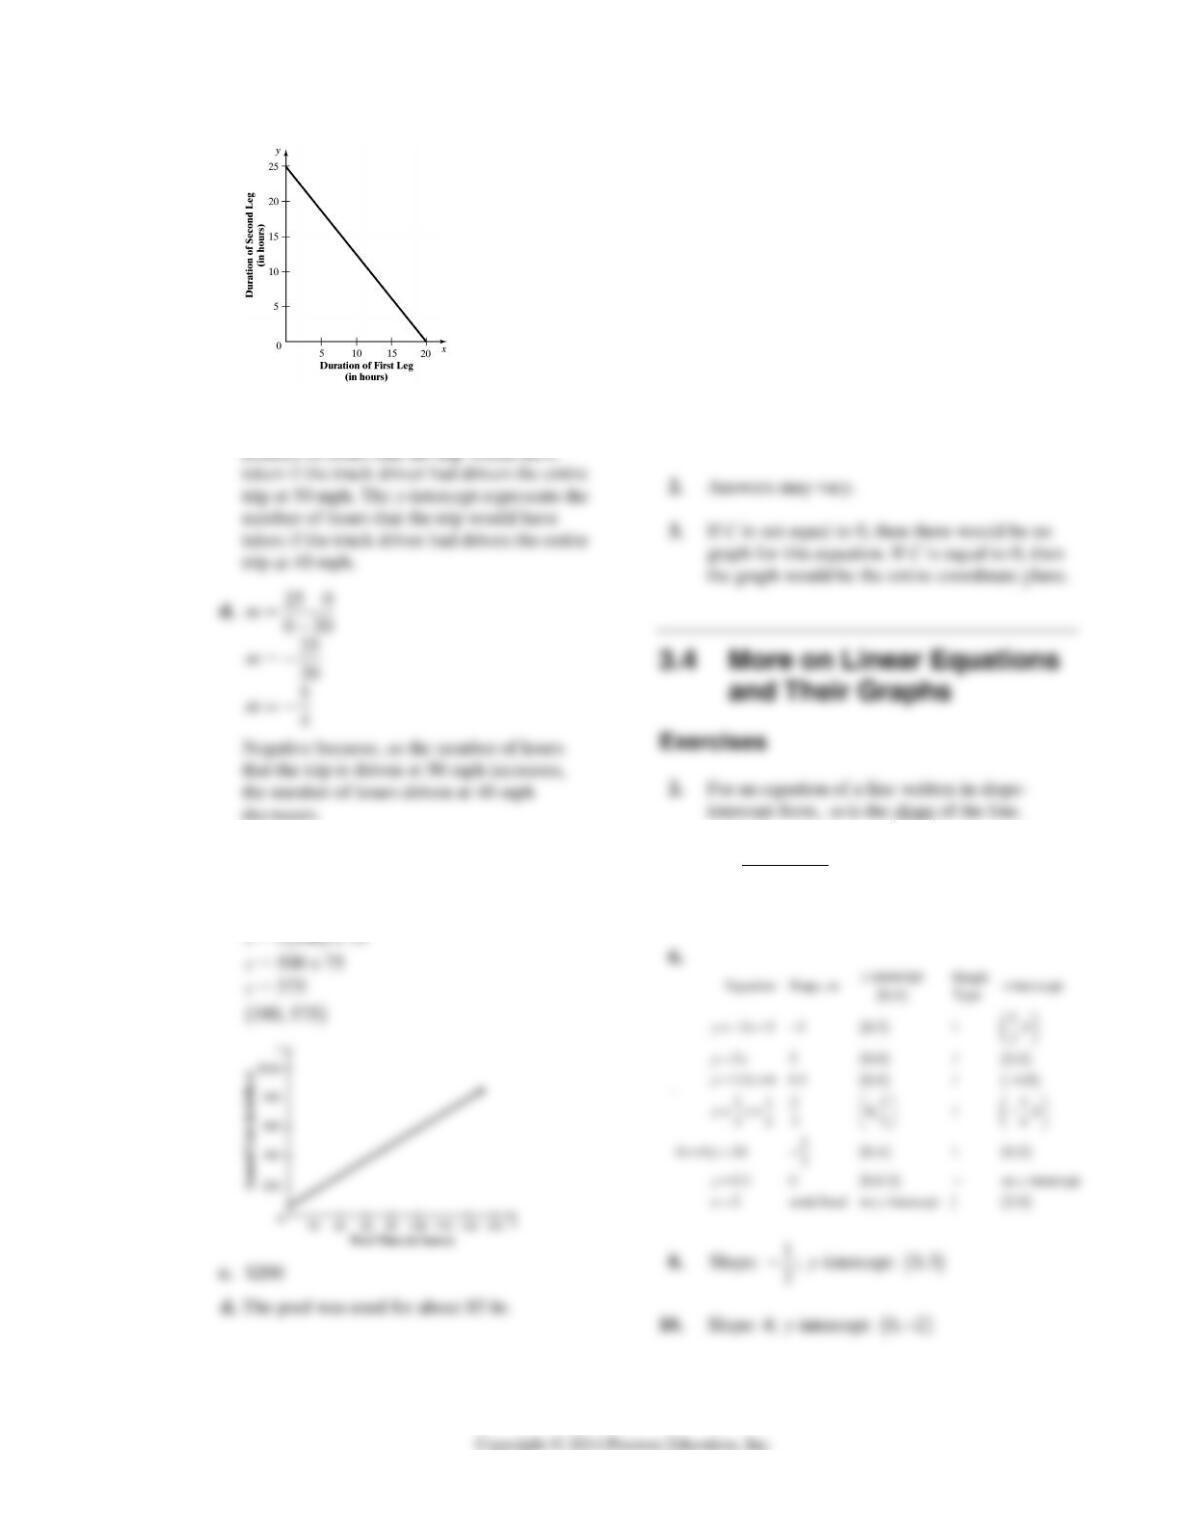
68. a. 229hl=+
b.
(
)
()
(
)
220 29 40 29 69
225 29 50 29 79
230 29 60 29 89
h
h
h
=+=+=
=+=+=
=+=+=
Section 3.4 More on Linear Equations and Their Graphs
55
70. b. (continued)
c. The x-intercept is (20, 0), and the y-intercept
is (0, 25). The x-intercept represents the
decreases.
72. a. 575ch=+
b.
()
5 0 75 75c=+=
Mindstretchers
1. a.
x-intercepts:
()
2, 0− and
()
2,0
y-intercept:
()
0, 4−
b.
For
()
2, 0 :−
()
2
2424440yx= −=− −=−=
For
()
2,0 :
()
2
242 4440yx= −= −=−=
For
()
0, 4 :−
22
40 404 4yx=−=−=−=−
4. The point-slope form of a linear equation is
written as
()
11
yy mxx−= − where 11
,,xy
and m are constants.
Chapter 3 Graphing Linear Equations and Inequalities in Two Variables
56
12. 315
xy
yx
−=
−
=
14. 7
7
xy
yx
+=
=− +
5
18. 48 12
8412
8412
88 8
13
22
xy
yx
yx
yx
−=
−−+
=
−−
=+
−− −
=−
20.
()
13 5
yx
−= −
26. 31yx=+
30. 4
4
xy
yx
+=−
−−
=
34. 2312
3212
3212
xy
yx
yx
+=
−+
=
−
=+
Section 3.4 More on Linear Equations and Their Graphs
57
34. (continued)
36.
44. 31 4 4
25 3 3
m−− −
===
−−
()
4
15
yx
−= −
48. 1x=
50. 7y=
11
()
()
()
1
25
3
1
25
3
15
233
156
333
11
yx
yx
yx
yx
−=− −−
−=− +
−=− −
=− − +
62. 36 8
638
638
666
xy
yx
yx
−=
−=−+
−−
=+
−−−
Chapter 3 Graphing Linear Equations and Inequalities in Two Variables
58
66.
()
21 3 3
224 4
m−− −
===−
−−
() ()
3
22
yx
−− =− −
68. 32 4
234
234
xy
yx
yx
+=
=− +
−
=+
70.
()
52 3
40 4
3
54
m
yx
−
==
−
−= −
72. a. 150 1500Vt=− +
b.
74. a.
(
)
65,000 5000 3
65,000 5000 15,000
5000 15,000 65,000
5000 50,000
yx
yx
yx
yx
−= −
−=−
=−+
=+
c. The y-intercept represents the value of the
condo when it was purchased.
c.
()
14 0 116 116s=− + =
The speed of the train when the brakes
()
1
10 0
250
110, or 0.004 10
250
LC
LC L C
−= −
=+ = +
Section 3.5 Linear Inequalities and Their Graphs
59
Mindstretchers
1. a.
270
27
7
2
x
x
x
−=
=
=
b. The x–intercept of the line is 7,0 .
2
⎛⎞
⎟
⎜⎟
⎜⎟
⎜
⎝⎠
The
x-coordinate of the x-intercept of the graph
of 27yx=−
is the same as the solution
3.5 Linear Inequalities and
Their Graphs
Exercises
2. A solution of an inequality in two variables is
an ordered pair of numbers that when substitu-
6. If the boundary line is broken, it is not part of
the graph.
8.
5
yx>−
10.
()
25
3
2
165
3
145
11
yx
≤− +
≤− +
≤− +
≤
Yes, a solution
12.
() ( )
5312
50 3 2 12
xy+≥
+−≥
16. xy<
18. yx≤
Chapter 3 Graphing Linear Equations and Inequalities in Two Variables
60
24.
()
3
Test point: 0,0
0 3 False
x>
>
26.
()
4
Test point: 0,0
0 4 True
y<
<
28. yx≤−
Test point:
1, 0
()
2
01
3
2
0 True
3
>−
≥−
34. 1yx≥− −
Section 3.5 Linear Inequalities and Their Graphs
61
36. 412
412
yx
yx
+<−
<− −
38. 32 4
234
32
2
xy
yx
yx
−≤
−≤−+
≥−
40. 321
231
31
22
xy
yx
yx
−+ <
<+
<+
40. (continued)
44. xy>
Chapter 3 Graphing Linear Equations and Inequalities in Two Variables
62
48. 23 6
326
22
xy
yx
yx
−<
−<−+
>−
50. a. 0.75ms≤
b.
52. a.
16 12 1500, or
4 3 375
xy
xy
+≤
+≤
b.
54. a. 0.05 0.1 2000cf+≤
b.
0.1 1000
0.1 1000
0.1 0.1
10,000
f
f
f
≤
≤
≤
The couple can afford to borrow at most
$10,000 for furniture.
c. Answers may vary. Possible answer: The
elevator will be overloaded if 10 children
and 10 adults are on it.
Section 3.5 Linear Inequalities and Their Graphs
63
58. b. Answers may vary. Possible answers:
60. 60 50 300;
66
5
xy
yx
+<
<− +
Mindstretchers
1. If the graphs of , , and ybyb yb<= >
are on
the same coordinate plane, you get the entire
coordinate plane. Yes, you would get the same
answer if b were negative.
2.