
Solution
1. Study the four accompanying diagrams. Consider the following statements and indi-
cate which diagram matches each statement. Which variable would appear on the
horizontal and which on the vertical axis? In each of these statements, is the slope
positive, negative, zero, or infinity?
Panel (a) Panel (b)
Panel (c) Panel (d)
d. Consumers buy more frozen yogurt when the price of ice cream goes up.
e. Research finds no relationship between the number of diet books purchased and
the number of pounds lost by the average dieter.
f. Regardless of its price, Americans buy the same quantity of salt.
1. a. Panel (a) illustrates this relationship. The higher price of movies causes consum-
ers to see fewer movies. The relationship is negative, and the slope is therefore
negative. The price of movies is the independent variable, and the number of mov-
S-23
2 A
CHAPTER
Appendix: Graphs in Economics
KrugWellsECPS4e_Micro_CH02A.indd S-23KrugWellsECPS4e_Micro_CH02A.indd S-23 9/30/14 12:51 PM9/30/14 12:51 PM
S-24 CHAPTER 2 APPENDIX GRAPHS IN ECONOMICS
c. Panel (d) illustrates this relationship. With the temperature on the horizontal
axis as the independent variable, and the consumption of hot dogs on the vertical
axis as the dependent variable, we see there is no change in hot dog consumption
2. During the Reagan administration, economist Arthur Laffer argued in favor of low-
ering income tax rates in order to increase tax revenues. Like most economists, he
believed that at tax rates above a certain level, tax revenue would fall because high
taxes would discourage some people from working and that people would refuse to
work at all if they received no income after paying taxes. This relationship between
tax rates and tax revenue is graphically summarized in what is widely known as the
Laffer curve. Plot the Laffer curve relationship assuming that it has the shape of a
nonlinear curve. The following questions will help you construct the graph.
a. Which is the independent variable? Which is the dependent variable? On which
axis do you therefore measure the income tax rate? On which axis do you measure
income tax revenue?
Solution
2. a. The income tax rate is the independent variable and so is measured on the hori-
zontal axis. Income tax revenue is the dependent variable and so is measured on
the vertical axis.
Income
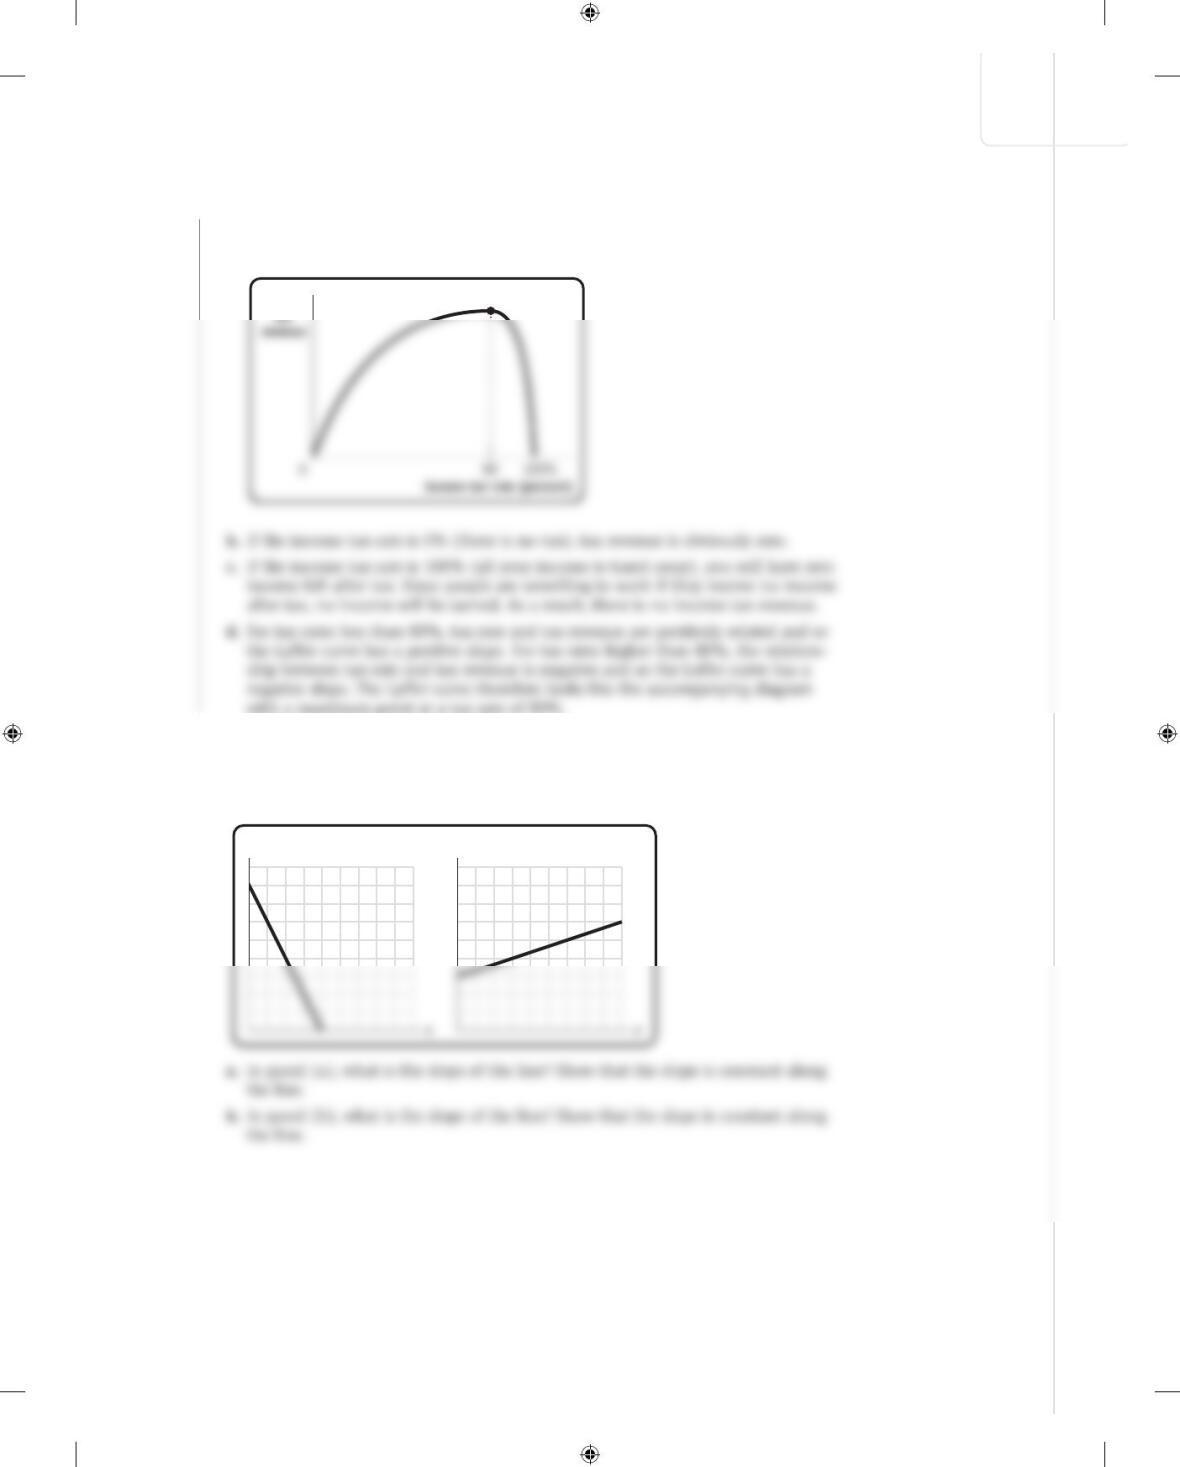
3. In the accompanying figures, the numbers on the axes have been lost. All you know
is that the units shown on the vertical axis are the same as the units on the horizon-
tal axis.
y
y
Panel (a) Panel (b)
CHAPTER 2 APPENDIX GRAPHS IN ECONOMICS S-25
KrugWellsECPS4e_Micro_CH02A.indd S-25KrugWellsECPS4e_Micro_CH02A.indd S-25 9/30/14 12:51 PM9/30/14 12:51 PM
Solution
Solution
3. a. In panel (a), the slope is −2. From any point on the line, moving one unit to the
right along the horizontal axis requires moving down two units along the vertical
axis in order to remain on the line. The slope is the “rise” (−2) over the “run”
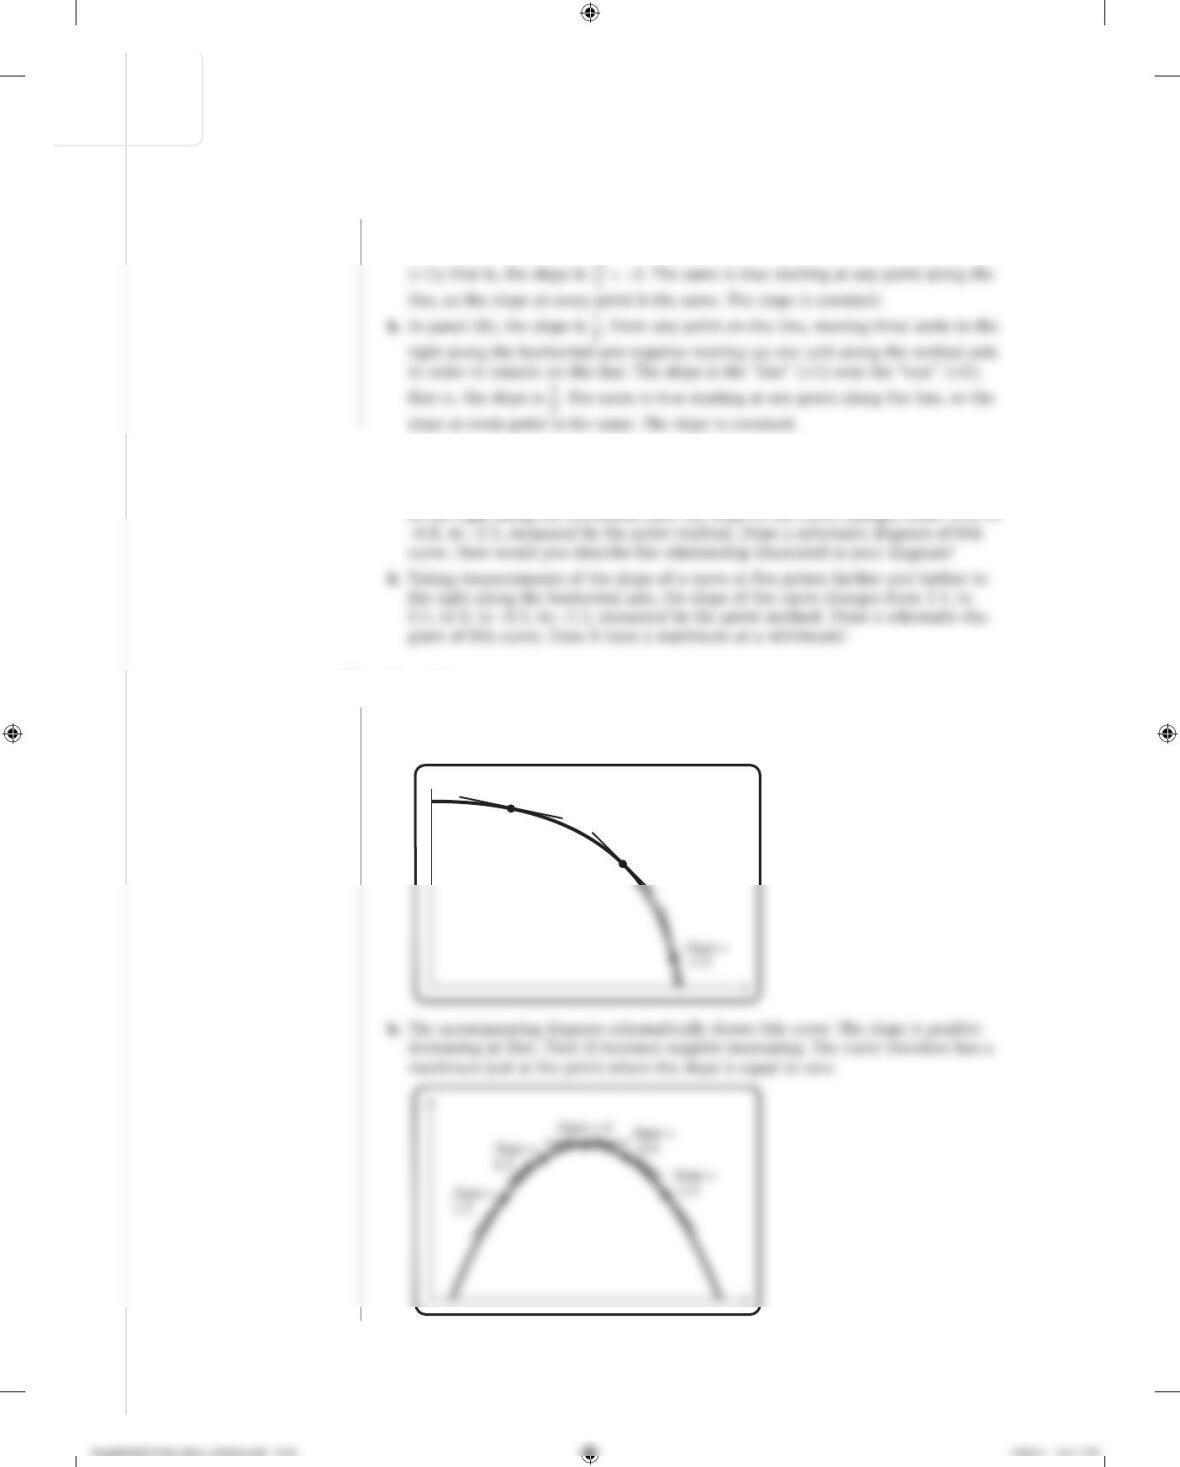
4. Answer each of the following questions by drawing a schematic diagram.
a. Taking measurements of the slope of a curve at three points farther and farther
4. a. The accompanying diagram schematically shows this curve. The slope is negative
throughout. That means that the curve is downward sloping. Because the absolute value
of the slope is increasing, the curve becomes steeper. The slope is negative increasing.
y
Slope = –0.3
Slope = –0.8
S-26 CHAPTER 2 APPENDIX GRAPHS IN ECONOMICS
Solution
Solution
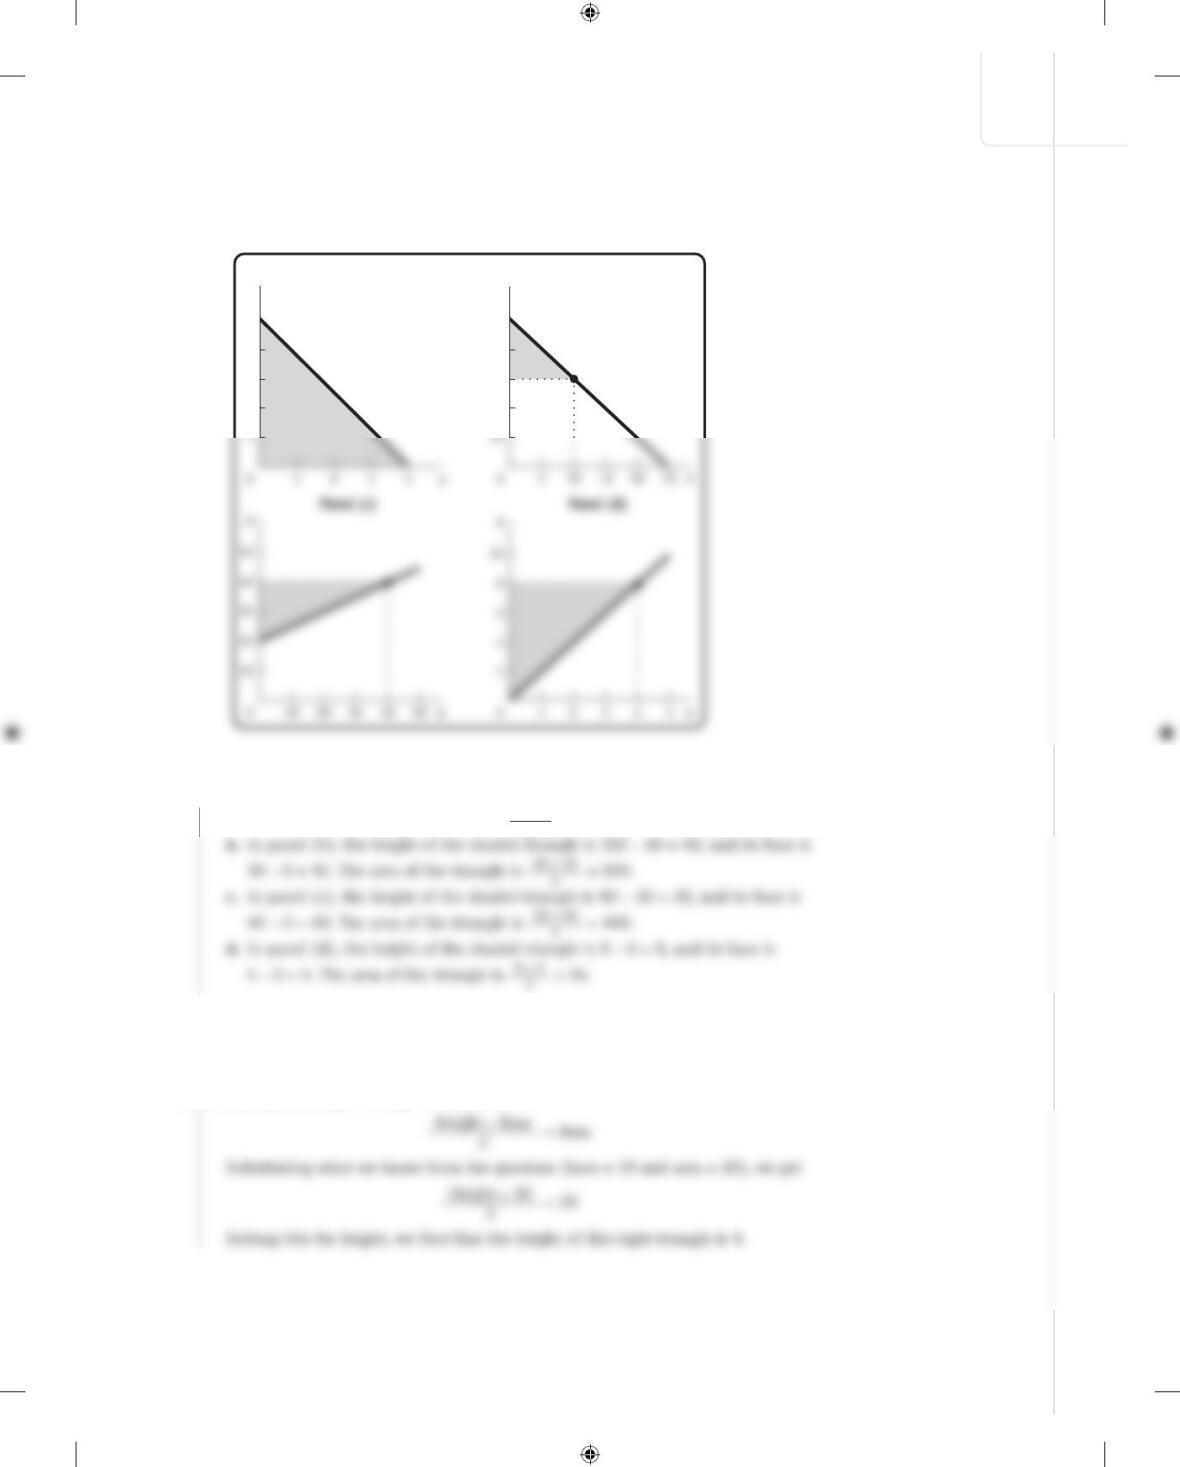
5. For each of the accompanying diagrams, calculate the area of the shaded right
triangle.
5
4
3
2
y
100
80
60
40
y
Panel (a) Panel (b)
5. a. In panel (a), the height of the shaded triangle is 5 − 0 = 5, and its base is
4 − 0 = 4. The area of the triangle is 5 × 4
2 = 10.
6. The base of a right triangle is 10, and its area is 20. What is the height of this right
triangle?
6. The area of a right triangle is calculated as
CHAPTER 2 APPENDIX GRAPHS IN ECONOMICS S-27
KrugWellsECPS4e_Micro_CH02A.indd S-27KrugWellsECPS4e_Micro_CH02A.indd S-27 9/30/14 12:51 PM9/30/14 12:51 PM
Solution
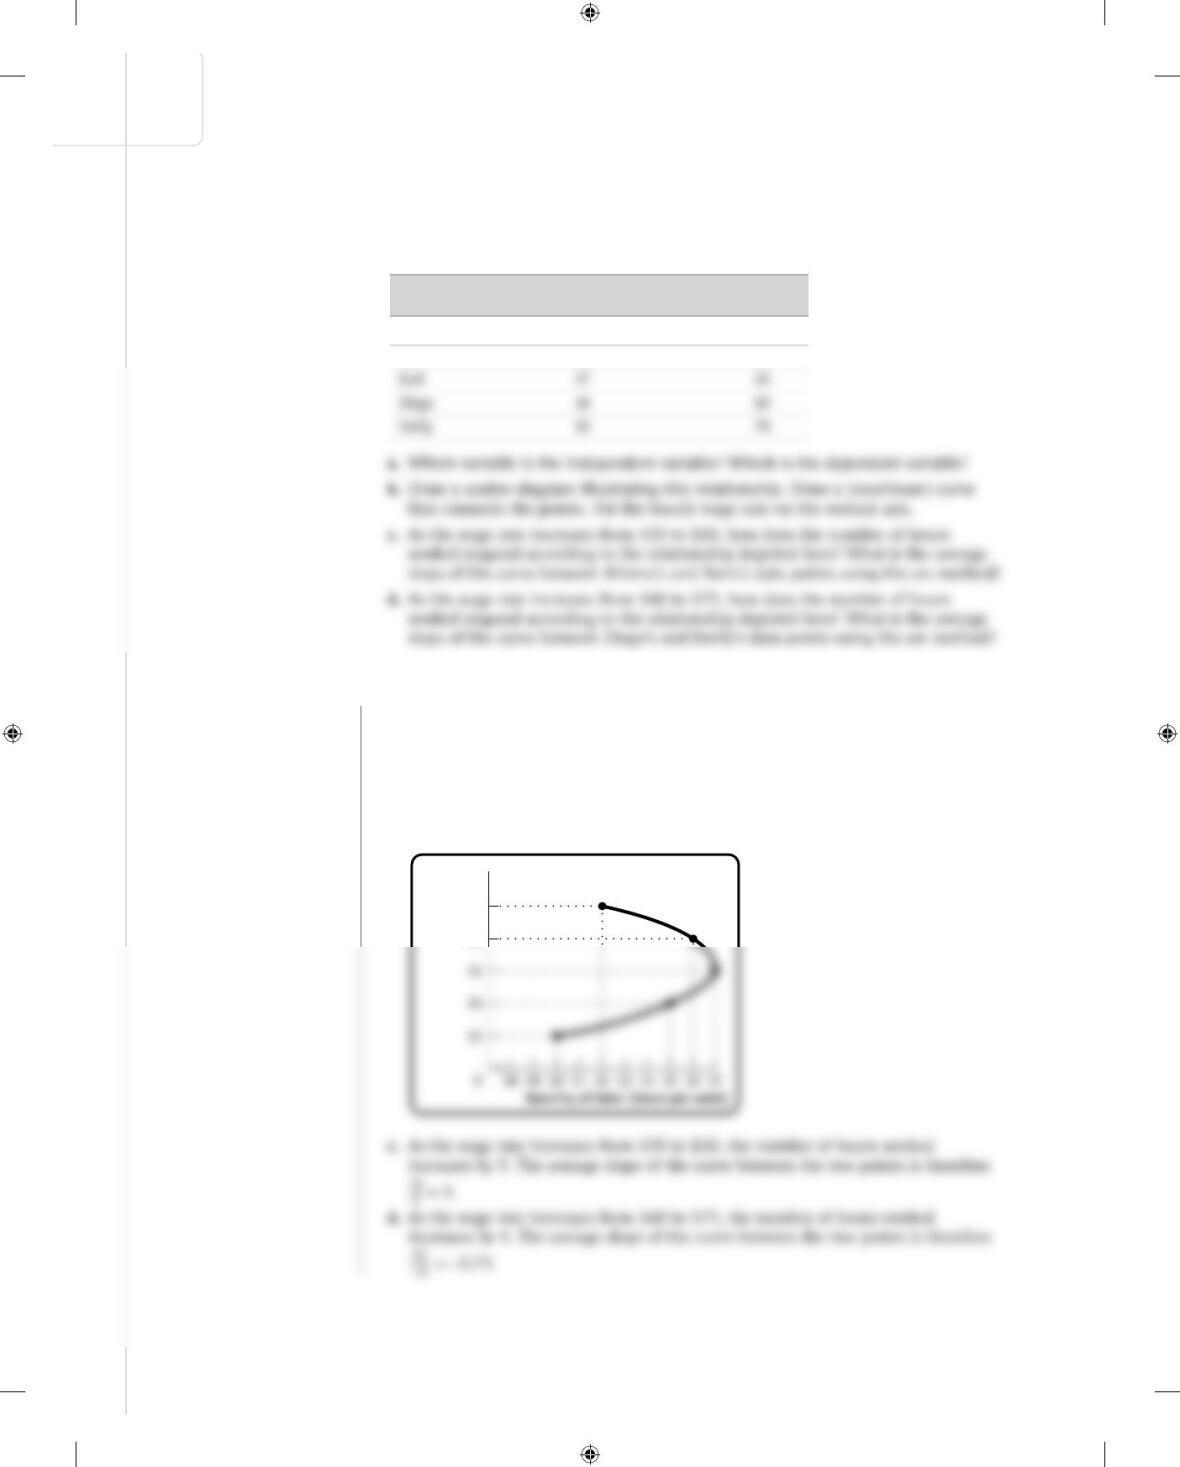
7. The accompanying table shows the relationship between workers’ hours of work per
week and their hourly wage rate. Apart from the fact that they receive a different hour–
ly wage rate and work different hours, these five workers are otherwise identical.
7. a. If the wage rate is greater than your opportunity cost of time, you will choose
to work. So the wage rate is the independent variable and the number of hours
worked is the dependent variable.
b. The accompanying diagram illustrates the relationship between the hourly wage
rate and the number of hours worked. Since the hourly wage rate is the price paid
for labor, economists place wages on the vertical axis—just as in the case of other
types of prices.
$75
60
Wage rate
(per hour)
Quantity of labor Wage rate
Name (hours per week) (per hour)
Athena 30 $15
Boris 35 30
S-28 CHAPTER 2 APPENDIX GRAPHS IN ECONOMICS
KrugWellsECPS4e_Micro_CH02A.indd S-28KrugWellsECPS4e_Micro_CH02A.indd S-28 9/30/14 12:51 PM9/30/14 12:51 PM
Solution
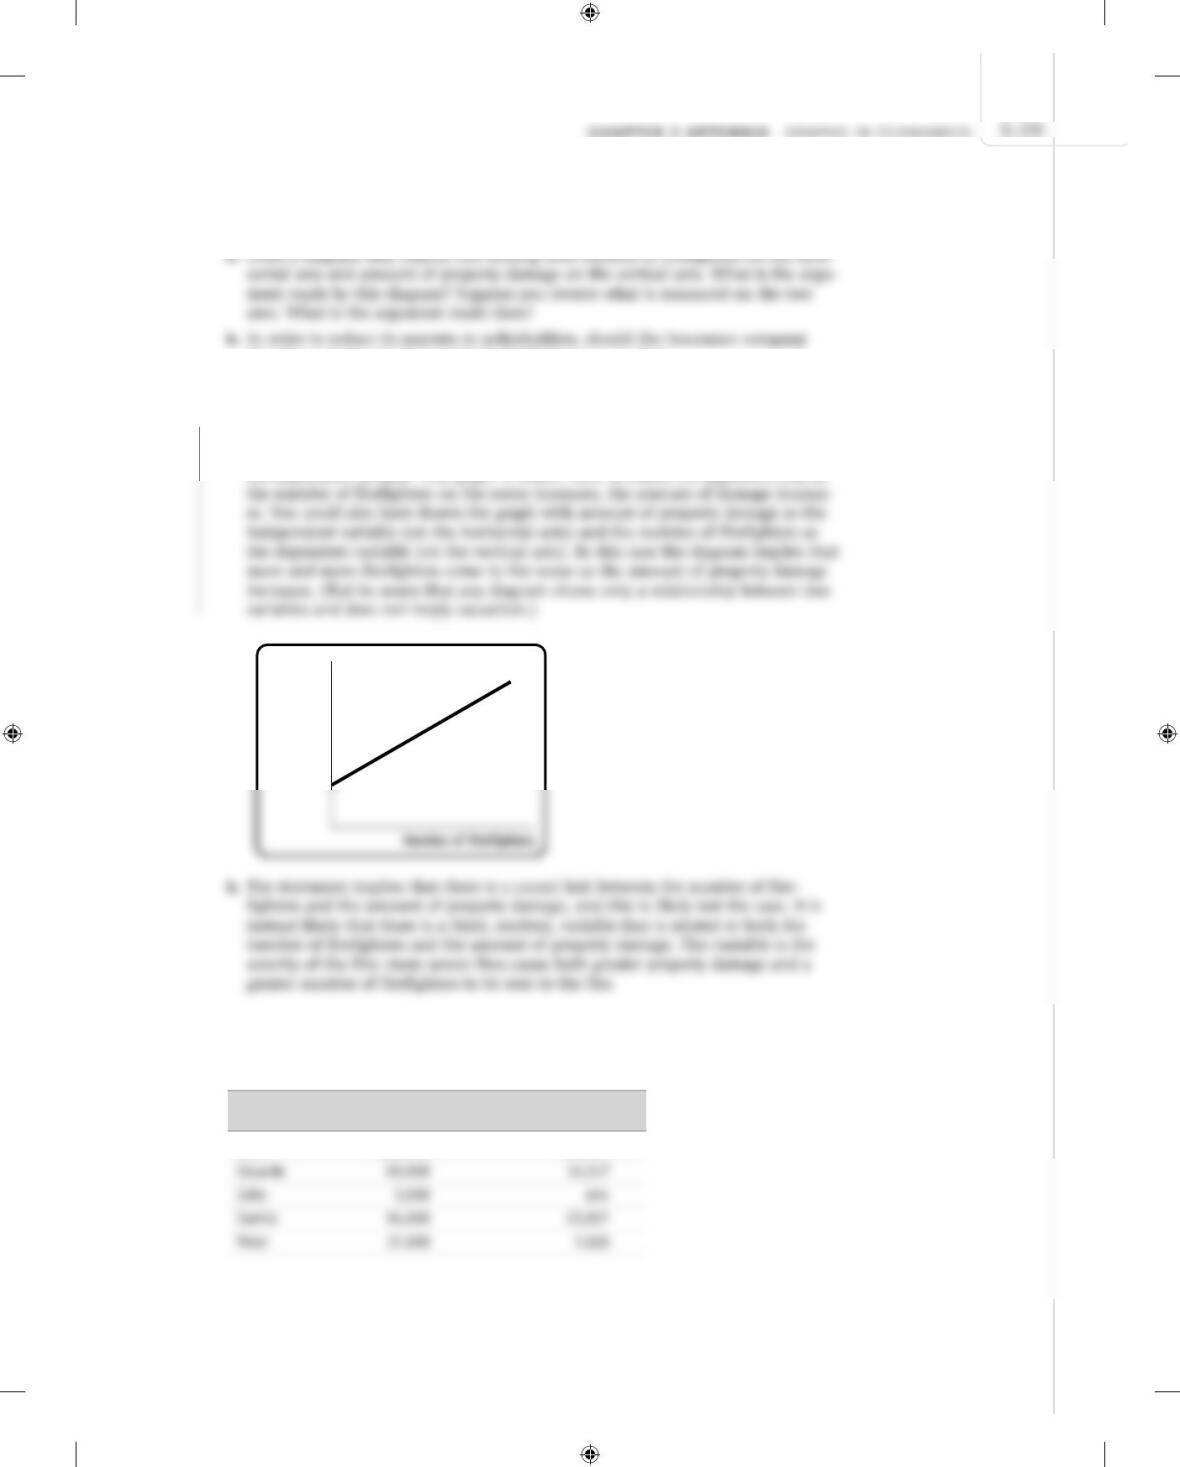
8. An insurance company has found that the severity of property damage in a fire is
positively related to the number of firefighters arriving at the scene.
therefore ask the city to send fewer firefighters to any fire?
8. a. By drawing the diagram with number of firefighters on the horizontal axis and
amount of property damage on the vertical axis, you are assuming that the num-
ber of firefighters is the independent variable and amount of property damage is
the dependent variable. That graph is shown here. It makes the argument that as
Amount of
property
damage
9. The accompanying table illustrates annual salaries and income tax owed by five
individuals. Apart from the fact that they receive different salaries and owe different
amounts of income tax, these five individuals are otherwise identical.
Annual income
Name Annual salary tax owed
Susan $22,000 $3,304
KrugWellsECPS4e_Micro_CH02A.indd S-29KrugWellsECPS4e_Micro_CH02A.indd S-29 9/30/14 12:51 PM9/30/14 12:51 PM
Solution
a. If you were to plot these points on a graph, what would be the average slope of the
curve between the points for Eduardo’s and Camila’s salaries and taxes using the
9. a. Annual salary is the independent variable and so is measured on the horizontal
axis. Annual income tax owed is the dependent variable and so is measured on the
vertical axis. As salary increases by $31,000 from Eduardo’s $63,000 to Camila’s
$94,000, income tax owed increases by $9,610. That is, the slope of the curve is
10. Studies have found a relationship between a country’s yearly rate of economic growth
and the yearly rate of increase in airborne pollutants. It is believed that a higher rate
of economic growth allows a country’s residents to have more cars and travel more,
thereby releasing more air borne pollutants.
a. Which variable is the independent variable? Which is the dependent variable?
b. Suppose that in the country of Sudland, when the yearly rate of economic growth
S-30 CHAPTER 2 APPENDIX GRAPHS IN ECONOMICS
KrugWellsECPS4e_Micro_CH02A.indd S-30KrugWellsECPS4e_Micro_CH02A.indd S-30 9/30/14 12:51 PM9/30/14 12:51 PM
Solution
10. a. According to the question, economic growth causes the increase in air borne
pollut ants. That is, the growth rate is the independent variable and the rate of
increase in air borne pollutants is the dependent variable. So the rate of increase in
CHAPTER 2 APPENDIX GRAPHS IN ECONOMICS S-31
KrugWellsECPS4e_Micro_CH02A.indd S-31KrugWellsECPS4e_Micro_CH02A.indd S-31 9/30/14 12:51 PM9/30/14 12:51 PM