Tashtego
Teaching Commentary
OVERVIEW
Upon first review, this case appears to be a complicated, but straightforward, exercise in financial analysis for a “capacity
allocation” decision—where should the “productive capacity” represented by the ship Tashtego be deployed? This seems
to be just an exotic example of the familiar machine allocation problem.
As we shall demonstrate, the case is really much richer than that. It also deals with capacity expansion, “hub and
TEACHING STRATEGY (A)
The first five assignment questions constitute a structured approach to the ostensible issue in the case—the capacity
assignment problem. Even though the issues here are straightforward, the “facts” are complicated enough that it is very
difficult to pull them together clearly. The five questions allow the student to tackle the problem logically, one step at a
ANSWERS TO ASSIGNMENT QUESTIONS
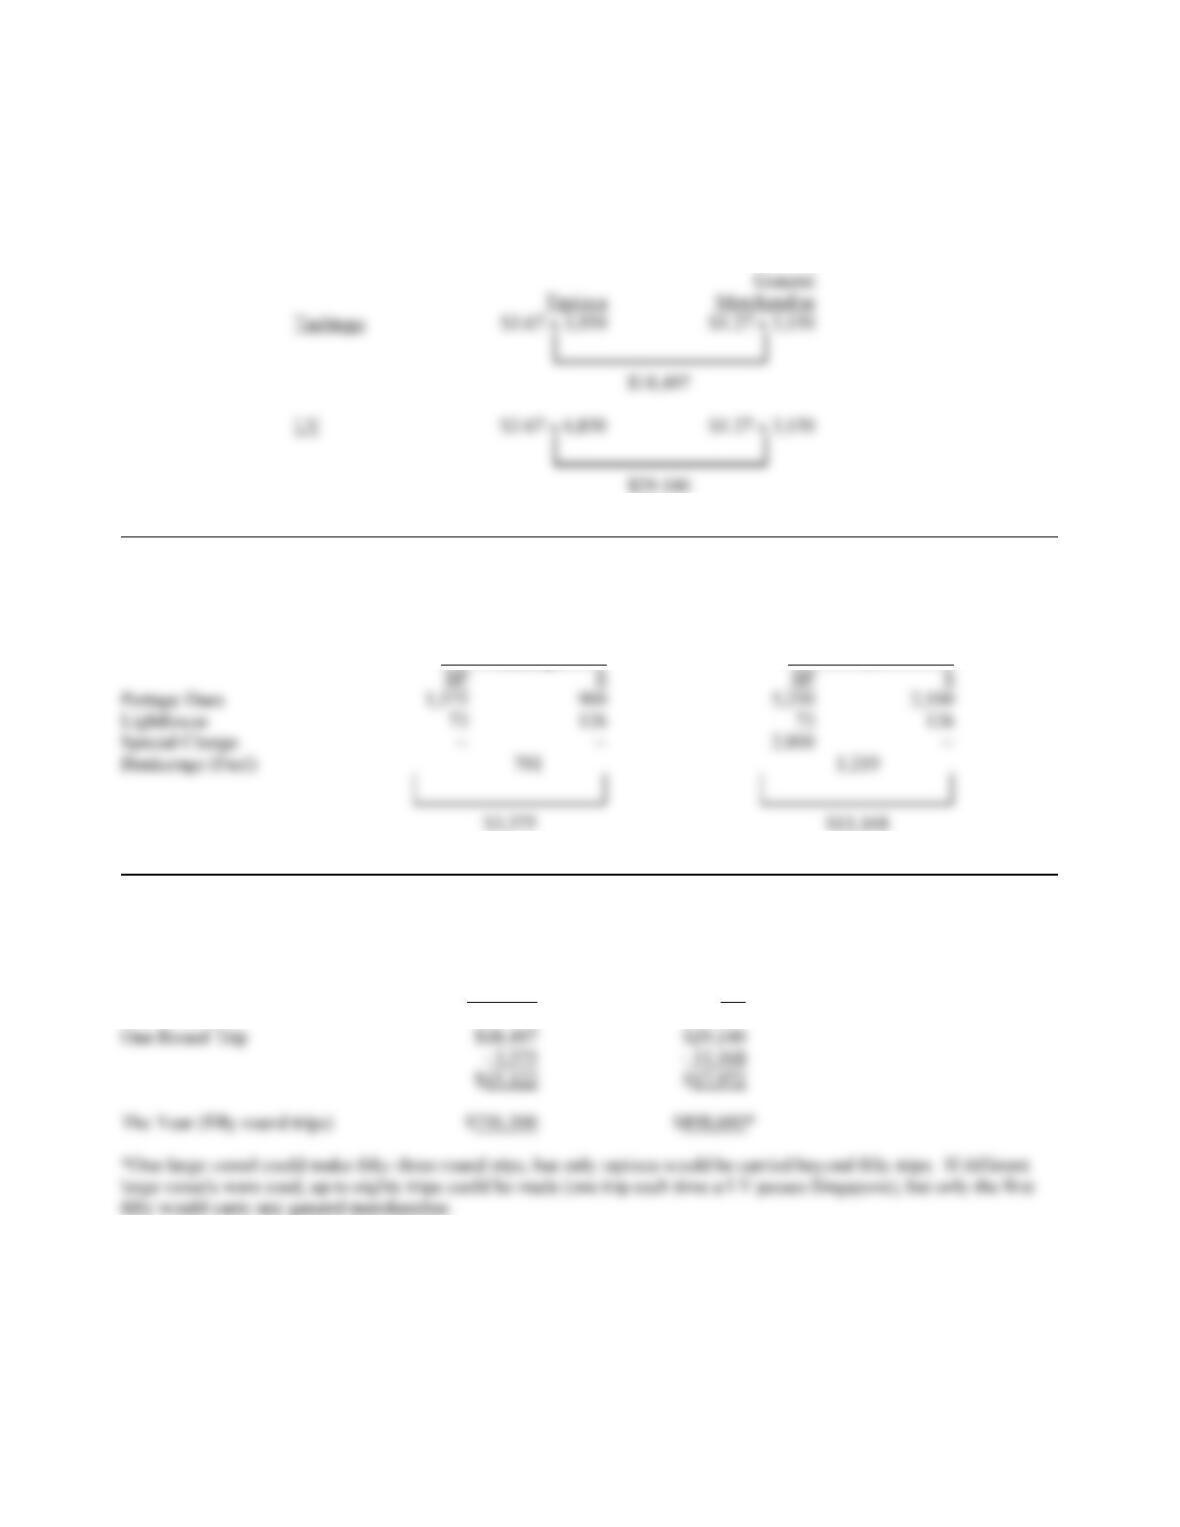
Question 1
Contribution per ton of cargo (considering only cargo–related costs):
Tapioca General Merchandise
Revenue $5.10 $2.70
IRRESPECTIVE OF THE VESSEL
32-2
Question 2
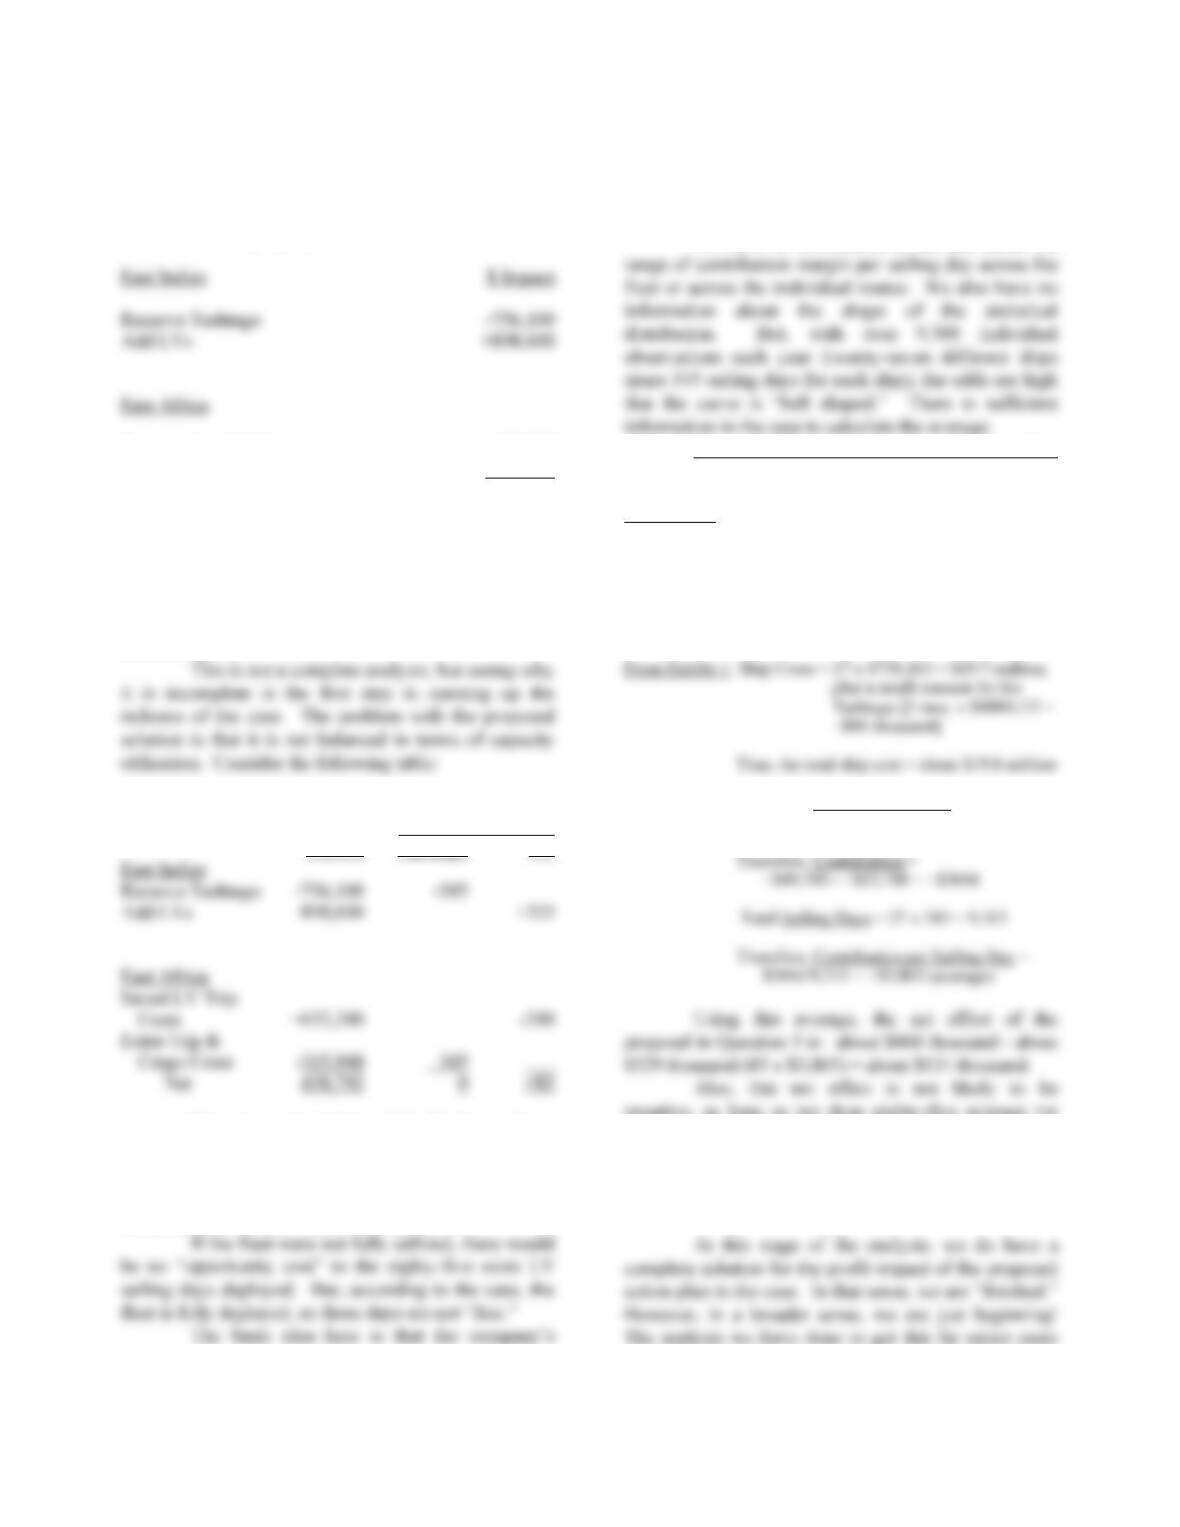
“Contribution” per trip, considering only revenue and cargo costs:
Question 3
Trip Costs (irrespective of the cargo):
Tashtego LV
Question 4
“Contribution” per year (merging cargo-related and trip-related items):
Tashtego LV
32-3
Question 5 (Merging case Question 4 with Exhibits 3
and 4)
Net effect of the proposal:
Ex. 4 -> Saved LV costs +632,240
Ex. 3 -> Cargo & Trip Costs Incurred –315,948
NET +458,792
Are we finished?
In one sense, the analysis is now complete.
The net profit impact of moving the Tashtego and using
large vessels on the tapioca trade is positive by about
$460,000 per year—Do it!
Sailing Days
Committed
Profit $ Tashtego LV
This proposal is balanced for Tashtego, but it
involves investing an extra eighty–five LV sailing days.
The net effect is thus: $458,792 minus the lost
contribution from eighty-five LV sailing days
redeployed. Is this net a plus or a minus?
“product” is sailing days. Each sailing day deployed
contributes to profit based on revenues less cargo costs
and trip costs.
We have no information in the case about the
Average Contribution Per Sailing Day
(considering cargo and trip-related items):
Per Exhibit 5 Revenue (cargoes) = $49.7 million
Voyage Expenses =
Ship Costs
Trip Costs $33.5 million
Cargo Costs
Therefore, Trip & Cargo Costs =
~$33,500 – ~$19,800 = ~$13,700
negative, as long as we drop eighty-five average (or
below average) contribution margin days from the
current distribution.
Are we finished, now?

32-4
new questions than it answers.
This is a good general lesson for students
about cost analysis. Very often, analysis we do to
frame an answer to “question A” leads us to see that
sailing day ($898,000 ÷ 325). This doesn’t really look
like very good business for a large vessel.
Does this mean we should reject the proposal
altogether? Some further thought at this point reveals
that the proposal can really be broken into two parts:
1. Use the Tashtego as a freight tender in East
Africa to free up 240 LV sailing days.
Is this a good idea?
Yes, as long as we can invest those newly
found sailing days to generate more than $439,808 of
“contribution.” We must average 439,808 ÷ 240 =
1,832 per sailing day. Is this likely? Yes, it is very
likely if the ships are fully deployed now and the
average contribution margin is $3,865 per day.
for those newly found LV sailing days.
Are we finished?
One problem with this new conclusion,
How profitable is this business?
The Tashtego as a “Tapioca” Ship
Capital Cost? = $223K x 15 years = $3.34M
Annual Return
Contribution $756K
– Cash Ship Costs (488 – 223) 265K
What does this suggest?
Leave the Tashtego where it is and buy a new
Tashtego to use as the freight tender in East Africa!
Then, look for the best possible LV new business that
generates more than $1,832 per sailing day.
Are we finished, now?
32-5
2. Costs (Trip and Cargo)
(Exhibit 3) Trips $188,508
Cargo 127,440
We need only generate $717 per sailing day
($172,000 ÷ 240) to make this a good move!
Are we finished, now?
This way of structuring the analysis suggests a
new twist. Why buy a 4,500-ton slow ship to shuttle
because it would make a good freight tender in East
Africa. An optimum freight tender between DES and
Zanzibar would be small and fast:
Small 1,350 ton current demand per trip
Fast Able to make eighty trips per year
Hypothetically (for a 2,000 T ship capable of steaming
With total annual cost of $532,000 and saved
LV costs of $632,000, we save $100,000 net, and free
up 240 LV sailing days! WOW.
Are we finished, now?
If we can do it in three places with
approximately the same economic impact, we can save
$300,000 per year, net, in voyage costs and free up the
equivalent of 2+ large vessels (240 x 3 ÷ 345). What
should we do with this extra capacity?
II. Use the incremental sailing days to expand our
revenues and our contribution dollars?
At what average contribution per sailing day?
If can get even $2,500/SD (average now =
$3,865) (Tapioca Trade in East Indies = $2,765 for
325 SDs)
TEACHING STRATEGY (B)

32-6
It is certainly not possible to cover all these issues in
one class if the instructor relies on student input at each
1. Try to cover Questions 1 to 4, with student input,
in no more than thirty minutes.
2. Ask for student questions, if any, on Exhibits 3 and
4.
level, moving quickly. I try to get as much student
input as possible, but I don’t really expect that the
I end the class by showing the transparency
attached here as Exhibit A. Students leave the class
overwhelmed, in one sense, by all the levels of analysis
and all the calculations in the preceding ninety minutes.
But, I believe they also leave the class with a better
appreciation for the important role of cost analysis in

Exhibit A
Tashtego—What’s the broad point?
THE PURPOSE OF COST ANALYSIS IS
BETTER QUESTIONS, NOT FINAL
ANSWERS
______________
______________
And, an exotic journey at that!