24-1
Montclair Paper Mill
Teaching Commentary
OVERVIEW
Target Cost and Standard Cost. Much has been written in recent years that positions the concept of “target cost” as
very distinct from the concept of “standard cost.” Many authors are very emphatic that target cost is preferred over
standard cost as a cost management tool.
The Benefits of Target Costing? The benefits of “target costing” seem apparent at one level. And, in spite of
frequent misattribution, it is not a “Japanese” innovation. The concept can be traced back at least as far as eighty-five
• Canon in the personal copier
• FedEx in overnight mail
And, most of these instances did not start with a
“clean slate.” Target costing is sufficiently appealing at a
ANSWERS TO ASSIGNMENT QUESTIONS
Question 2
The Target Cost Methodology. Target cost is
an ex ante concept that starts at the end-user stage of the
value chain. Very broadly, the concept is “price–based
the target cost derives.
For products or services for which there is a
well-established substitute in the market, the “value price”
is just the selling price for that substitute item. This
concept is very simple to apply—the “value price” for a
product is the selling price of the competing product.
When there is not a well-established substitute product in
the market, the “value price” is much more difficult to
compute. Then, conceptually, it is equal to the “economic
value” that the product or service generates in the end–
price could be lowered substantially. But, how much
lower? They chose $60 as the price point, based on the
Dollar equivalent of the Yen value of the normal
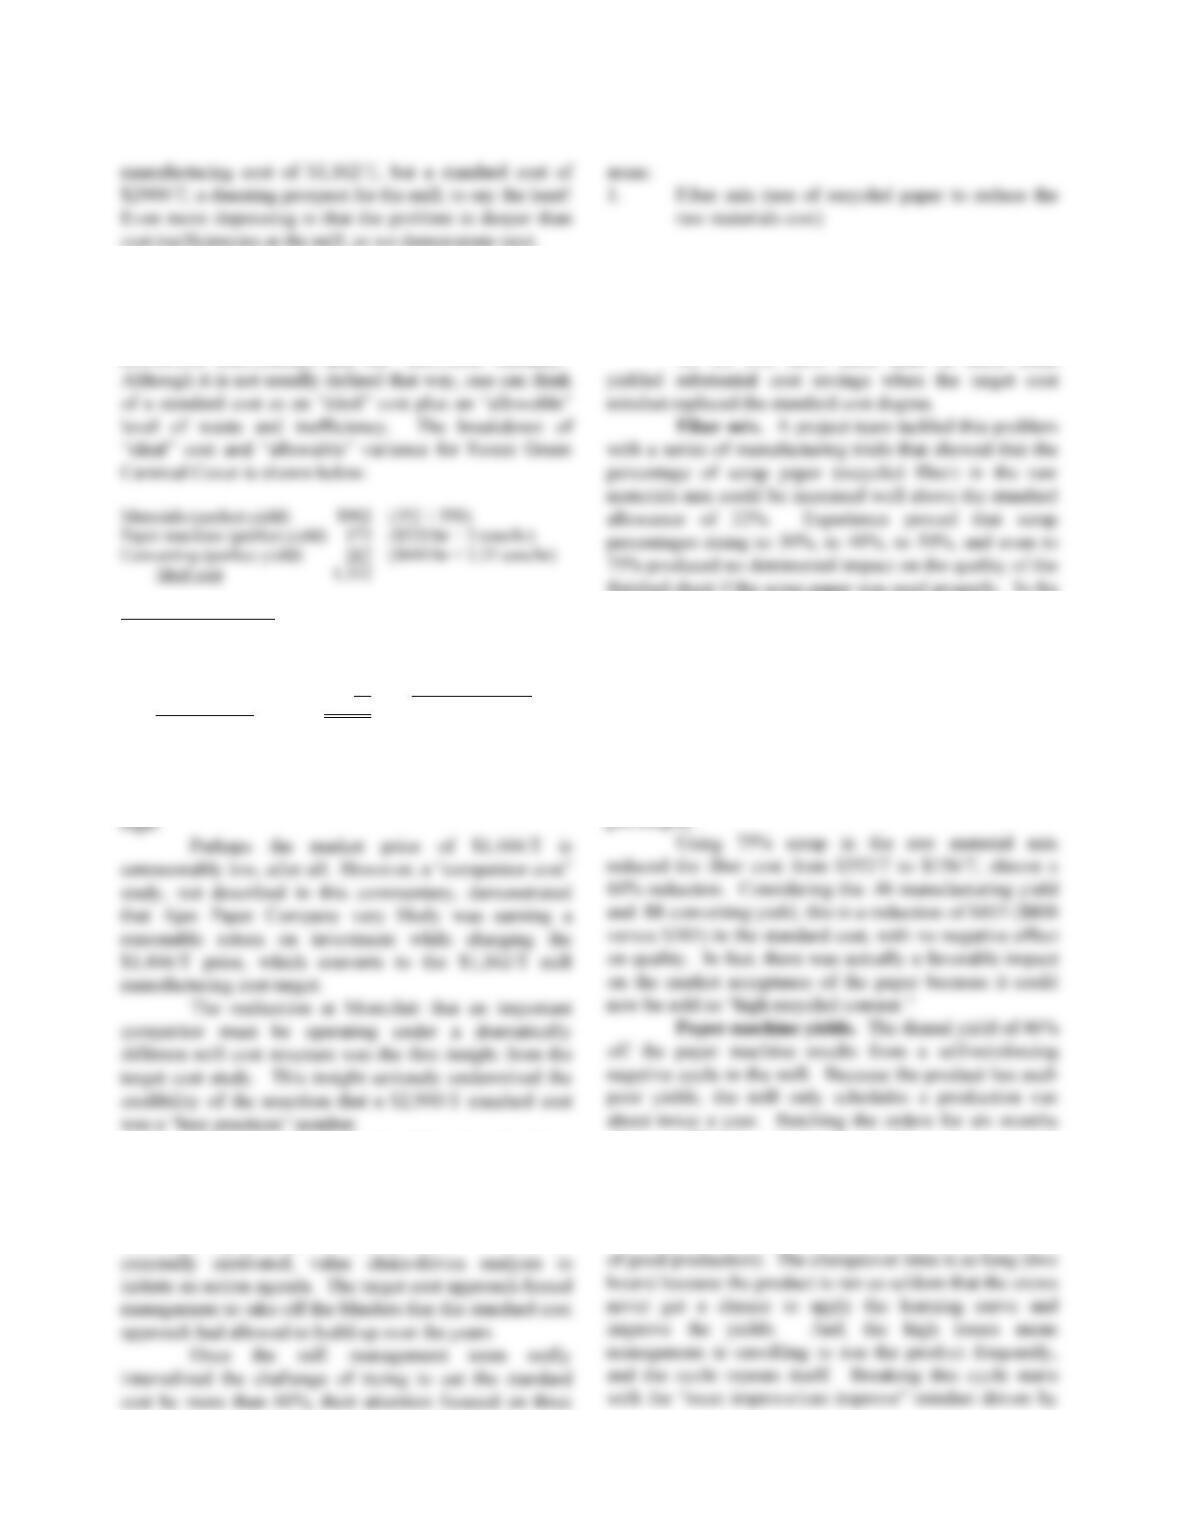
here, the value price is the $2,200/T, which Reebok is
paying to its printer for Ajax’ competing deep green
is beyond the scope of this commentary. It is largely
irrelevant to Montclair anyway, as long as that price
prevails in the market.
The last step in netting back to an “allowable”
mill target cost is to deduct an allowance for a reasonable
return on the investment at the Montclair mill. This is the
beyond the scope of this commentary. For our purposes,
suffice it to say that we are estimating a capital charge of
$120T based on a fully allocated mill investment of
$800/T (valued at replacement cost with full capacity
utilization), and an earning rate of 15% based on a
factory–level proxy for the firm’s cost of capital.
Since the Montclair mill sells to merchants from
its distribution center (DC), we must further deduct the
costs to get the product to and through the DC, including
a capital charge on the investment in the DC, as follows:
* Target cost before capital charge is $1,220. The capital
charge is based on the final target cost. This is a classic
simple “simultaneous equation” problem as follows:
24-3
cost inefficiencies at the mill, as we demonstrate next.
Question 3
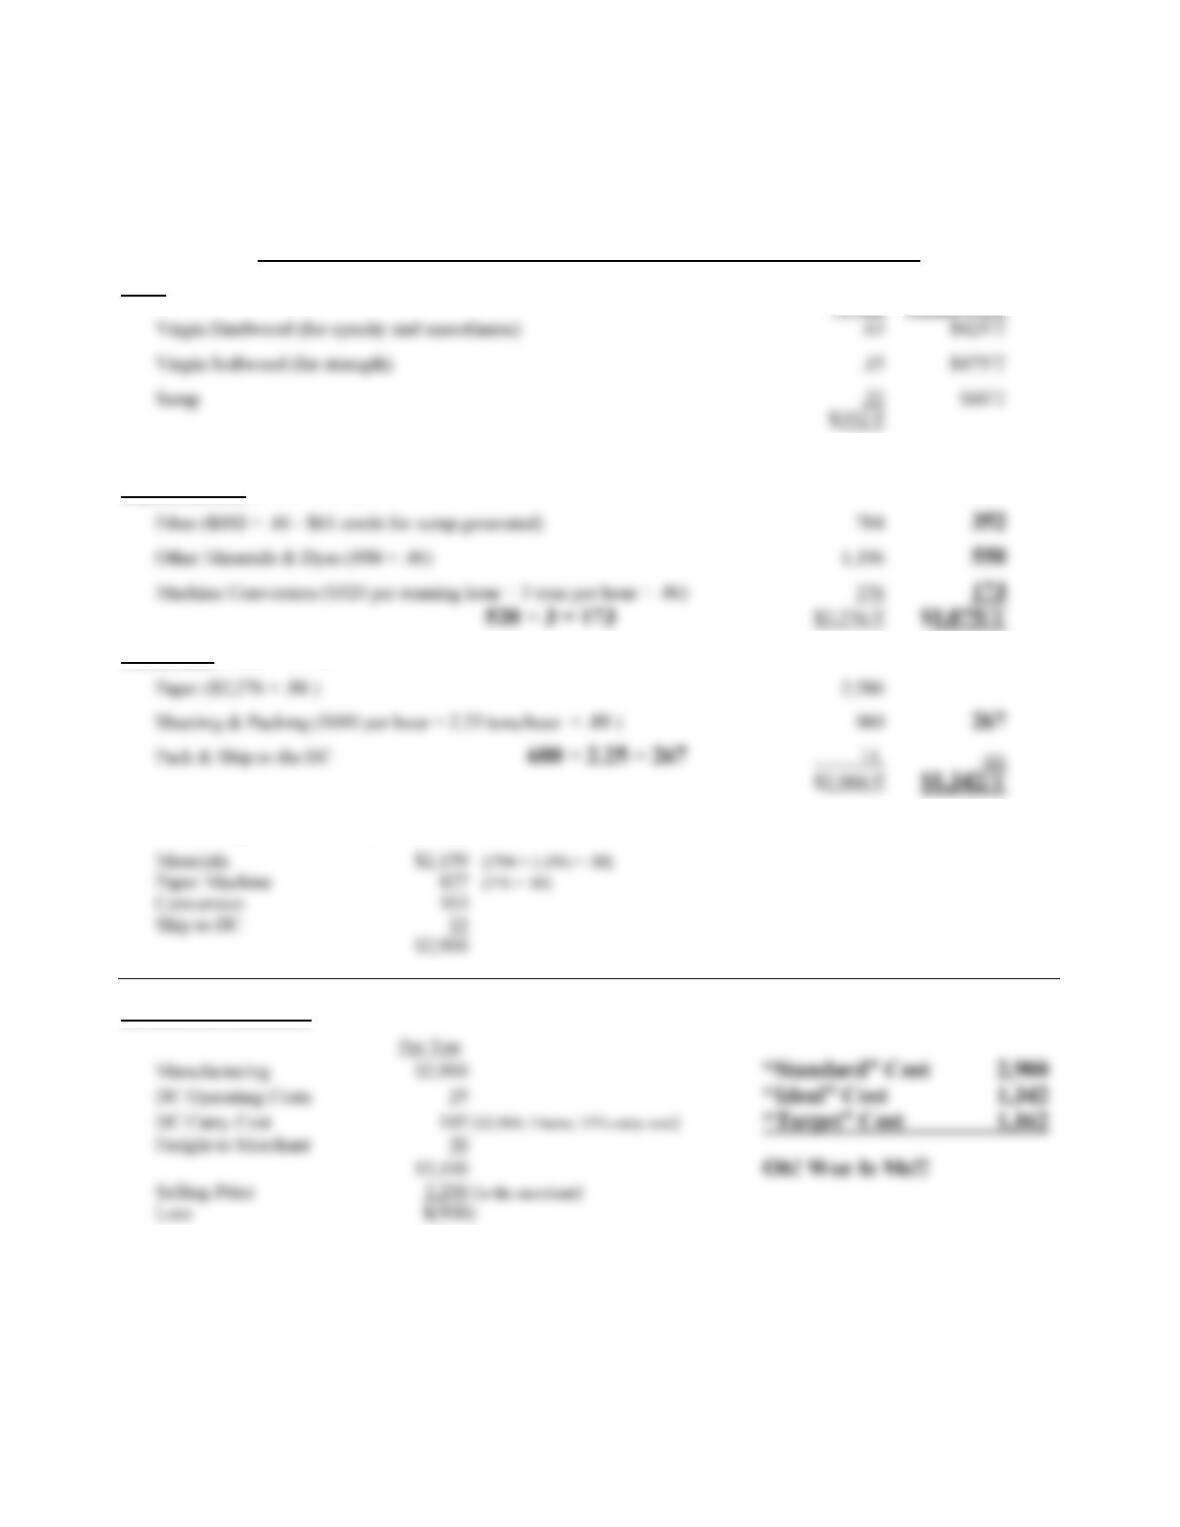
It is possible to decompose any standard cost
into an “ideal” cost (which allows no waste, scrap, or
conversion inefficiency) and the “allowable variance.”
“Allowable Variance”
Materials lost 1,257 ($2,159 – $902)
Lost paper machine time 254 ($427 – $173)
Conversion time lost 36 ($303 – $267)
Ship to DC 11 (A non-value adding step)
Standard Cost $2,900
In this situation, the ideal cost for the mill is
$1,342/T versus a target cost of $1,162/T. That is, even if
operations were perfect, the cost would still be $180/T too
Target Costing in Action (Question 4). Once
management at Montclair accepted the fact that the
product cost of $2,900 was more than $1,700/T too high,
they decided to undertake “reengineering” of the
manufacturing process for that product. It took this
2. Paper machine yields (getting “on grade” faster)
3. Conversions cost (“make” vs. “buy”)
As we will show here, each of these areas
finished sheet if the scrap paper was used properly. In the
standard cost mindset, there was no incentive to
experiment with a dramatically different and supposedly
lower quality raw materials mix. Once the scrap usage
experiments began, the results were so impressive that the
scrap percent just kept growing. This is parallel to the
well-known story in other industries where standard set–
up times of several hours for stamping machines have
been reduced, over time, to a few minutes by steady
application of the “Kaizen” (continuous improvement)
philosophy.
allows sufficient volume to justify a long enough
production run to amortize the anticipated heavy
changeover costs. Montclair needed to schedule a four-
hour run to get even as high as only .46 yield (about two
hours “set–up” time to get “on shade” and about two hours
24-4
the target cost study.
For Montclair, a “root cause” analysis of the long
change–over time revealed that getting “on shade” for a
designer-created subtle color such as “Forest Green” is
market demand for green “broke” (scrap), the mill was
able to buy essentially unlimited quantities at very low
prices. Broke dealers were perplexed as to why anyone
would even want colored broke! The very thin demand
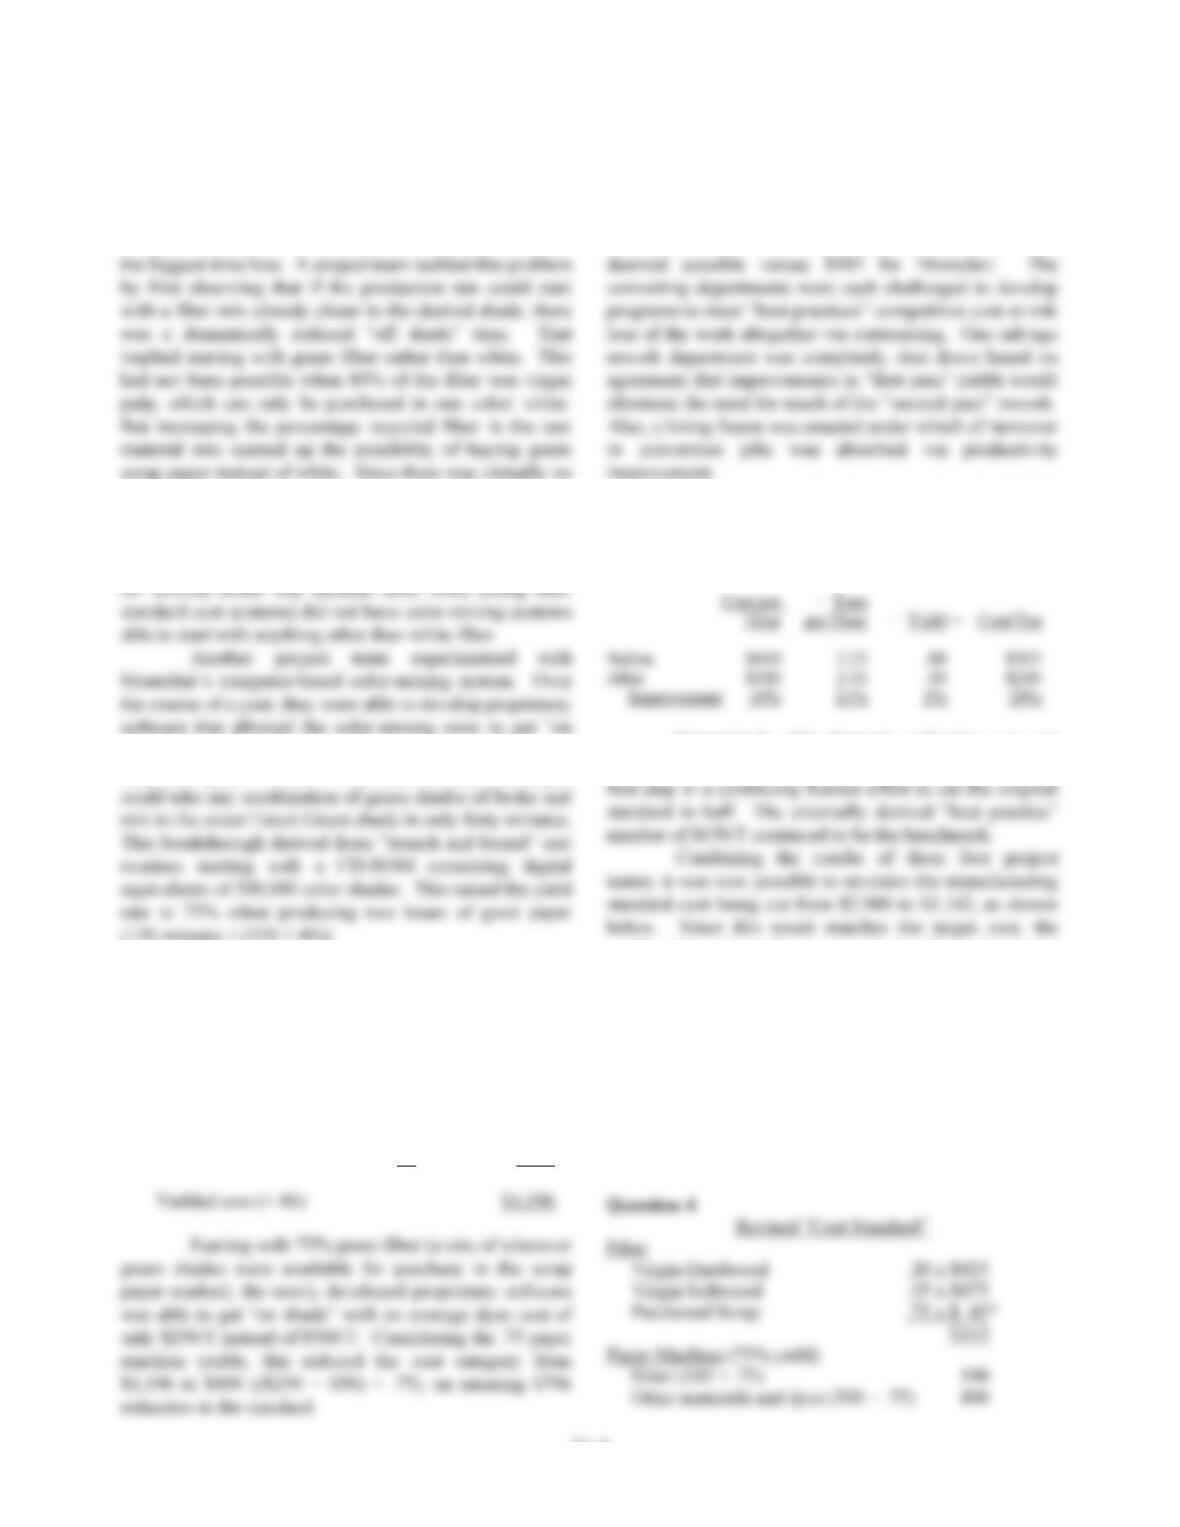
shade” in forty minutes instead of two hours if they could
start with green “broke.” The software they developed
(120 minutes ÷ (120 + 40)).
Dyes cost. A related advantage of starting with
up to 75% green fiber in the raw-materials mix is that
much less dye is needed to achieve the exact Forest Green
shade. In the standard cost, the $1,196 for “other
materials and dyes” was calculated as follows:
Perfect yields:
Dyes $500
Fillers 50 $550
Conversion cost. Another project team tackled
this problem by seriously considering the “make” versus
“buy” option. Based on a preliminary “best practices”
survey, a “world class” converting cost of $150/T was
Over a period of eighteen months, the $303/T
conversion cost for Forest Green Carnival Cover was
reduced to $240 (a 20% reduction) as shown in the
following table:
Interestingly, this dramatic reduction was not
seen as creating a new “standard,” but rather as just the
results were extremely encouraging to the management
team in the mill. Not all these new improvements were
being realized all the time, but the target cost mindset and
the Kaizen philosophy meant the lower numbers were
now well within reach. The new “standard” was now
lower by $1,738 ($1,162 versus $2900)—almost a 60%
reduction. This is a clear indication that, for this mill, the
concept of “attainable standard” was amenable to
continuous improvement in a dramatic way once it
incorporated a target cost framework.
24-5
Machine conversion ($520 ÷ 3 ÷ .75) 230
$820
* Students will probably use $60/T here, per case Exhibit
Pack & Ship to DC 11
TOTAL $1,162
And, the new “standard,” $1,162, was $180
below that $1342 figure that had been considered the
Using the Value Chain to Rethink
Distribution Cost (Question 5). At about this stage of
the project, it was observed that the $1,162 manufacturing
target cost was based on a $83 deduction from sales price
for costs in Montclair’s distribution center ($25 + $58,
from Exhibit 1). This was based on the current
“standard” of three inventory turns for deep colors in the
DC. It was noted that this represented an excellent
opportunity for improved inventory management. Some
reduce the normal gross margins from the range of 25 to
35% to the range of 5 to 7%. With no inventory or
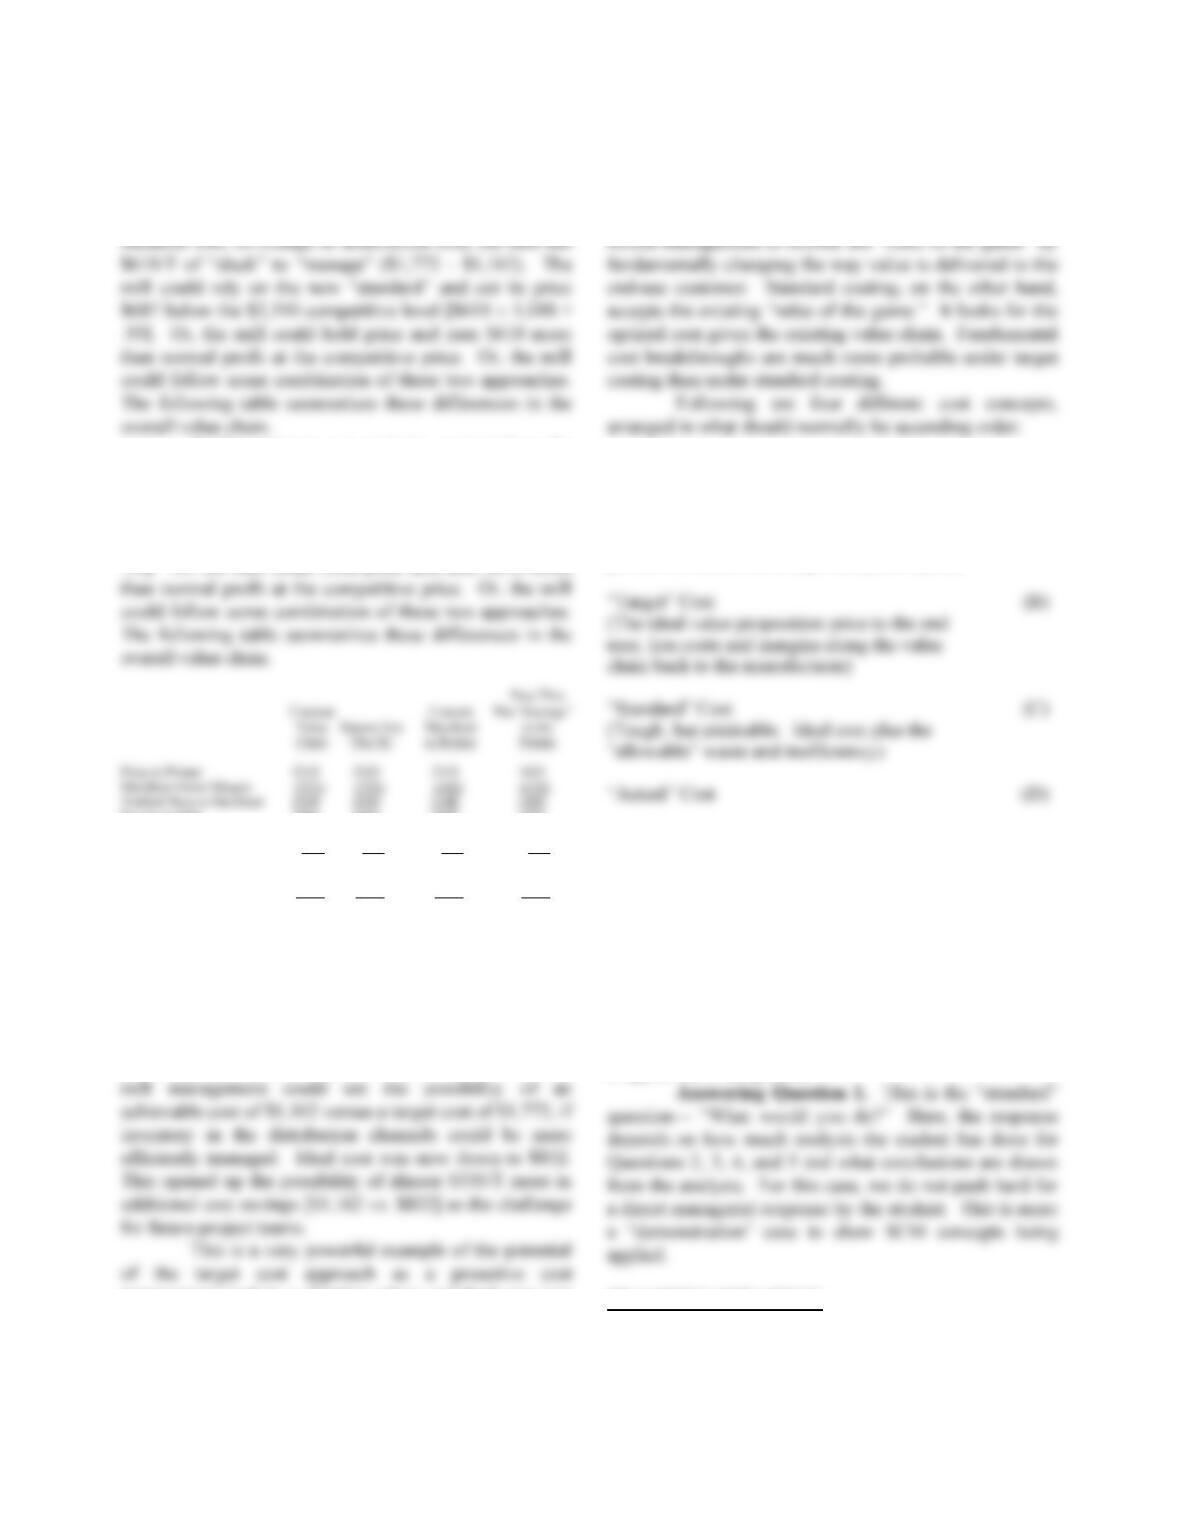
Actually, the following table shows that the
merchant should prefer mill direct versus stocking status
for items like this. They earn a much better ROA:
MONTCLAIR PAPER
Capital Paper Merchants
Assets
A/R (23 ÷ 6) = 4
Inventory (23 -5 =18 ÷ 6) = 3 ~$13M
Warehouse & Equip. = 6
P/S =
GM –OH =.5
23
=2%
S/A =
23
13
= 1.8X
24-6
Much Better Than “Stocking.”
At this point in our analysis, compared to the
At this point in our analysis, compared to the
situation with no change in distribution cost, the mill has
$610/T of “slack” to “manage” ($1,772 – $1,162). The
mill could rely on the new “standard” and cut its price
$687 below the $2,310 competitive level [$610 1,048 ÷
.93]. Or, the mill could hold price and earn $610 more
Per ton to Mill 1466 1466 2047 1437
Freight to Merchant (30) (30) (30) (30)
Return & Allowance (60) (60) (60) (60)
Net to Montclair 1376 1376 1957 1347
DC Costs (94) (65) (65) (65)
Mill Margin (120) (120) (120) (120)
Mill Mfg. Target Cost 1162 1191 1772 1162
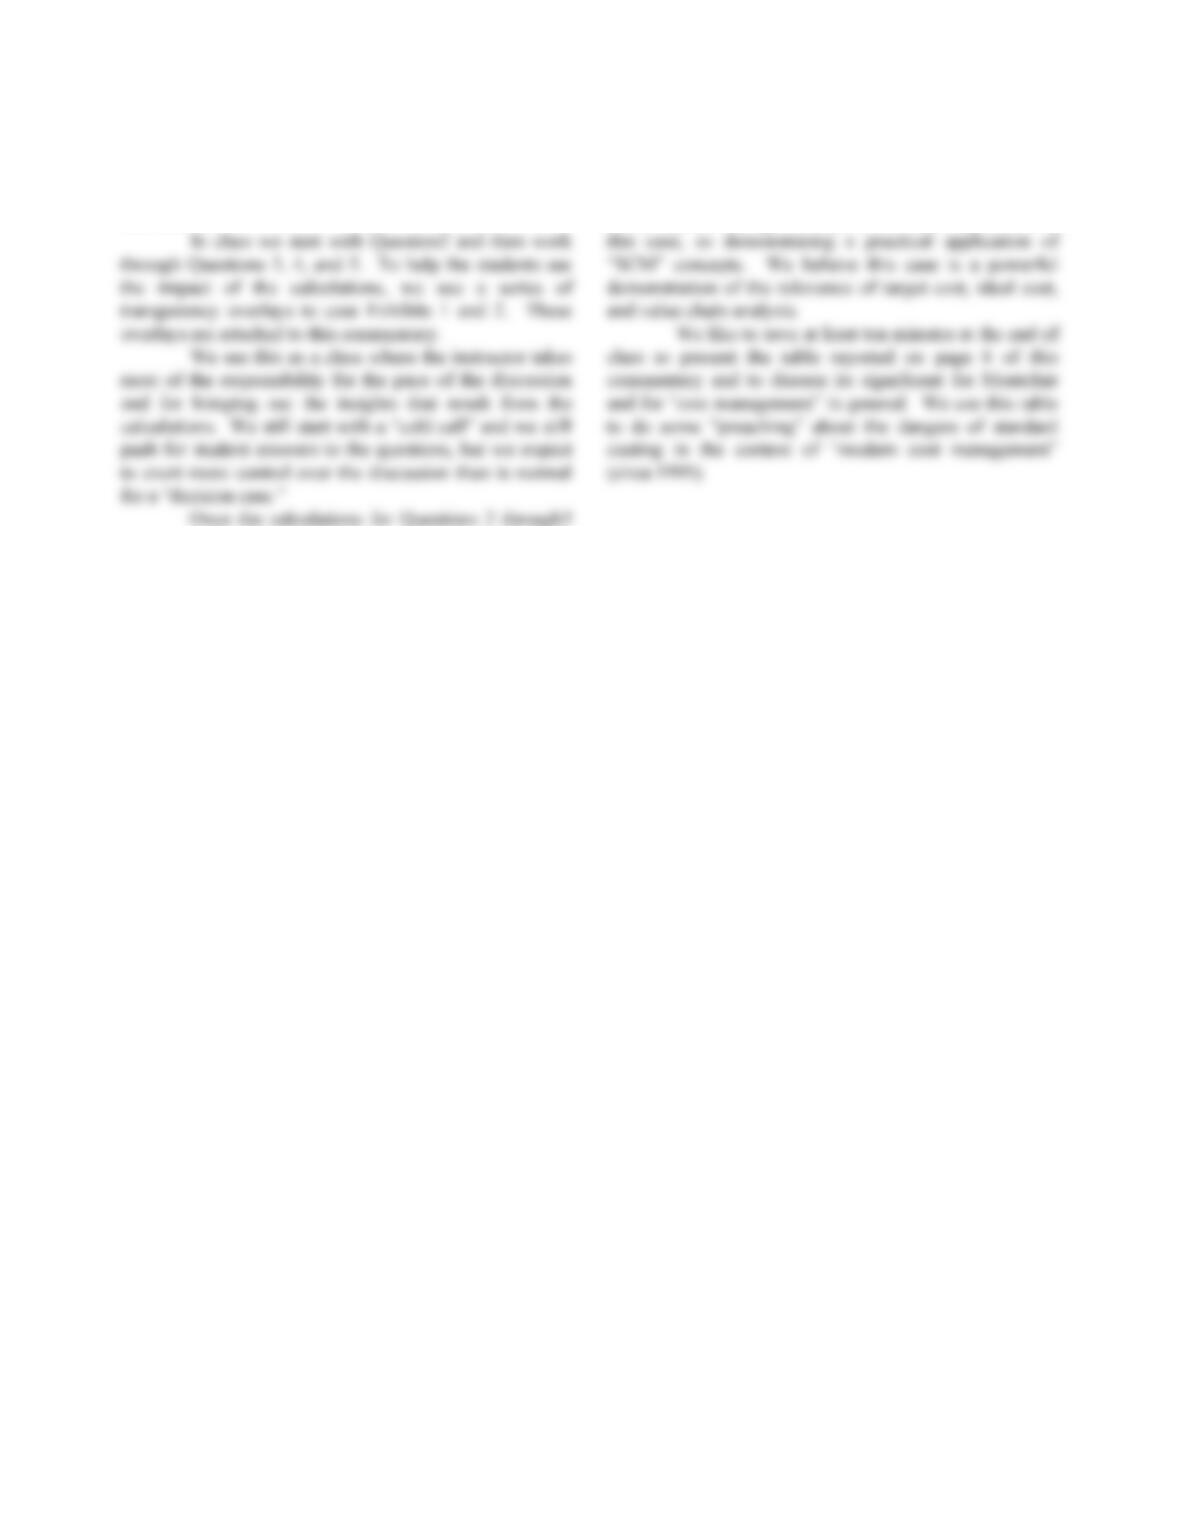
Summary of the Cost Analysis for Questions
2, 3, 4, and 5. The result of this project was a dramatic
turnaround. The project started with a standard cost of
$2,900 versus a target cost of $1,162 and an ideal cost of
$,1342—target cost $180/T lower than perfect! After
about eighteen months of price-based costing initiatives,
management tool in a situation where standard cost was
essentially useless to management. The mill management
team had no idea when the target cost project started that
the results could be so dramatic. In fact, the situation for
“deep colors” looked so bleak before the project teams
began working that the problem was seen then as more
likely a “make versus buy” choice.
The key benefit of target costing here was that it
Cost Concepts as Cost Management Tools
“Ideal” Manufacturing Cost (A)
(No waste, no scrap, no inefficiency, no delays,
perfect formulations, and perfect plant layout)
At the beginning of the project described in this
case, too much management attention was focused on (C)
vs. (D). There was heavy pressure to move (C) toward
(D) in order to minimize unfavorable variances for public
financial reporting. Too little management attention was
focused on (A), which is often dismissed as having
dysfunctional motivational impact. No attention at all
was focused on (B). At the end of the project, the most
useful cost management tool focused on (A) vs. (B), in
relation to (D). The standard cost concept (C) essentially
dropped out of the picture.
TEACHING STRATEGY
We cover this case in one ninety-minute class period. We
use the case after we have discussed standard cost
systems and after we have introduced the value chain
concept. As noted above, we see the purpose of the
24-7
discussion as reinforcement for the student on the
calculational aspects of target cost (using a value chain)
and ideal cost.
are brought out for discussion, we usually don’t have
much time left for Question 1. As noted earlier, probing
for an explicit managerial response is not as important, for
24-8
OVERLAY #1 (Question 2)
EXHIBIT 1
Value Chain for One Use of One Ton of One Uncoated, “Deep Color” Grade
Customer (Reebok – for a sales promotion brochure, 20,000 copies; 2 pieces per 23“x35” sheet; the paper came from
Ajax Paper Company’s mill in Middletown, Ohio)
Finish (10 hrs.) 1,000 65 pound uncoated cover-deep green color(1)
Paper 2,310 2,200/T÷.952 yield
Plates/Ink/Misc. 600
Total 1,989 for stocking items) Value to Mill 1,195
Margin (14%) $321 —Mill Capital Charge (120)
Mill Target Cost $1,162
Mill (Ajax Paper Company)
Per Ton Basis
(1) For this job, the customer chose $2,200/T paper made by Ajax Paper Co. for which the merchant pays $1,466/T. For
24-9
OVERLAY #2 (Question 3)
EXHIBIT 2
Standard Cost
Sixty-Five-Pound Carnival Cover (Uncoated) – Forest Green Color – Sheets Pack
Fiber
% Mix Market Price
IDEAL
Paper Machine (Yield = 46%) COST
Converting (Yield = 88%)
Manufacturing Cost Summary (Yielded)
Overall Cost Summary
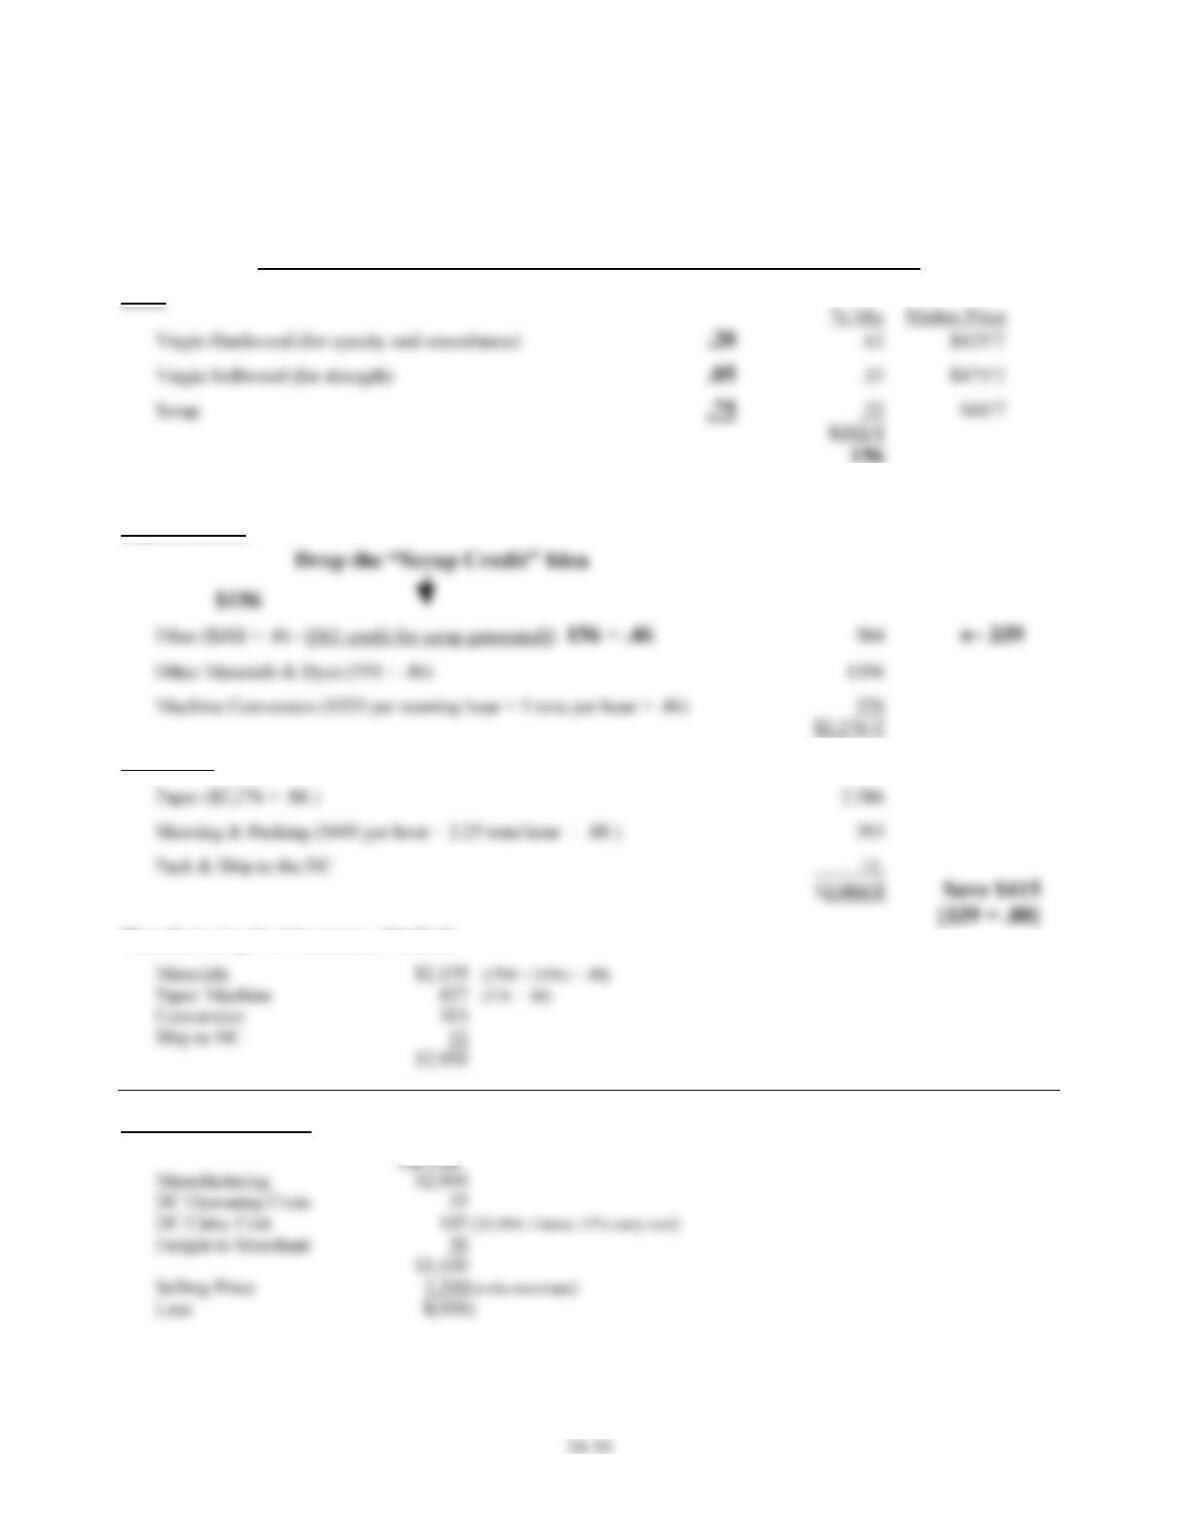
OVERLAY #3
1. FIBER MIX
EXHIBIT 2
Standard Cost
Sixty-Five-Pound Carnival Cover (Uncoated) – Forest Green Color – Sheets Pack
Fiber
156
Paper Machine (Yield = 46%)
Converting (Yield = 88%)
Manufacturing Cost Summary (Yielded)
Overall Cost Summary
24–11
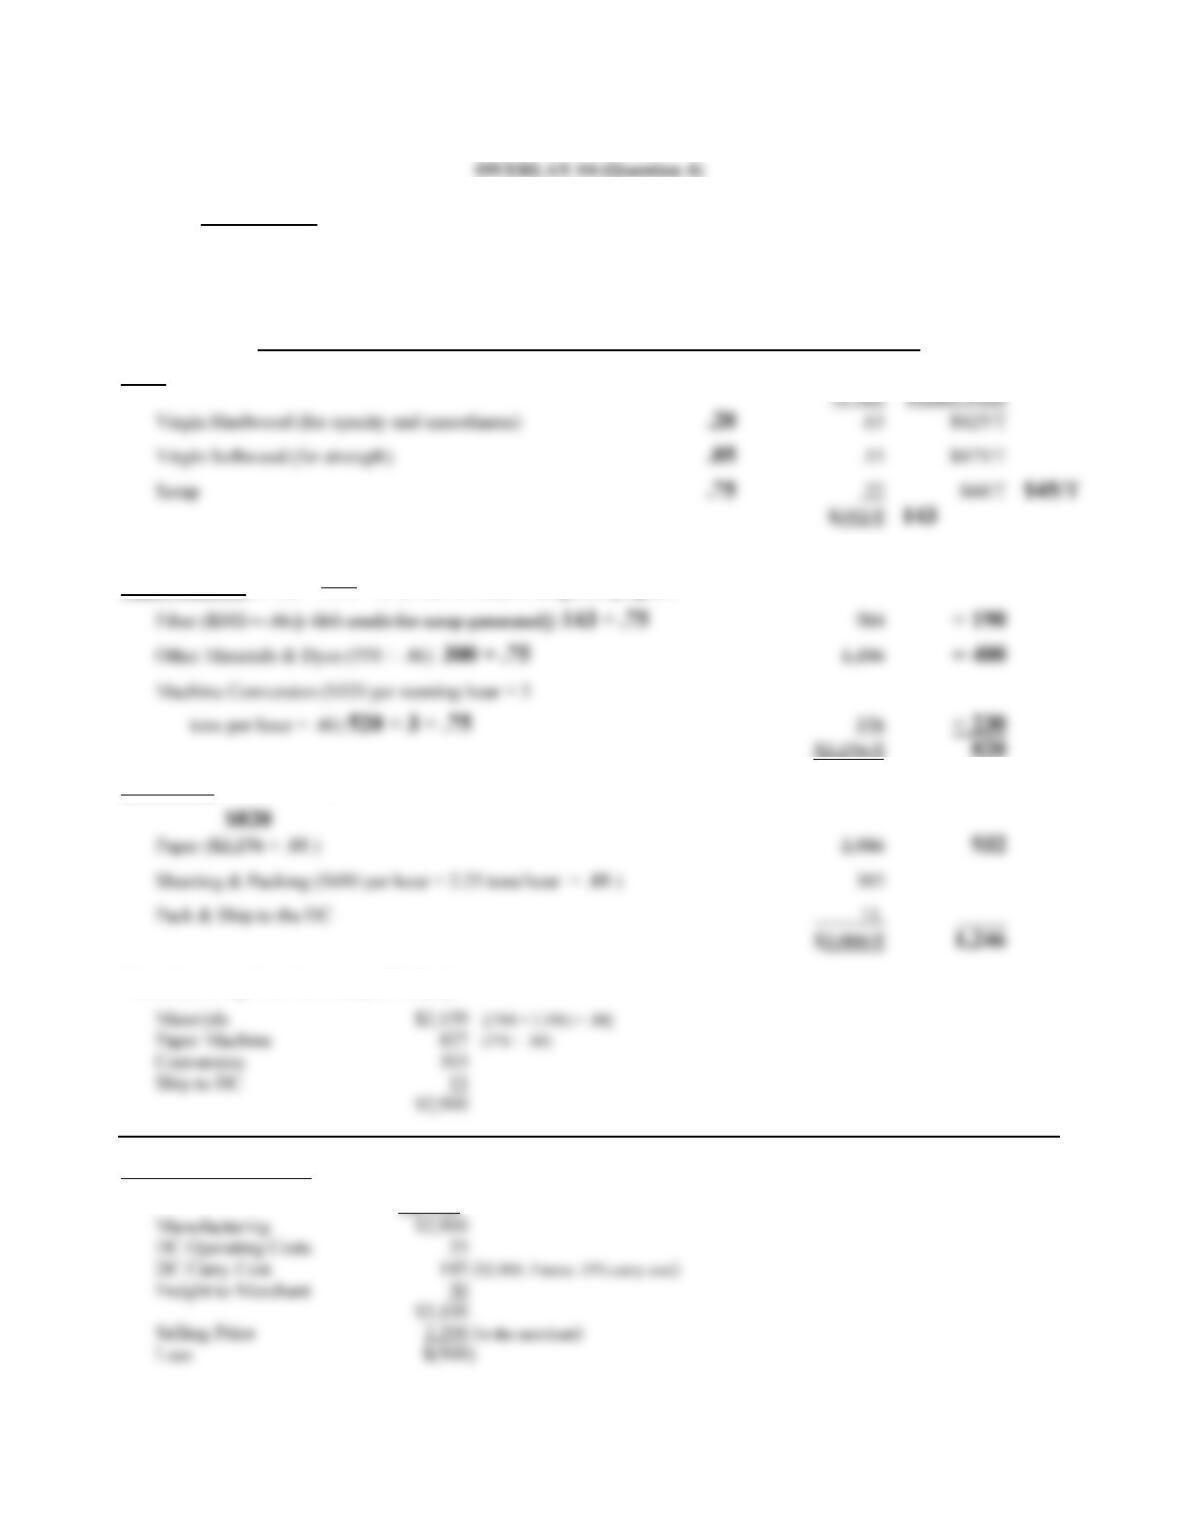
2. USE COLORED SCRAP Reduce time to get “on shade” from
two hours to forty minutes
EXHIBIT 2
Standard Cost
Sixty-Five-Pound Carnival Cover (Uncoated) – Forest Green Color – Sheets Pack
Fiber
Paper Machine (Yield = 46% 75% for 2 hours of good paper)
Converting (Yield = 88%)
Manufacturing Cost Summary (Yielded)
Overall Cost Summary
Per Ton
24–12
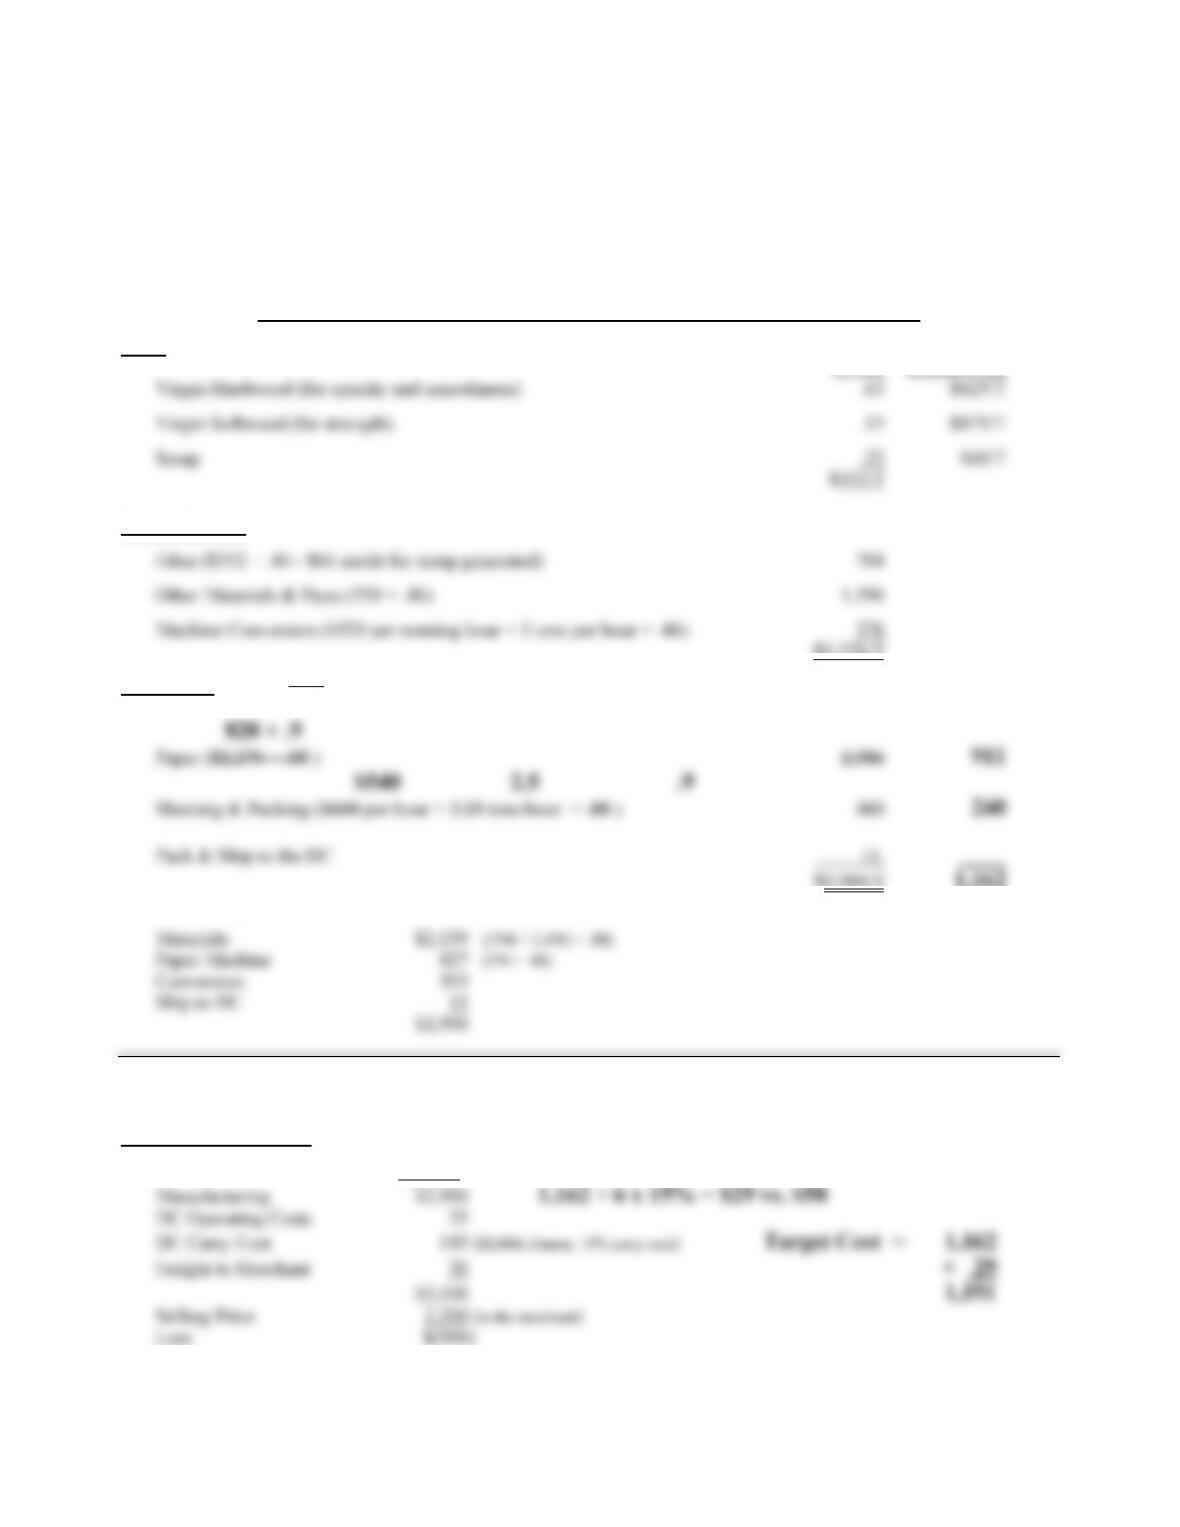
OVERLAY #5
3. CONVERTING COST
EXHIBIT 2
Standard Cost
Sixty-Five–Pound Carnival Cover (Uncoated) – Forest Green Color – Sheets Pack
Fiber
% Mix Market Price
Paper Machine (Yield = 46%)
$2,276/T
Converting (Yield = 88%) .9
$2,900/T 1,162
Manufacturing Cost Summary (Yielded)
4. INVENTORY MANAGEMENT
Overall Cost Summary
Per Ton
OVERLAY #6
EXHIBIT 2
Standard Cost
Sixty-Five-Pound Carnival Cover (Uncoated) – Forest Green Color – Sheets Pack
Fiber
% Mix Market Price
Virgin Hardwood (for opacity and smoothness) .63 $425/T
Paper Machine (Yield = 46%) IDEAL
$2,276/T
Converting (Yield = 88%)
Manufacturing Cost Summary (Yielded)
Materials $2,159 [(704 + 1,196) ÷ .88]
Overall Cost Summary
Per Ton