Unitron Corporation
Teaching Commentary
OVERVIEW
This is an excellent short case to introduce the managerial accounting issues related to the “joint cost” problem. Classic
microeconomics argues unequivocally that attempts to assign cost to individual products in a “joint” set constitute a
complete waste of time—”just maximize the total revenue over the batch.” Like the comparable adage to “price so that
marginal cost equals marginal revenue,” the economists’ advice about joint costing is certainly accurate, given the
TEACHING STRATEGY
We teach the case in one (ninety minute) class period early in the required managerial accounting course. Questions 1
through 5 will easily fill one class period with useful discussion. We push hard to cover these questions in about
seventy-five minutes so that we can also spend some time on Question 6. This last question raises strategic positioning
ANSWERS TO ASSIGNMENT QUESTIONS
Question 1
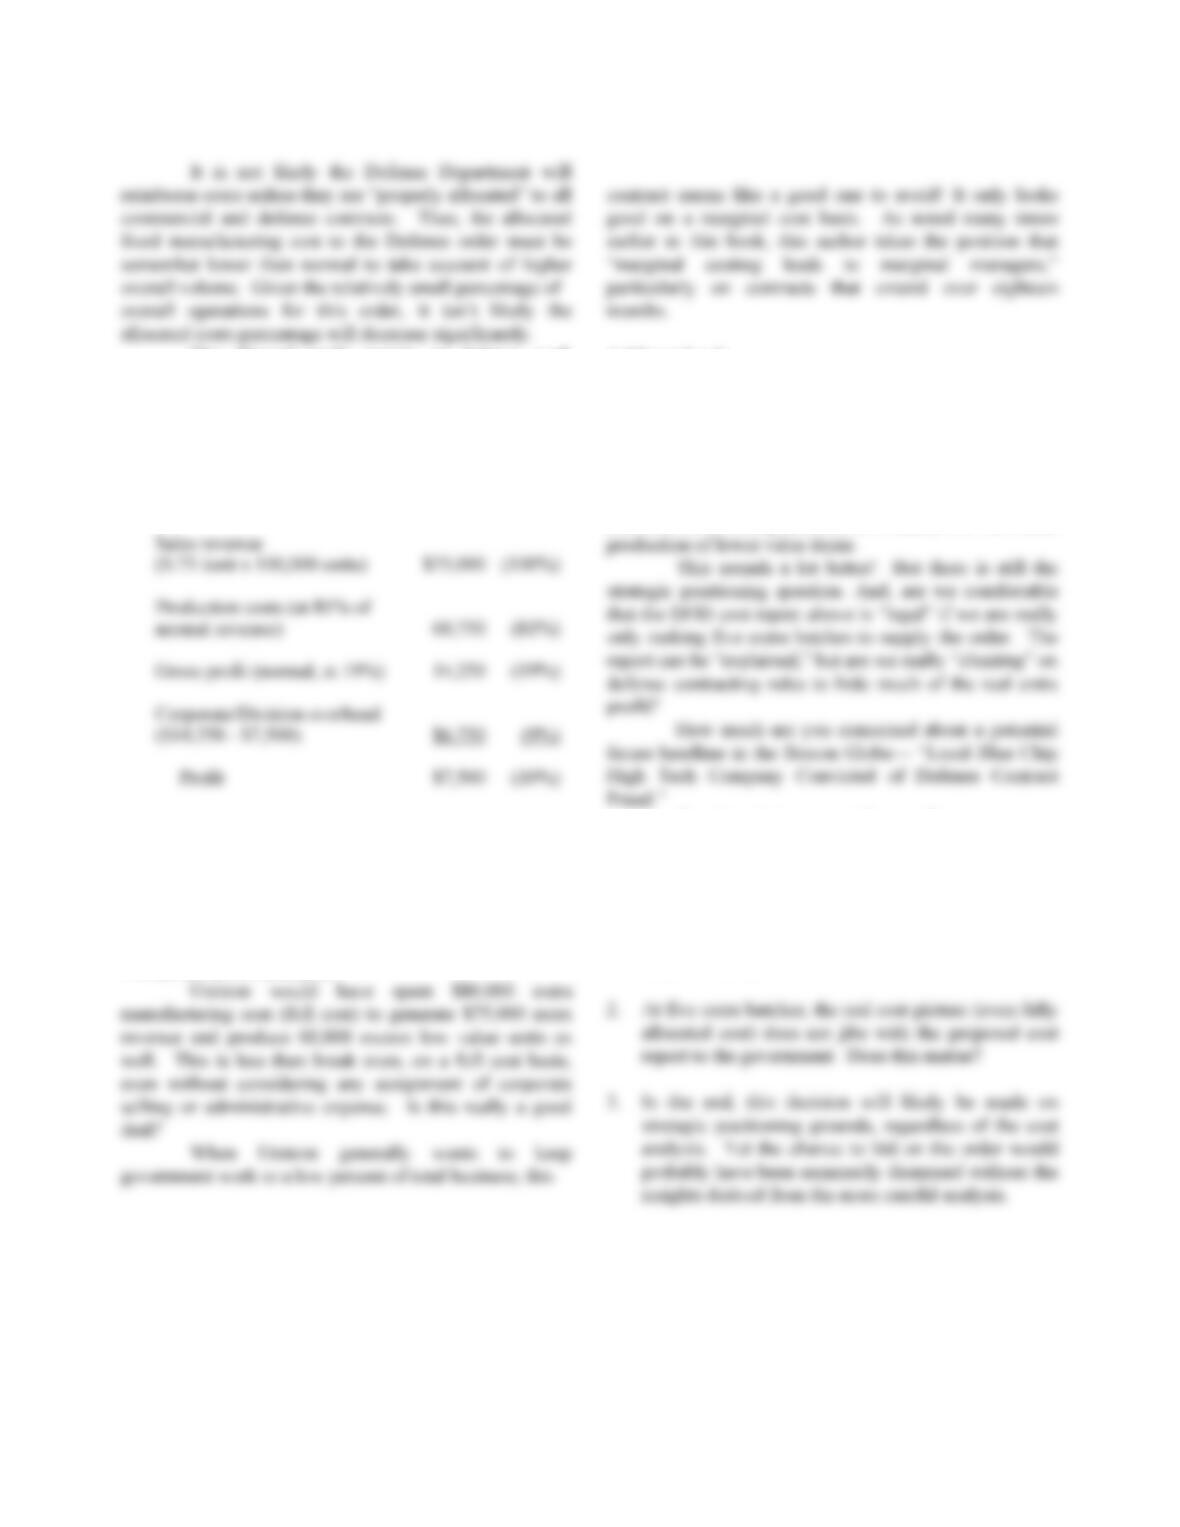
The idea here is to construct a “Produced As/Sold As Matrix” (400,000 400,000). Obviously, the possible
combinations are endless, so how does one choose a “best” approach? The “best” solution is to start with demand for the
highest value product (405) and work back unsold production to the next lowest value product (404) to fill sales demand
and so forth until 401 sales demand is filled (see Exhibit A).
The idea is to minimize potential revenue loss. In a static sense [$246,000 Revenue], any tableau is as good as
34-2
Question 2
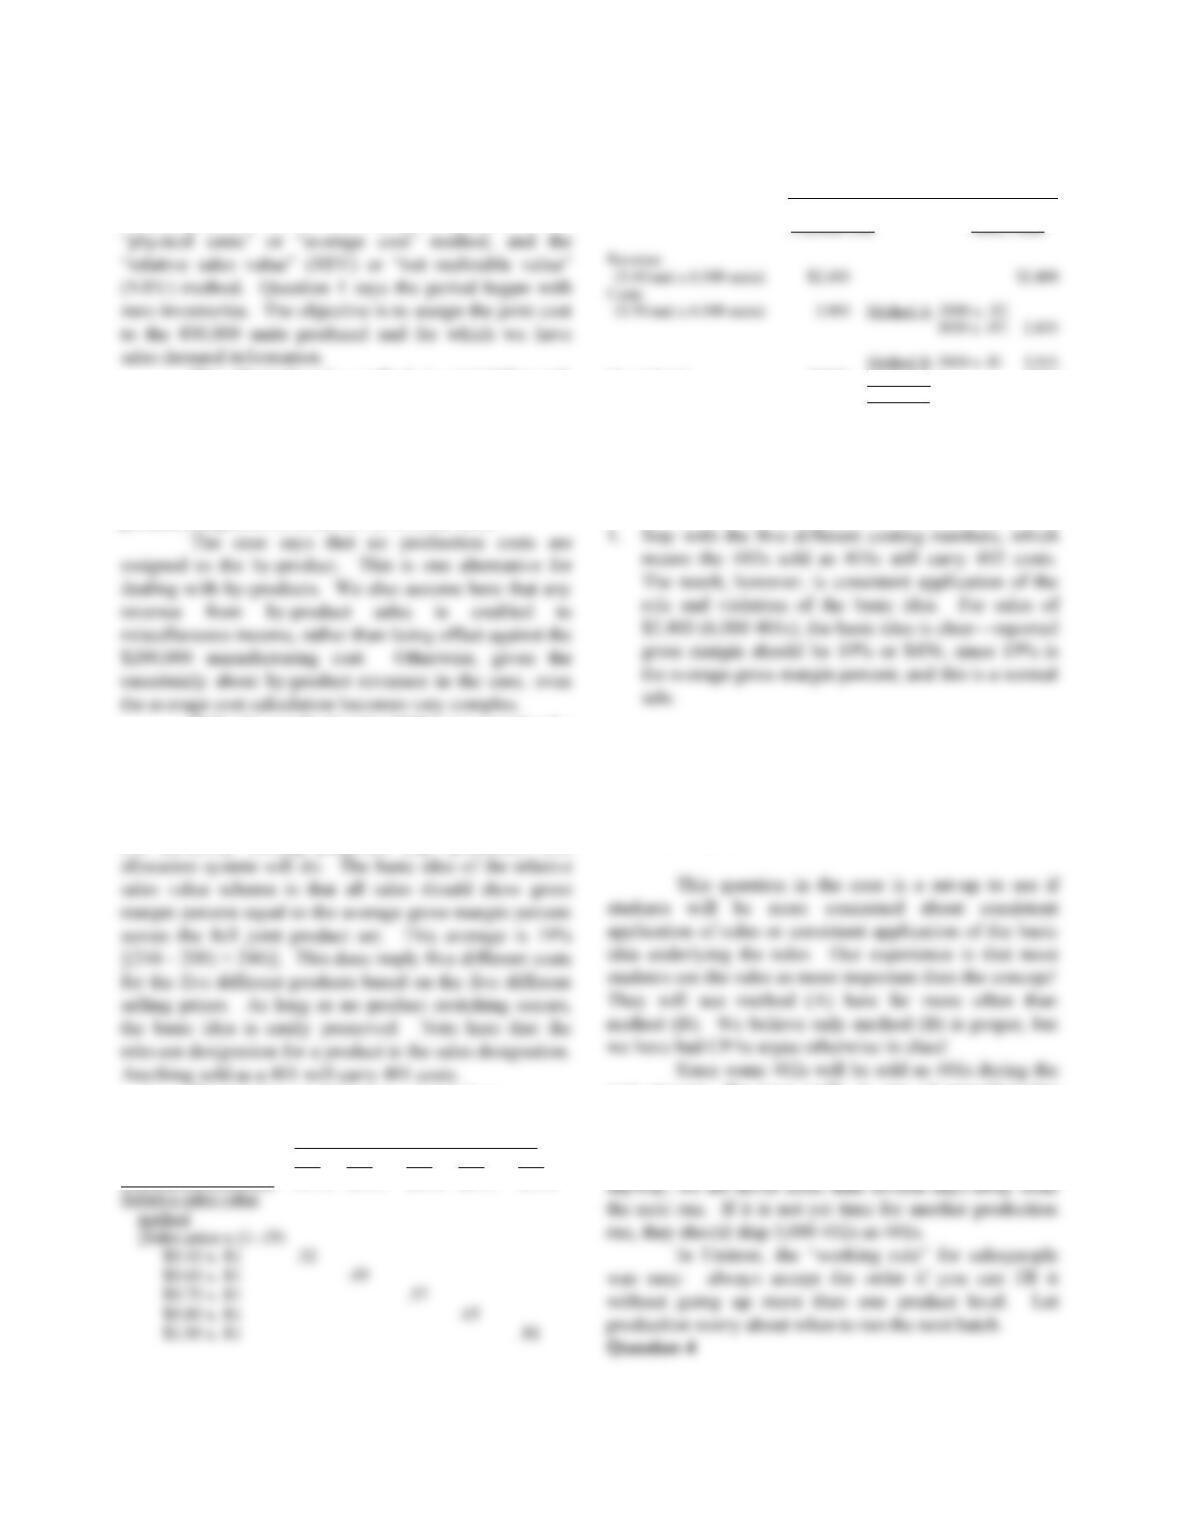
There are two basic accounting methods for
allocating joint cost to the five joint products: the
The physical units method is straightforward:
joint cost of $200,000 divided by 400,000 total units
produced = $0.50 per unit. All rectifiers are assigned
identical unit costs. Since sales prices increase with
increasing technical attributes across the five categories,
gross margins will also increase from the low to high end
products (negative 25% for 401 to 50% for 405).
If the “by–product” units (400s) are considered a
joint product, the average cost is $.40 per unit ($200,000
÷ 500,000 units).
The RSV method has a number of twists that can
result in many different unit costs for the five products.
For inventory costing purposes, any systematic cost
Here are the resulting unit cost numbers:
Unit Costs
401 402 403 404 405
Physical units method $0.50 $0.50 $0.50 $0.50 $0.50
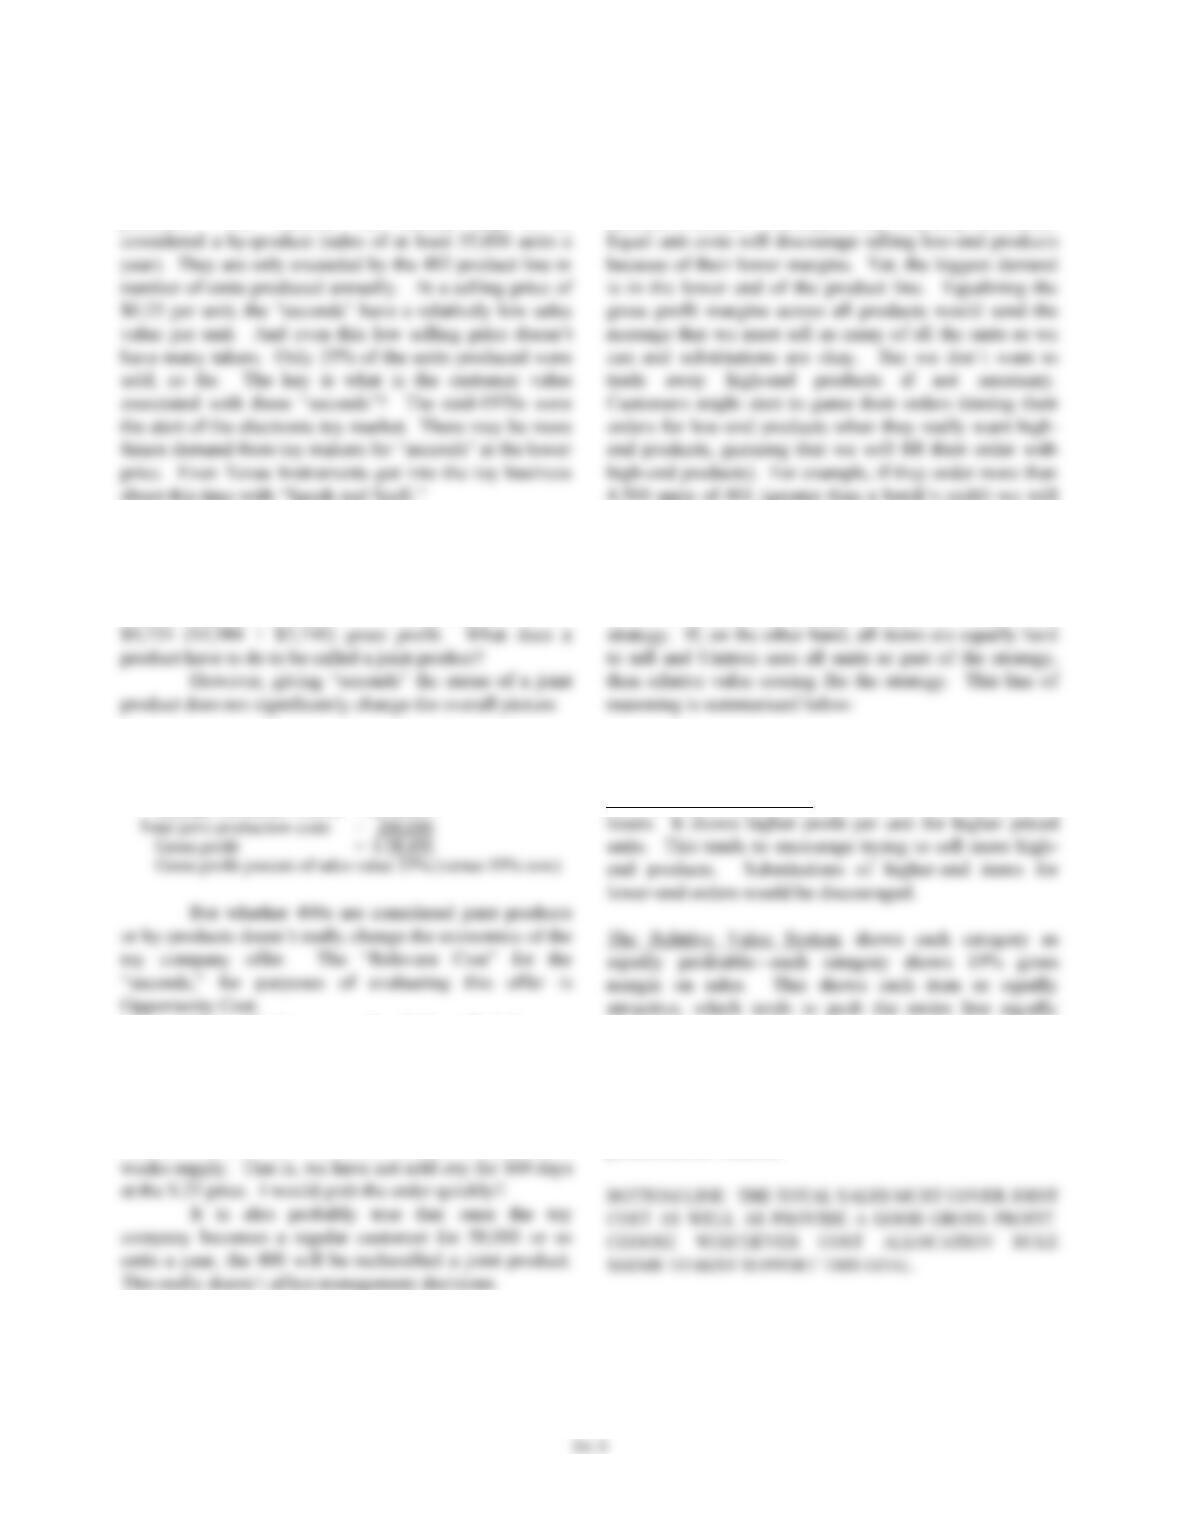
Question 3
Costing Method
Relative
Physical Unit Sales Value
Gross Margin $(600) Method A: $(30)
Method B: $456
A problem arises under RSV costing when there
is product switching (402s sold as 401s). Now, there is a
choice:
2. In order to achieve the desired result (gross margin of
$456), it is necessary to consider all 6,000 of the
items shipped to be 401s. This means violating the
costing rule. Use a 401 cost, not a 402 cost, for the
402s shipped as 401s.
year anyway, the issue really is one of manufacturing
scheduling! Is it time to produce another batch, or not?
What level of inventory triggers the production decision?
Since we average one new batch every 2 1/2 weeks
The toy company may be forcing Unitron to
change its long-term view on joint products and by–
products. The “seconds” are already large to be
about this time with “Speak and Spell.”
At the even lower selling price of $.15 per unit,
the Toy Company’s 48,000 “seconds” will generate
$7,200 incremental revenue and gross profit. Based on
RSV, 401s generate only $7,480 gross profit annually.
Even the high-tech 404s and 405s combined generate only
Assume 83,000 units sold
at $.15/unit, sales value = $12,450 (35,000+48,000)
Total joint products sales
revenue=$246,000+12,450 = $258,450
If I sell them now for $.15, will I lose an
opportunity to sell them later for enough more than $.15
to make up for the time value of the foregone cash
inflow?
Annual output is 100,000 units and inventory on
hand is 65,000. This is thirteen batches, or thirty-two+
Question 5
There is no simple answer to the “proper”
allocation method. The impact may be purely behavioral.
4,500 units of 401 (greater than a batch’s yield) we will
not likely have a sufficient quantity on hand and will ship
some 402 units.
If Unitron’s strategy is to push high-end items,
with the low end as just fillers, and if the high-end items
are harder to sell, then average costing better matches the
Behavioral Implications?
The Average Cost System shows low-end items (401) as
hard. Planned-for substitutions are also equally profitable
so they are encouraged. The sales view is always sell
downward one level if necessary. It is up to production
scheduling to replenish the inventory at the right time.
Which set of likely behavioral consequences is
preferable for Unitron?
34-4
Question 6
At the simplest level, selling an additional
100,000 404’s involves producing thirty-four additional
batches (3,000 404s per batch)—a highly unlikely
Obviously, the more extra batches we are
required to produce for this order, the less attractive it
looks. The fewer extra batches, the better it looks. We
can use the matrix tableau from Question 1 to
40,000 unit demand for 403s now being met with 404s.
Twelve more batches yields the 60,000 extra 404s and
405s, and 54,000 more 403s as well. This is more than
enough 403s to replace the 40,000 404s that would now
batches still costs us almost $80,000 extra ($6,400 x 12 =
$76,800). But can we get the production requirement
down even further?
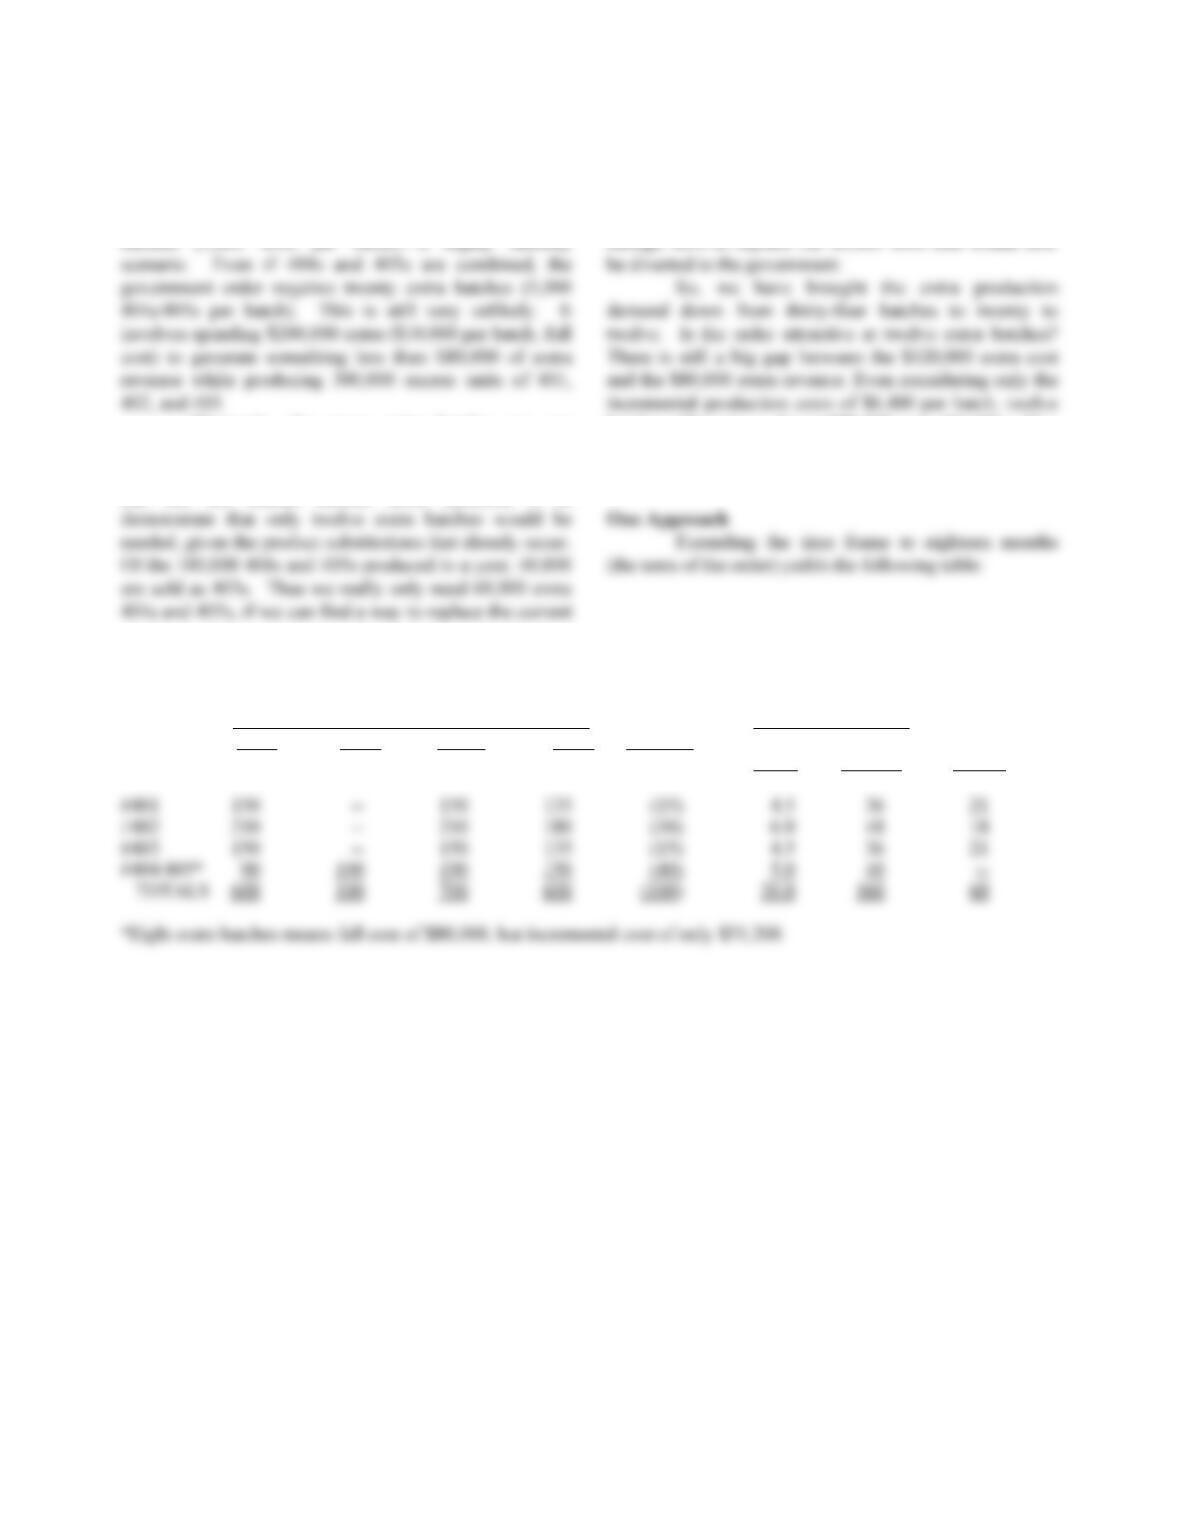
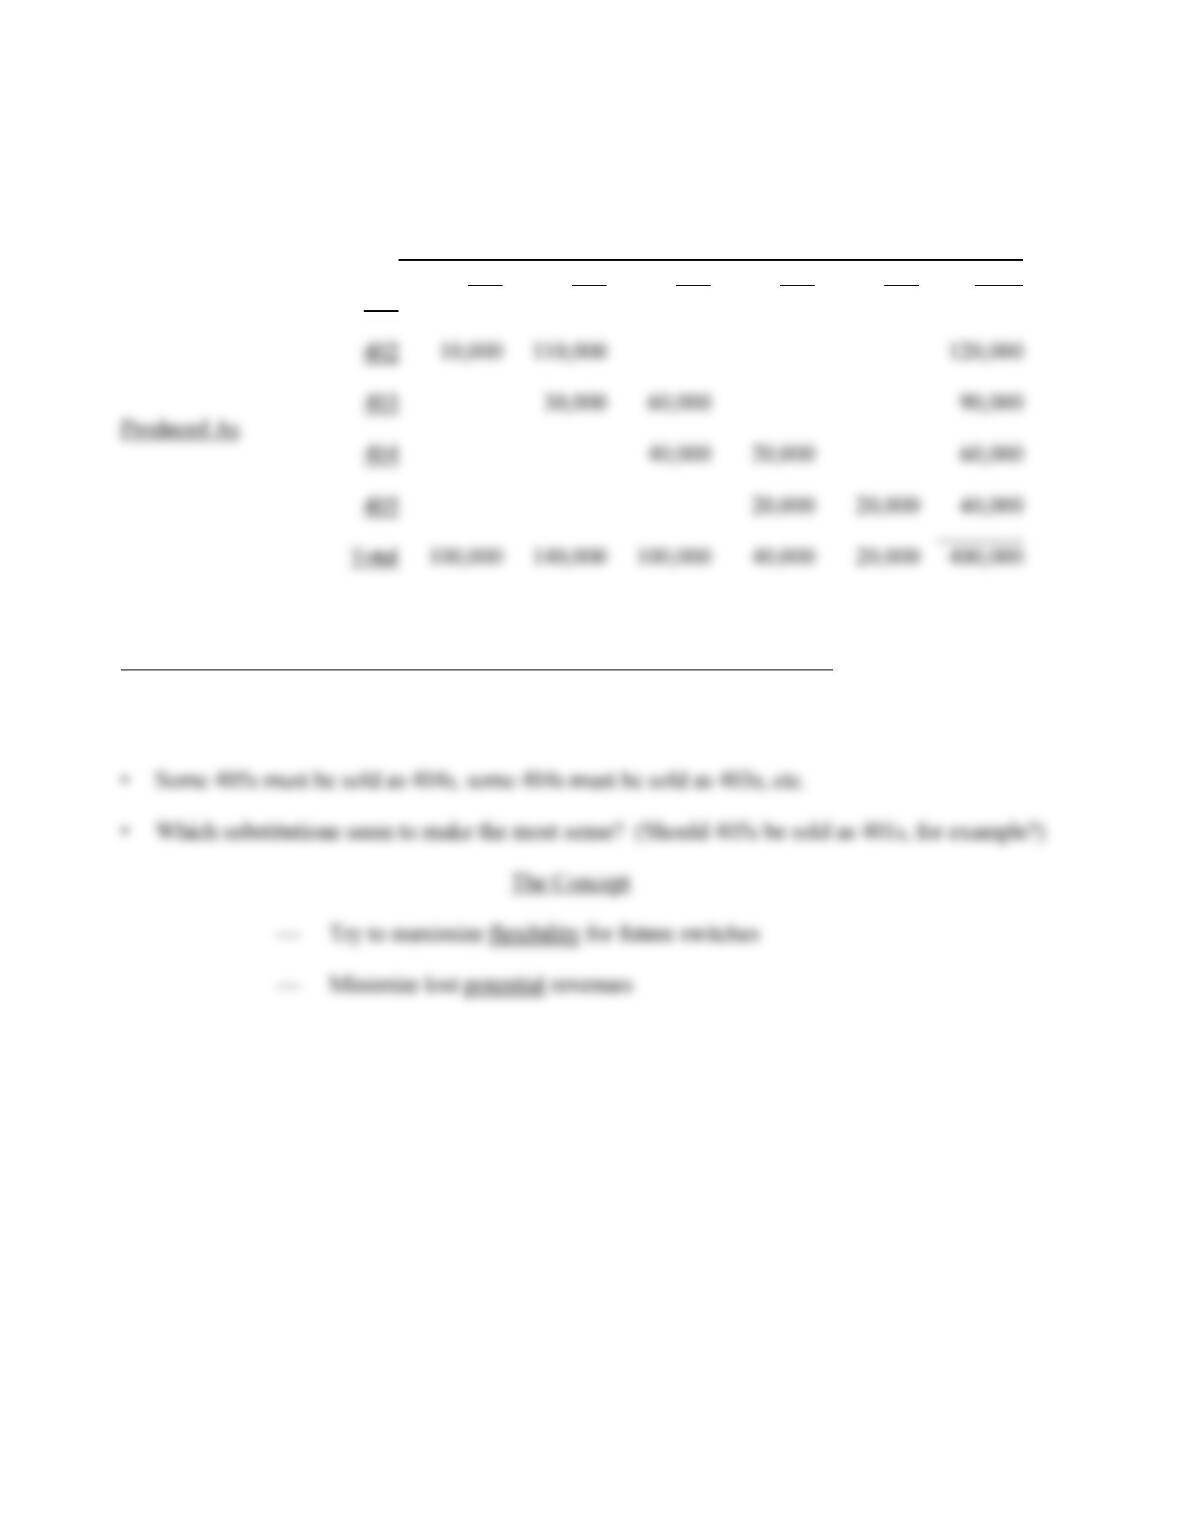
18 Months (30 Batches) Extra Output*
Sales DOD Needs Prod. Shortfall Per Eight more Units
(All Amounts in Thousands) Batch Batches Excess
34-5
The allowed profit margin on defense work
varies between 8% and 10%. Assuming a $.75
discounted price with a 10% allowed margin, we can
estimate what the cost report to the government would
have to look like:
Total revenue of $75,000 and allowable profit of
$7,500 means total cost cannot exceed $67,500:
Assuming a 9% charge for all nonmanufacturing
costs was “reasonable,” this “cost plus” bid proposal
would probably survive the government audit review.
Since Unitron spends far more than 9% of sales on total
nonmanufacturing costs, it would be easy to justify the
9% allocation as reasonable.
A Closer Look
As Exhibit B to this note shows, it is possible to
meet the extra demand with only five extra batches if we
extend the horizon over a 2 ¼-year time frame. This
means extra production cost of only $32,000 (on a
variable cost basis) and $50,000 (at full cost). At a
$75,000 bid, with the DOD cost report as shown above,
this is $25,000 extra profit (full-cost basis) with no excess
Question 6 is very rich, as this commentary
reveals. We like to spend at least fifteen minutes of class
time here to demonstrate the following:
1. Careful analysis can make the problem look much
different (need for thirty-four extra batches versus
only five extra).
34-6
Exhibit A
Produced As/Sold As Matrix
Sold As
401 402 403 404 405 Total
401 90,000 90,000
Work from the highest value products backward to the lowest value products.
• Note that sales demand and estimated production quantities do not match for individual products.
Exhibit B
(Thousands of Units)
Now-2 1/4 Years
(forty-five Batches) Make five Extra Batches
401
Prod.
202.5
202.5
22.5
225
Ext ra
22.5
Tot al
Prod.
225
225
}
Sell Sell
Batches
Now Revised
Year 1 20 30
Strategic Fit?