CA 24-8 (Continued)
2. The company’s revenue and expenses would be reported as follows on its quarterly report
prepared for the first quarter of the 2012–2013 fiscal year:
Sales revenue ………………………………………………………………………………. $60,000,000
Cost of goods sold ………………………………………………………………………… 36,000,000
(b) The financial information to be disclosed to its stockholders in its quarterly reports as a minimum
include:
1. Sales revenue or gross revenues, provision for income taxes, extraordinary items (including
tax effects), and net income.
2. Basic and diluted earnings per share.
CA 24-9
(a) Acceptable. The use of estimated gross profit rates to determine the cost of goods sold is accept–
able for interim reporting purposes as long as the method and rates utilized are reasonable. The
company should disclose the method employed and any significant adjustments which result
from reconciliations with annual physical inventory.
(d) Not acceptable. Gains on the sale of investments would not be deferred if they occurred at year-
end. Consequently, they should not be deferred to future interim periods but should be reported
in the quarter the gain was realized.
24–42
CA 24-9 (Continued)
(e) Acceptable. The annual audit fee is an expense which benefits the company’s entire year. Com–
panies are encouraged to make quarterly estimates of these items that usually result in year-end
adjustments. Therefore, this expense can be prorated over the four quarters.
CA 24-10
(a) Arguments for requiring published forecasts:
1. Investment decisions are based on future expectations; therefore, information about the
future would facilitate better decisions.
(b) The purpose of a safe harbor rule is to provide protection to an enterprise that presents an
erroneous projection as long as the projections were prepared on a reasonable basis and were
disclosed in good faith. An enterprise’s concern with the safe harbor rule is that a jury’s definition
of reasonable might be at some variance from a company’s or, for that matter, the SEC’s.
(c) An enterprise’s concerns about preparing a forecast are as follows:
1. No one can foretell the future. Therefore forecasts, while conveying an impression of precision
about the future, will inevitably be wrong.
CA 24-11
(a) The controller notes that the financial vice president is misrepresenting the financial condition of
the company by suggesting that the company has become more efficient when, in fact, the
improved ratio is gained through manipulation of estimates. The controller, however, hesitates
24–43
CA 24-11 (Continued)
(d) The controller is responsible for both the accuracy and the clarity of financial reporting. If the media
CA 24-12
(a) The ethical issues involved are profitability, long-term versus short-term performance, and integrity
of financial reporting.
*CA 24-13
24–44
FINANCIAL REPORTING PROBLEM
(a) Proctor & Gamble (P&G) commented on the following items in its note
on accounting policies:
Nature of operations Cash equivalents
Basis of presentation Investments
(b) P&G reported information for the following segments:
1. Beauty
2. Grooming
3. Health care
(c) In Note 13, P&G reported quarterly information for net sales, operating
income, gross margin, net earnings, and diluted net earnings per
common share.
24–45
COMPARATIVE ANALYSIS CASE
THE COCA-COLA COMPANY VERSUS PEPSICO, INC.
(a) 1. Coca-Cola commented on the following list of items in its note on
accounting policies:
The Coca-Cola Company and Subsidiaries (Note 1)
• Basis of Presentation
• Principles of Consolidation
• Risks and Uncertainties
• Trade Accounts Receivable
• Inventories
• Derivative Instruments
• Property, Plant and Equipment
• Goodwill, Trademarks and Other Intangible Assets
• Contingencies
2. PepsiCo commented on the following list of items in its note on
accounting policies:
PepsiCo, Inc. and Subsidiaries
24–46
COMPARATIVE ANALYSIS CASE (Continued)
Cash Equivalents
Software Costs
Commitments and Contingencies
Research and Development
Other Significant Accounting Policies
(b) Coca–Cola divided its operations into seven operating segments:
(1) Eurasia and Africa, (2) Europe, (3) Latin America, (4) North America,
(5) Pacific, (6) Bottling Investments, and (7) Corporate. PepsiCo divided its
(c) Coca–Cola’s independent auditors are Ernst & Young LLP, while PepsiCo’s
independent auditors are KPMG LLP.
Coca-Cola’s audit report expresses an opinion on the financial
statements and in a fifth paragraph refers to a separate report the
expressed an opinion on the internal controls. Coca-Cola also has a
fourth paragraph which indicates that it changed its method of
accounting for uncertainty in income taxes.
24–47
*FINANCIAL STATEMENT ANALYSIS CASE
RNA INC.
(a) The calculation of selected financial ratios for RNA for the fiscal year
2013 is as follows:
=
1.57
Acid-test ratio
=
Short-term Net
Cash + Investments + receivables
Current liabilities
=
$3,900
$6,300
=
.62
Times interest earned
=
Income before interest and taxes
=
$7,060 + $900
=
8.84
Profit margin on sales
=
Net income
Net sales
=
$4,260
=
13.97%
Current ratio
=
Current liabilities
24–48
*FINANCIAL STATEMENT ANALYSIS CASE (Continued)
Asset turnover
=
Net sales
Average total assets
=
$30,500
($17,000 + $16,000) ÷ 2
=
1.85 times
(b) The analytical use of each of the six ratios presented above and what
investors can learn about RNA’s financial stability and operating
efficiency are presented below.
Acid-test ratio
• Measures the ability to meet short-term debt using the most liquid
assets.
Inventory turnover
=
=
$17,600
=
3.09 times
24–49
*FINANCIAL STATEMENT ANALYSIS CASE (Continued)
Times interest earned
• Measures the ability to meet interest commitments from current
earnings. The higher the ratio, the more safety for long-term creditors.
Profit margin on sales
• Measures the net income generated by each dollar of sales. It pro–
vides some indication of the ability to absorb cost increases or sales
declines.
Total asset turnover
• Measures the efficiency of resource use; i.e., the ability to generate
sales through the use of assets.
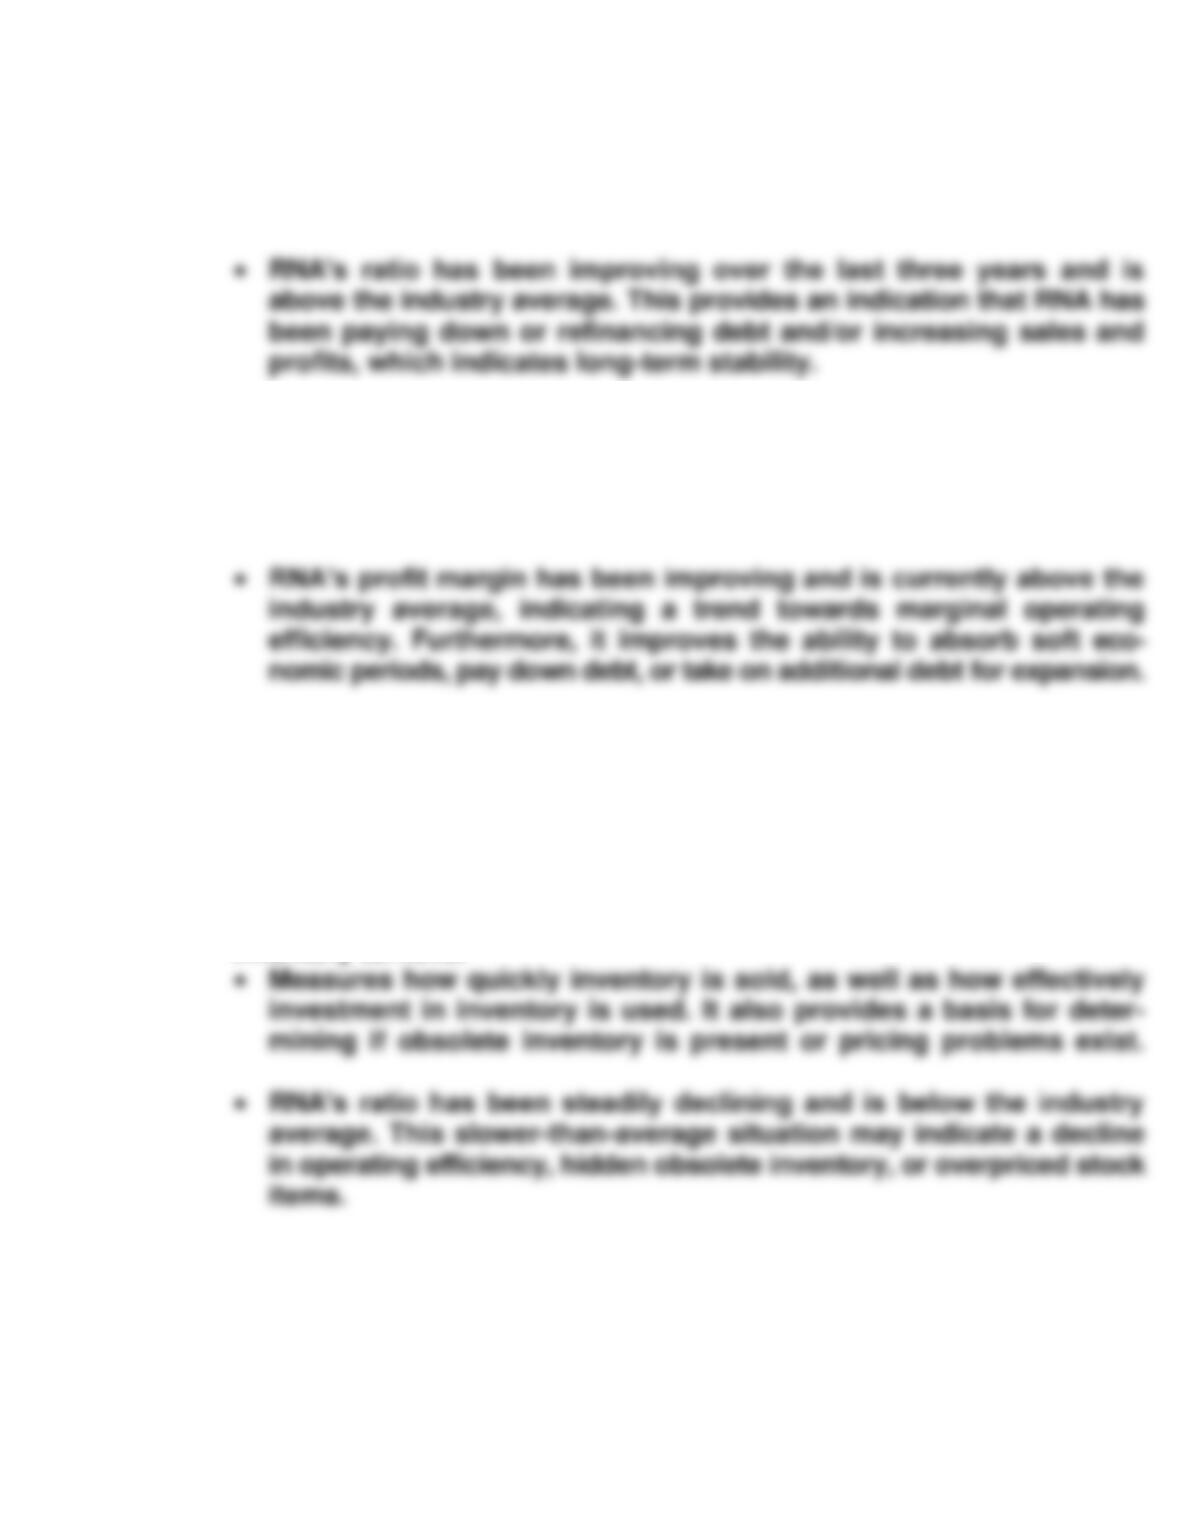
• RNA’s ratio has been steadily improving and is above the industry
average, indicating good use of assets and ability to generate sales.
Inventory turnover

24–50
*FINANCIAL STATEMENT ANALYSIS CASE (Continued)
(c) Limitations of ratio analysis include:
• The fact that no one ratio is conclusive.
ACCOUNTING, ANALYSIS, AND PRINCIPLES
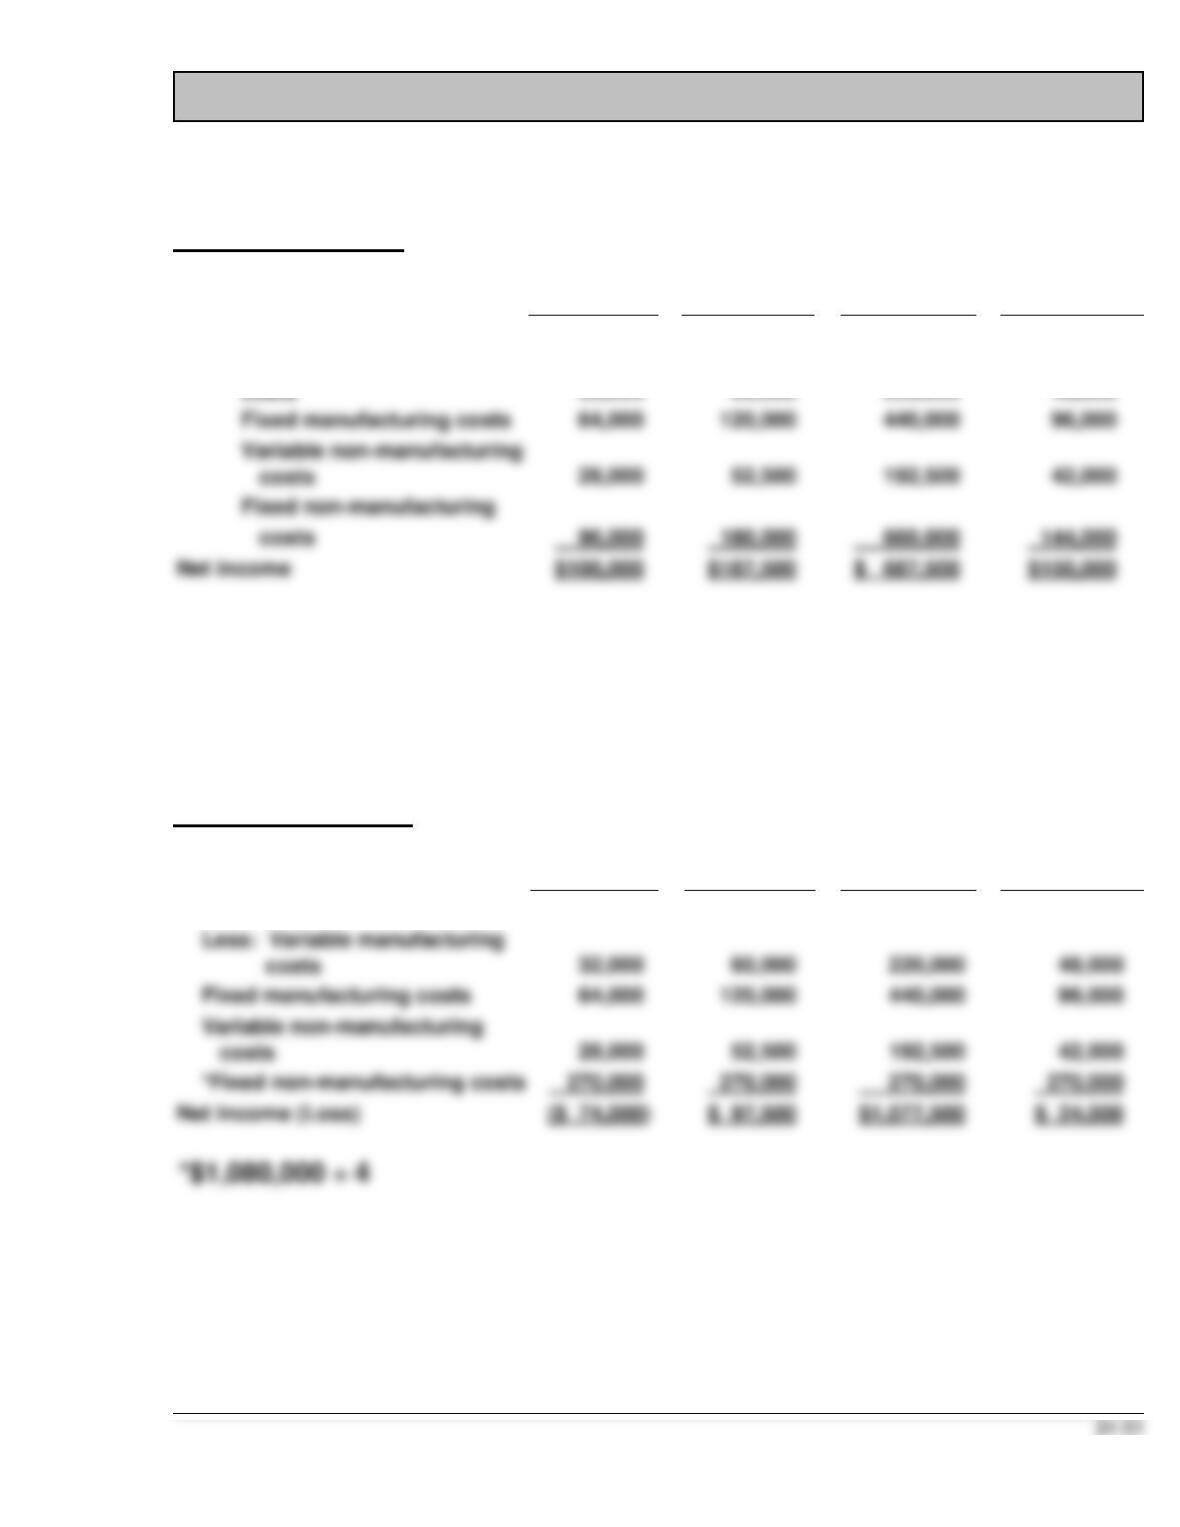
Accounting
Integral Approach
1st Quarter
2nd Quarter
3rd Quarter
4th Quarter
Sales
$320,000
$600,000
$2,200,000
$480,000
Fixed manufacturing costs
Net income
$ 687,500
Less: Variable manufacturing
32,000
60,000
220,000
48,000
Sales = (Number of units X $4.00)
Variable manufacturing costs = (Number of units X $0.40)
Variable non-manufacturing costs = (Number of units X $0.35)
Fixed manufacturing costs = Number of units X ($720,000 ÷ 900,000)
Fixed non-manufacturing costs = Number of units X ($1,080,000 ÷ 900,000)
Discrete Approach
1st Quarter
2nd Quarter
3rd Quarter
4th Quarter
Sales
$320,000
$600,000
$2,200,000
$480,000
Fixed manufacturing costs
120,000
*Fixed non-manufacturing costs
270,000
270,000
Net income (Loss)