400 ❖ Chapter 22/The Short-Run Trade-off between Inflation and Unemployment
d. From 2007 to 2009, as the decline in aggregate demand raised unemployment, it also
reduced the inflation rate from about 3 percent to about 1 percent.
e. From 2010 to 2012, unemployment fell and the inflation rate rose from about 1 percent
to about 2 percent.
f. In essence, the economy first rode down the Phillips curve and then rode back up.
g. Note that expected inflation and the position of the short-run Phillips curve were
relatively stable during this period.
SOLUTIONS TO TEXT PROBLEMS:
Quick Quizzes
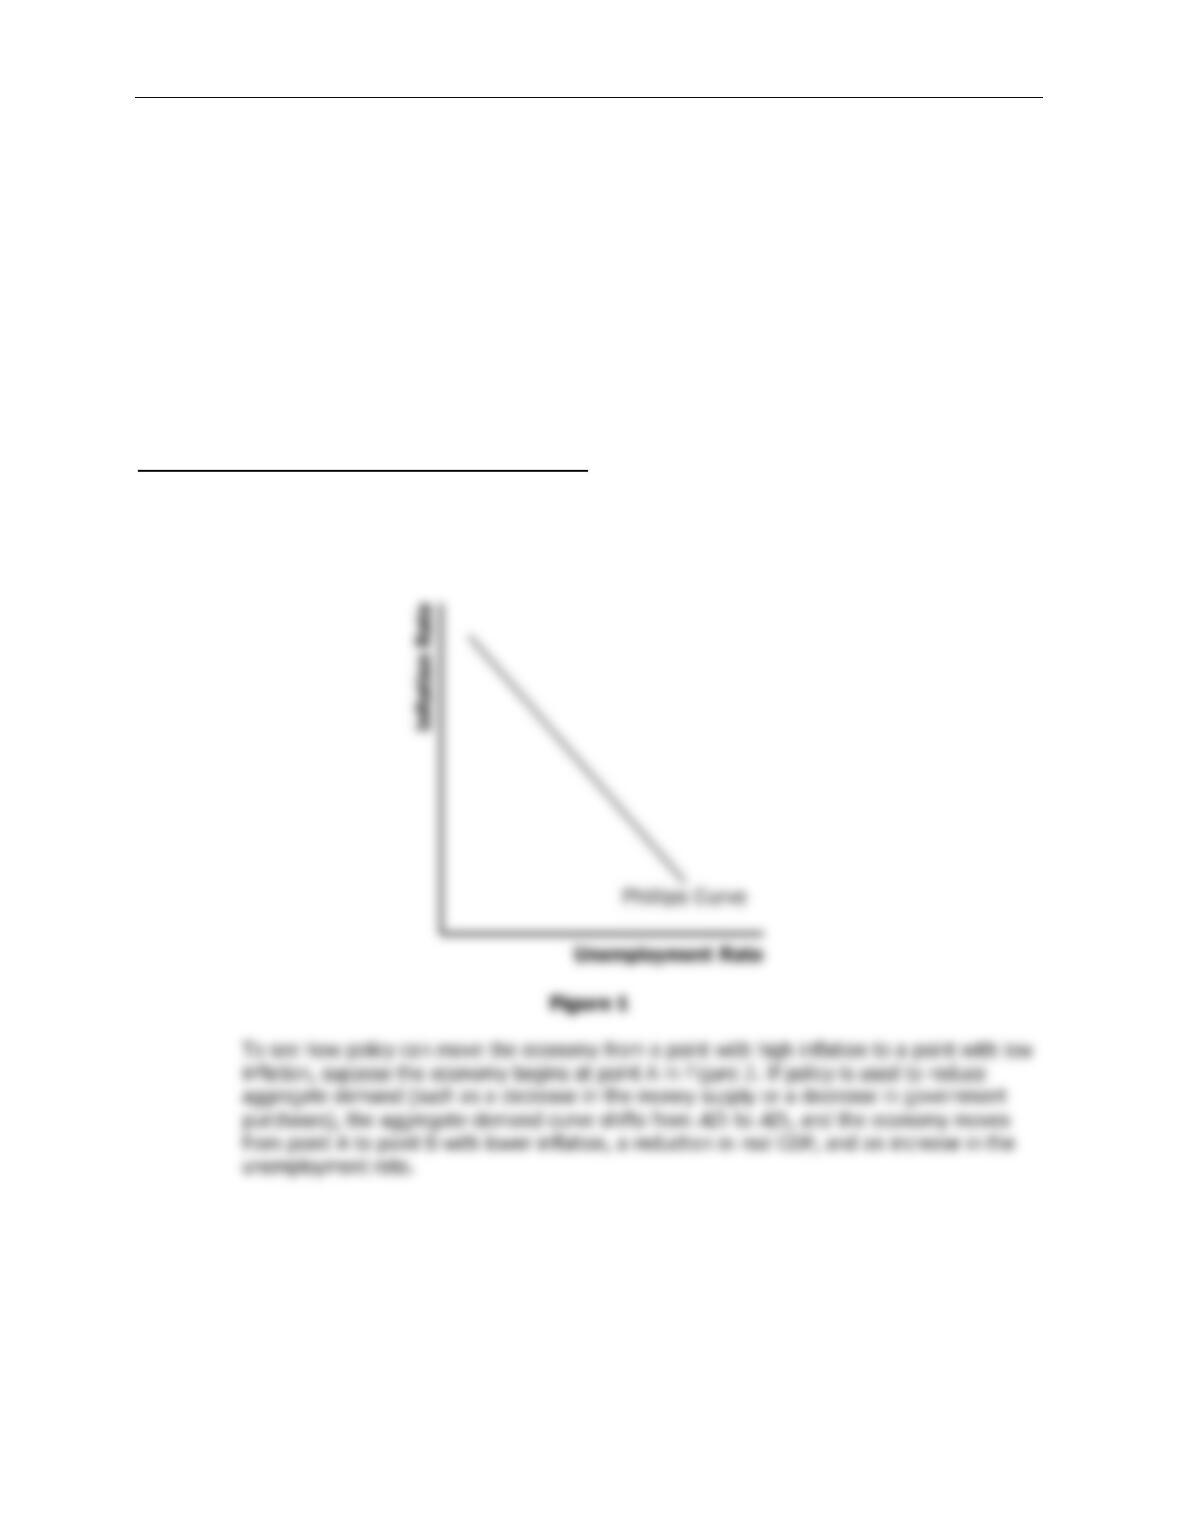
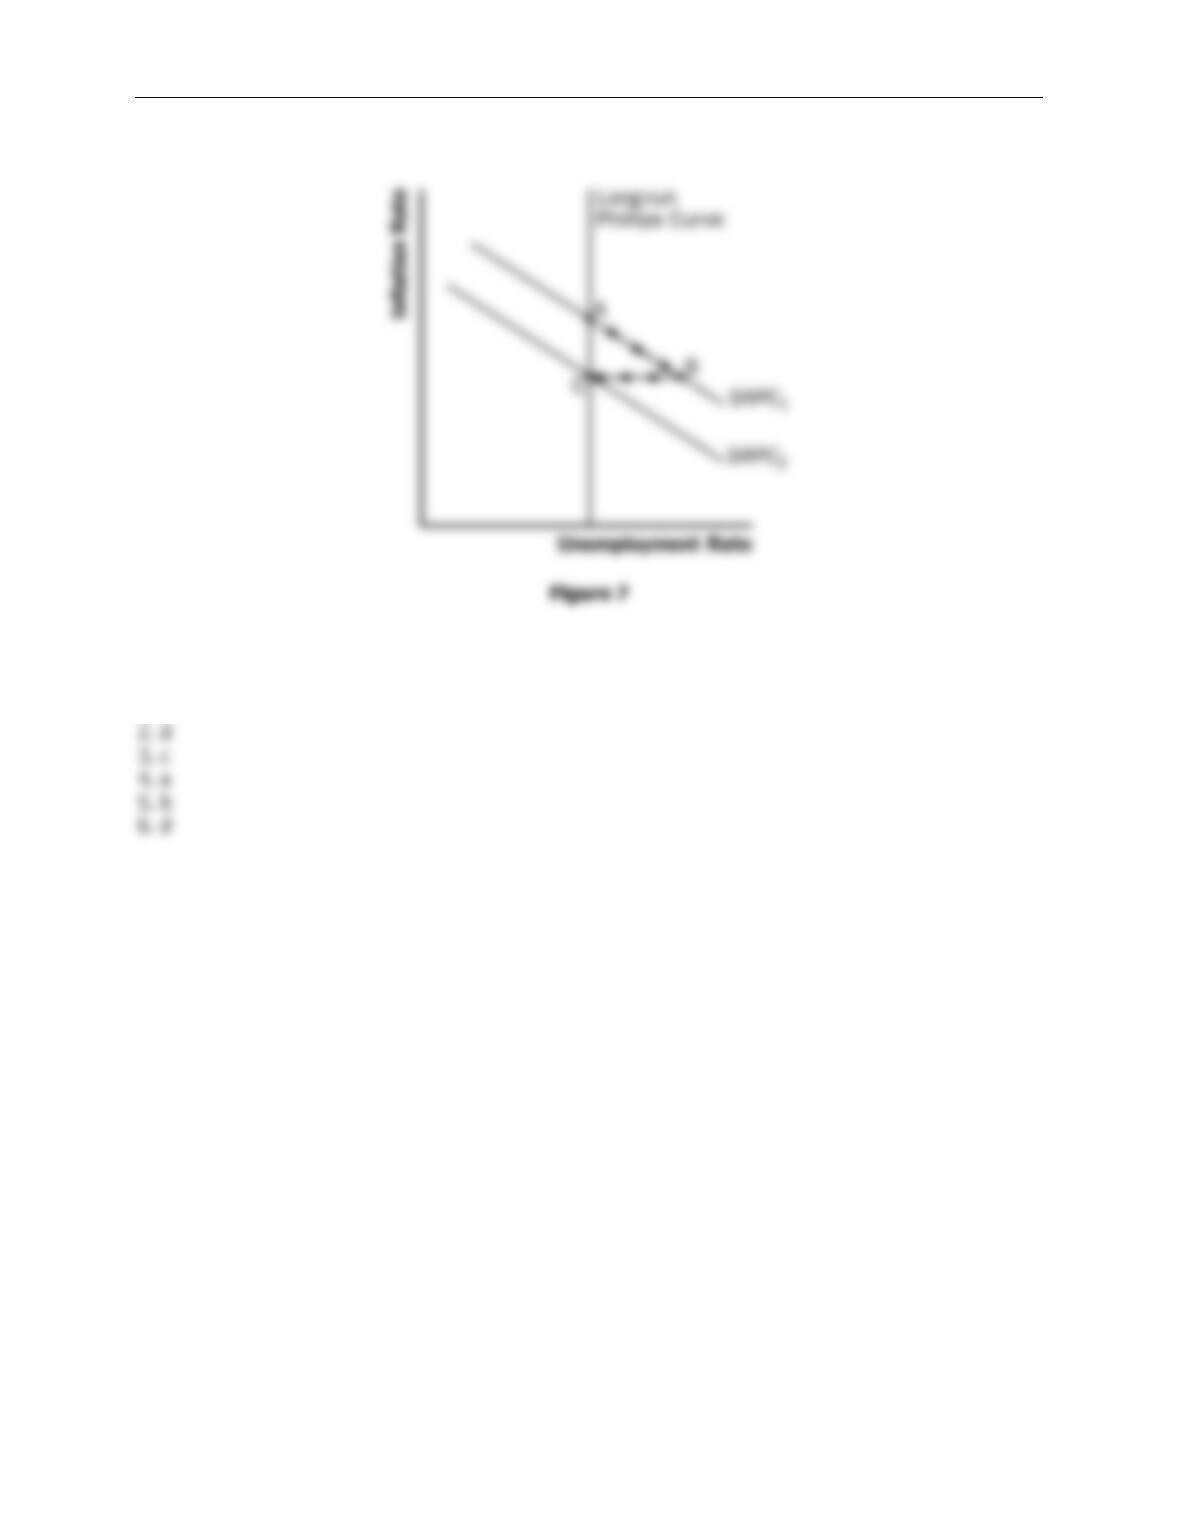
1. The Phillips curve is shown in Figure 1.
Chapter 22/The Short-Run Trade-off between Inflation and Unemployment ❖ 401
Figure 2
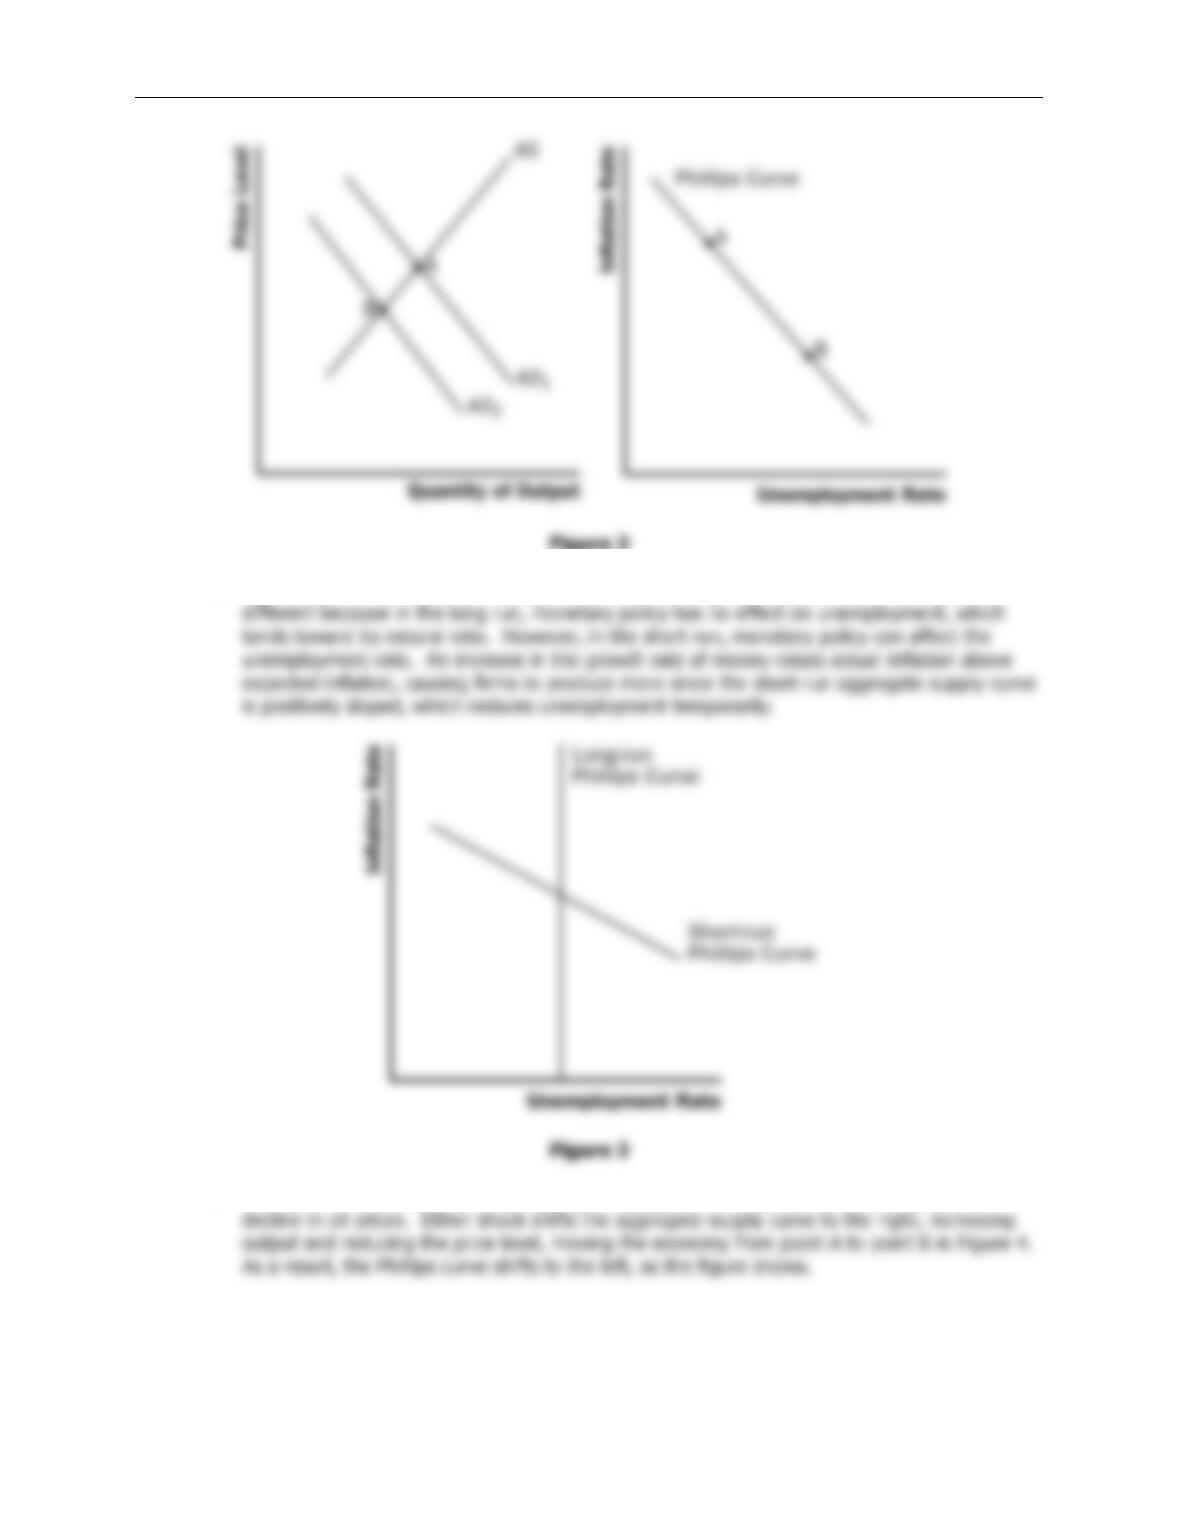
2. Figure 3 shows the short-run Phillips curve and the long-run Phillips curve. The curves are
3. Examples of favorable shocks to aggregate supply include improved productivity and a
402 ❖ Chapter 22/The Short-Run Trade-off between Inflation and Unemployment
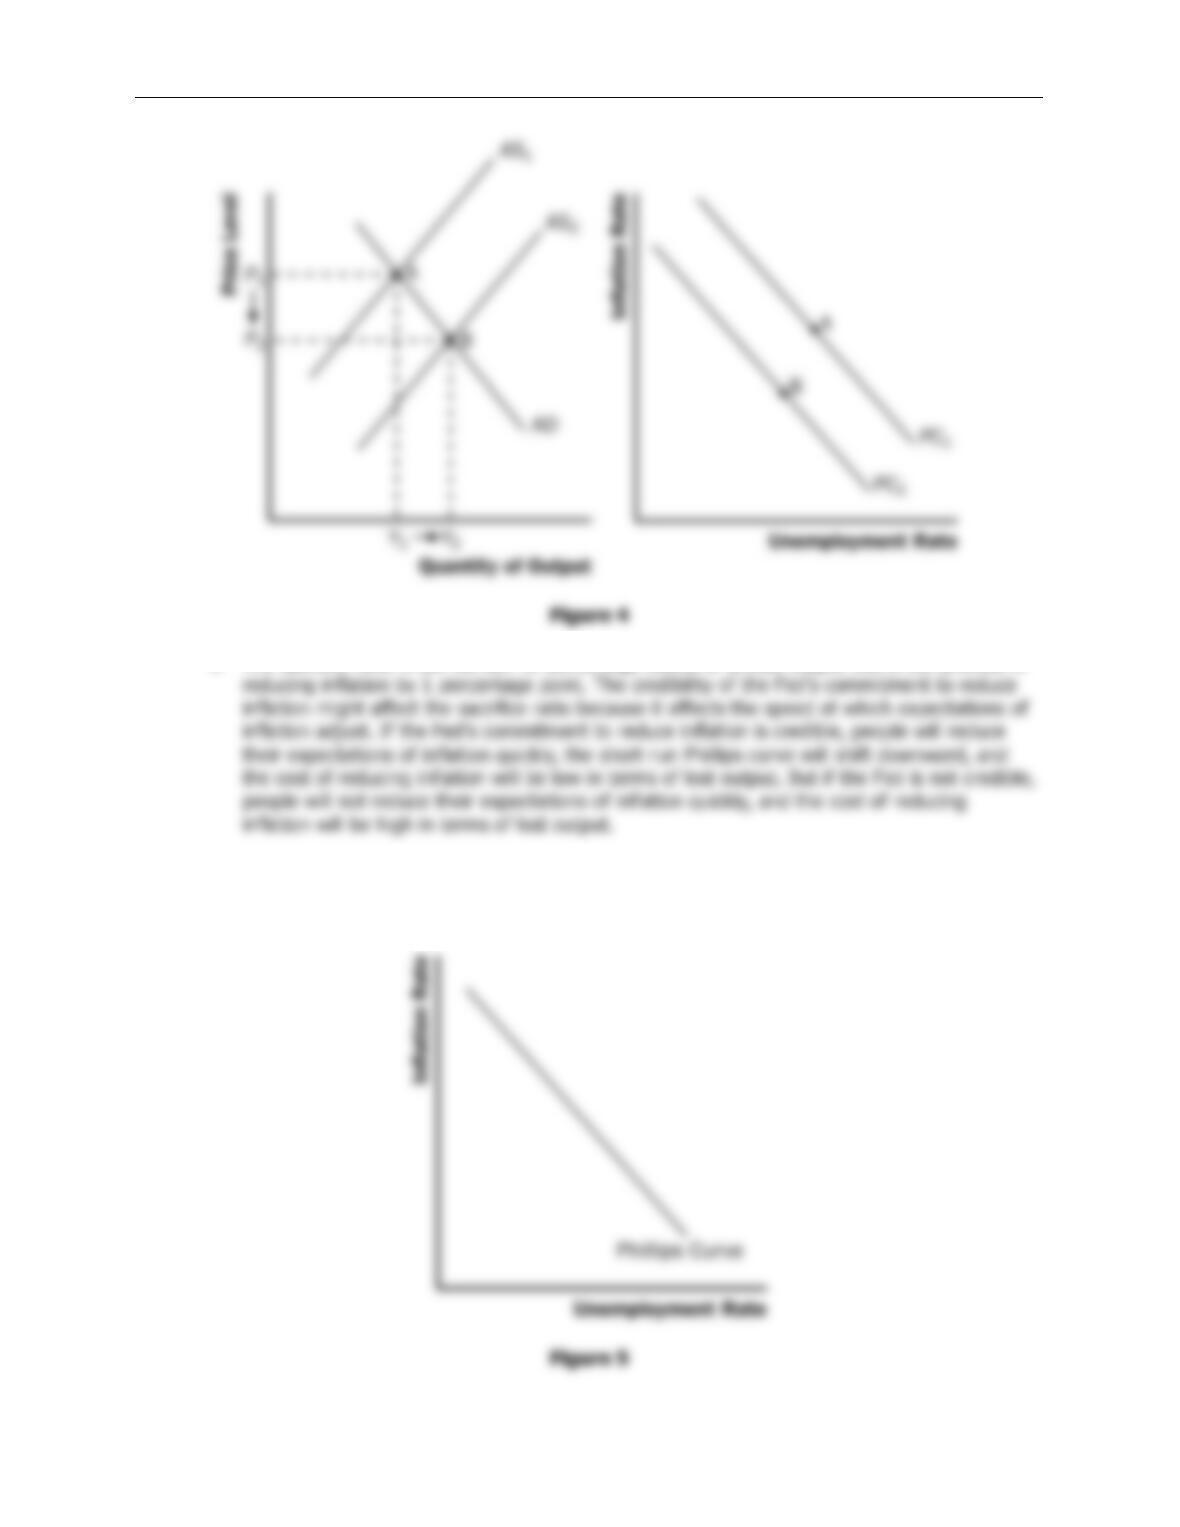
4. The sacrifice ratio is the number of percentage points of annual output lost in the process of
Questions for Review
Chapter 22/The Short-Run Trade-off between Inflation and Unemployment ❖ 403
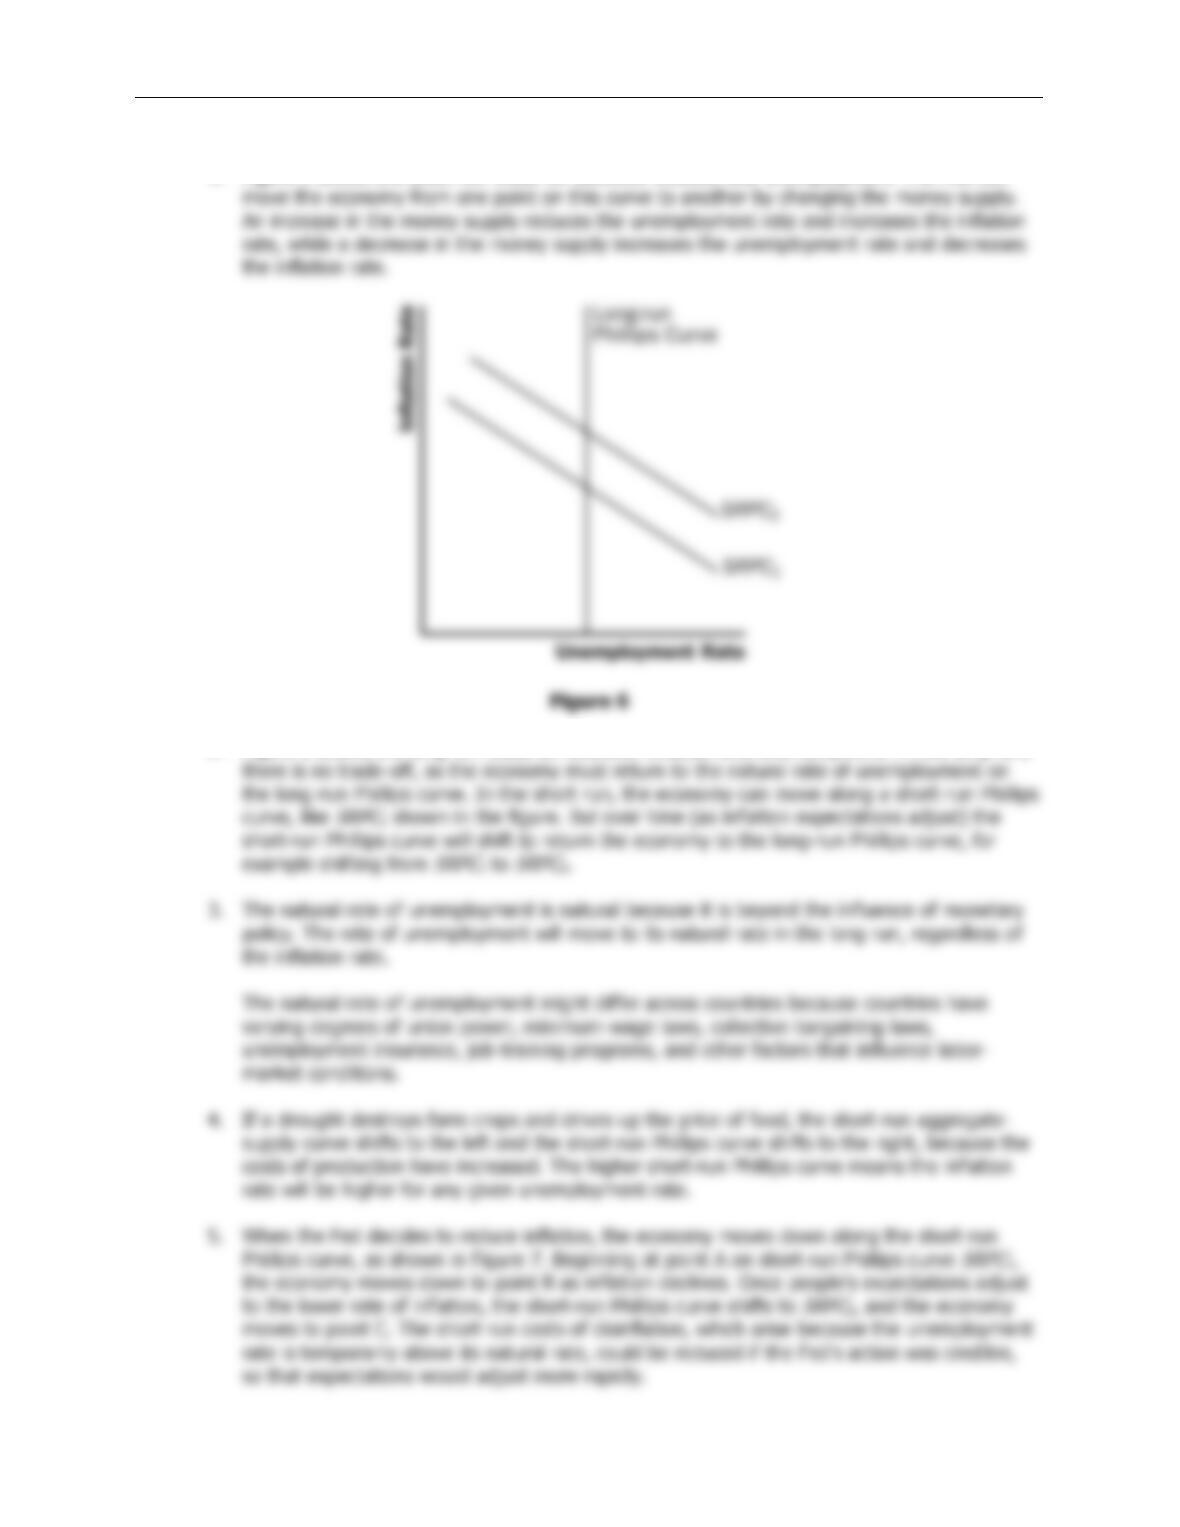
1. Figure 5 shows the short-run trade-off between inflation and unemployment. The Fed can
2. Figure 6 shows the long-run trade-off between inflation and unemployment. In the long run,
404 ❖ Chapter 22/The Short-Run Trade-off between Inflation and Unemployment
Quick Check Multiple Choice
1. b
Chapter 22/The Short-Run Trade-off between Inflation and Unemployment ❖ 405
Problems and Applications
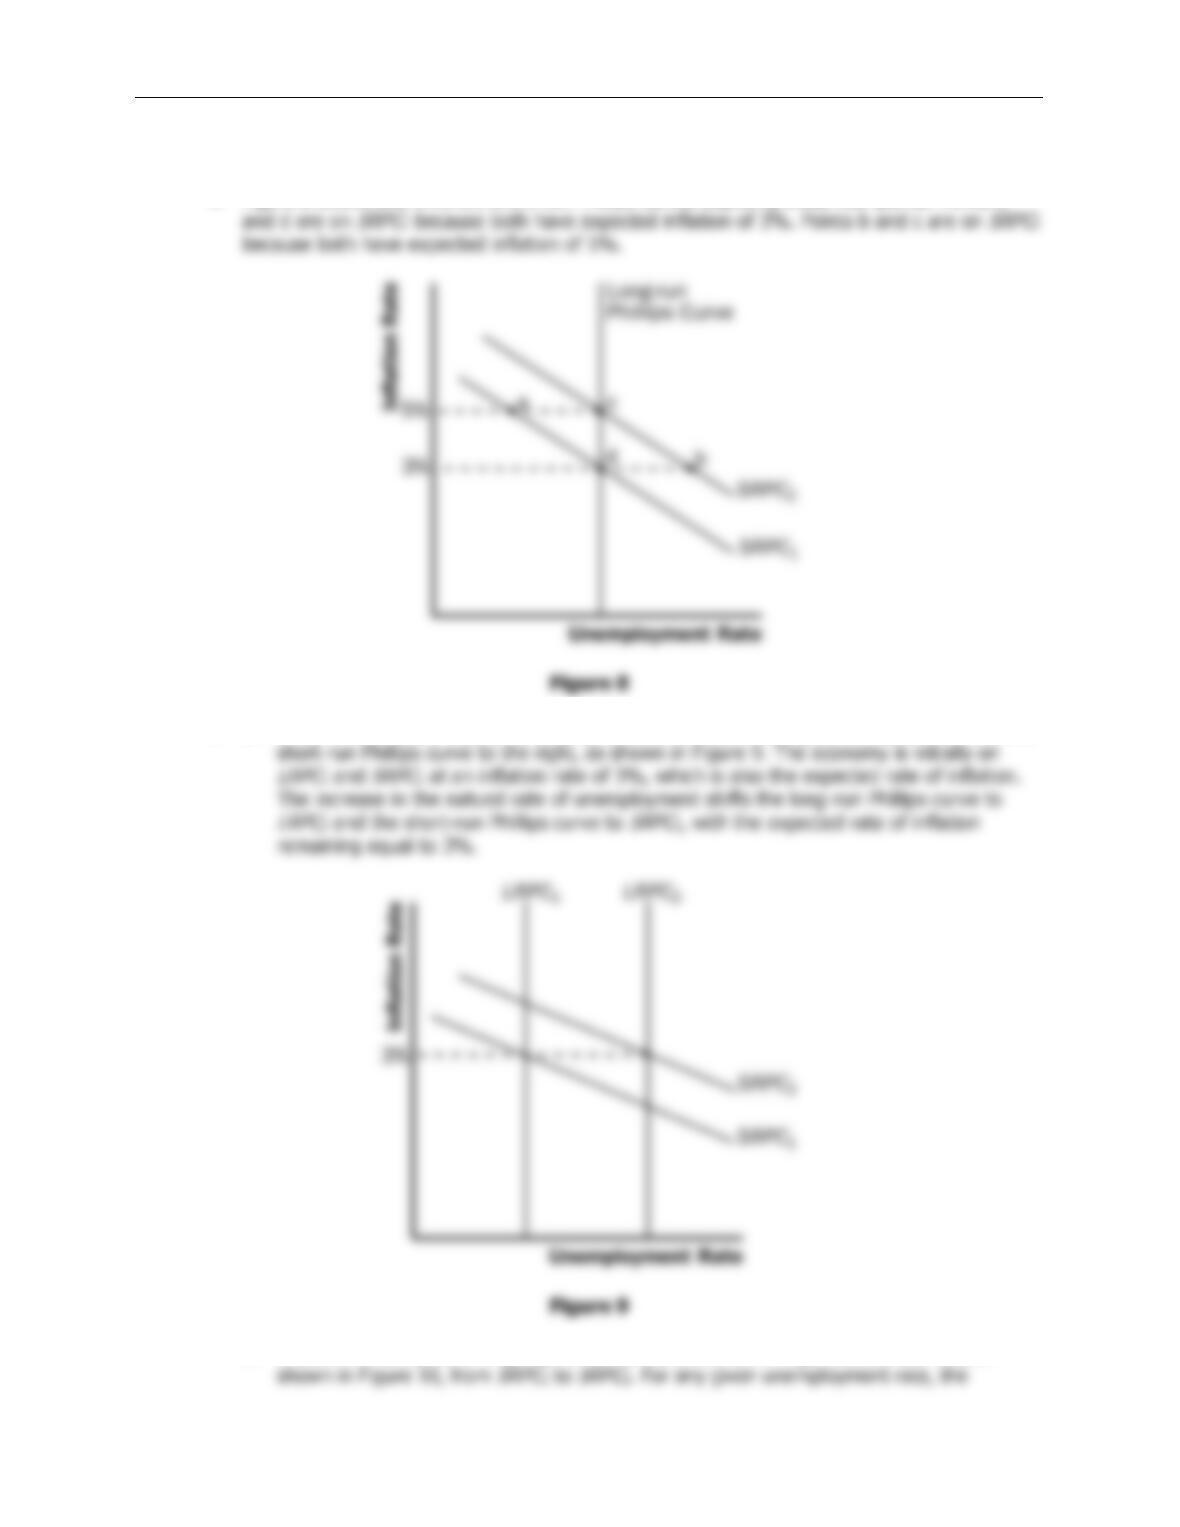
1. Figure 8 shows two different short-run Phillips curves depicting these four points. Points a
2. a. A rise in the natural rate of unemployment shifts both the long-run Phillips curve and the
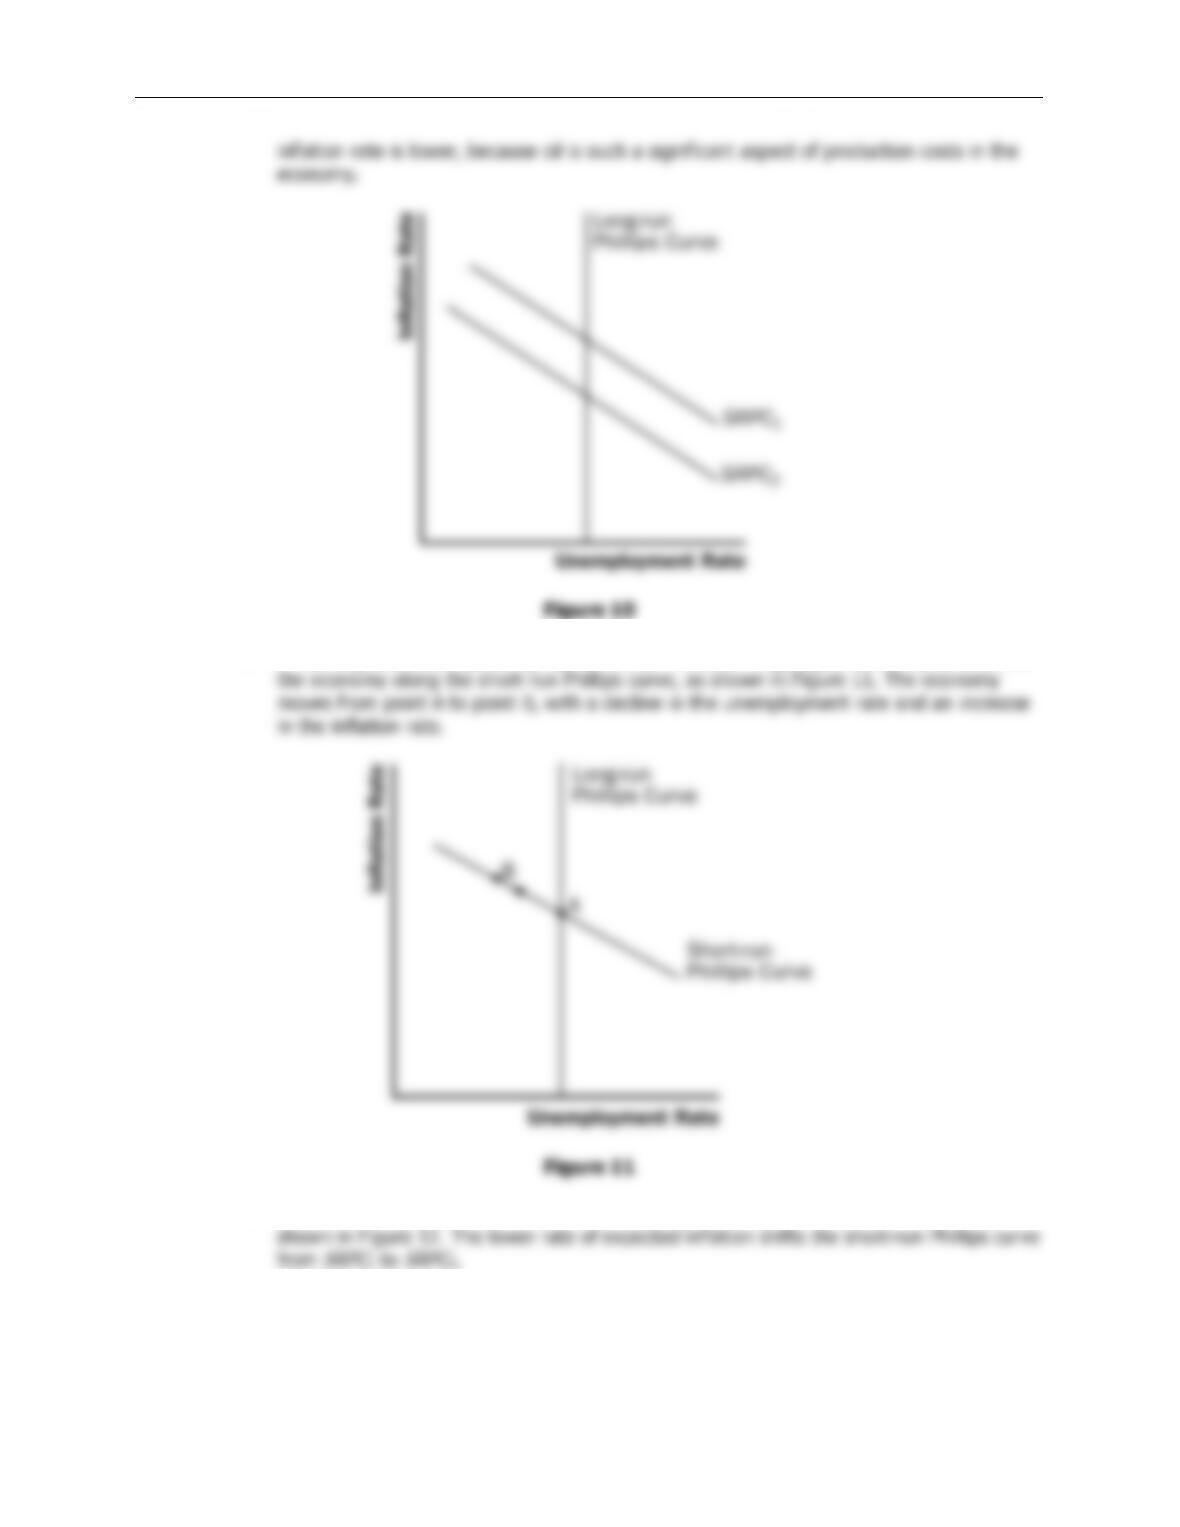
b. A decline in the price of imported oil shifts the short-run Phillips curve to the left, as
406 ❖ Chapter 22/The Short-Run Trade-off between Inflation and Unemployment
c. A rise in government spending represents an increase in aggregate demand, so it moves
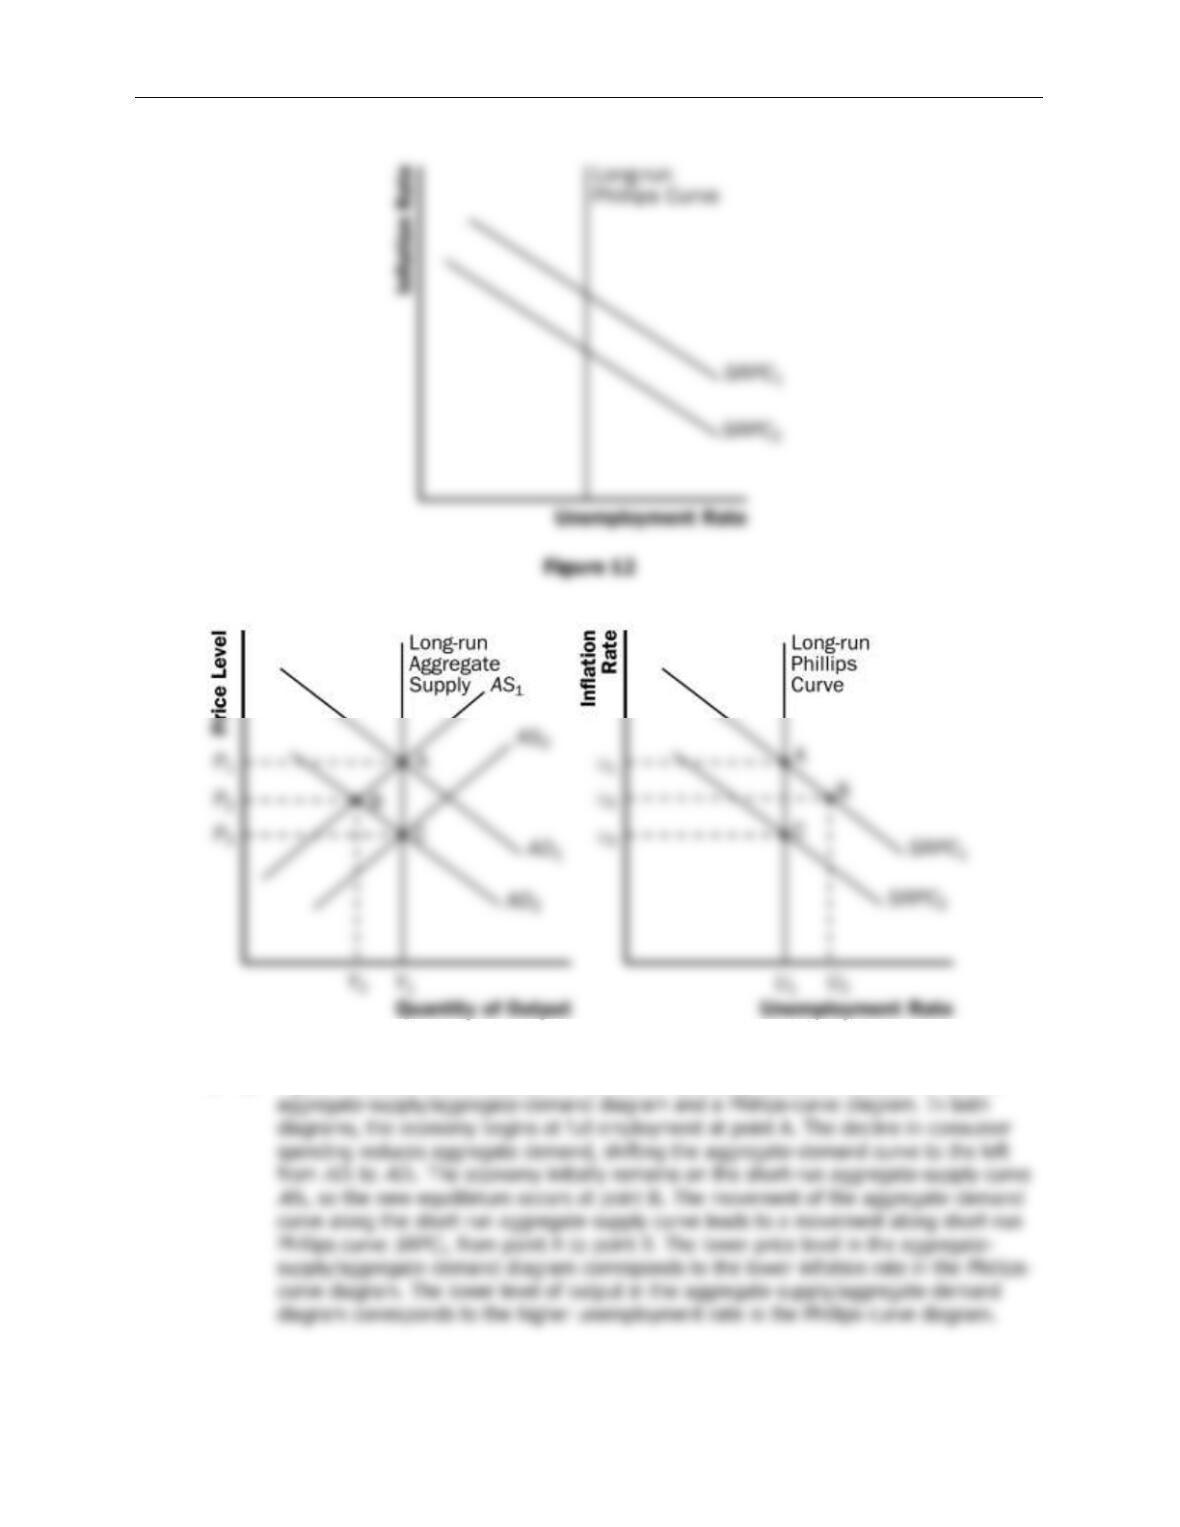
d. A decline in expected inflation causes the short-run Phillips curve to shift to the left, as
Chapter 22/The Short-Run Trade-off between Inflation and Unemployment ❖ 407
Figure 13
3. a. Figure 13 shows how a reduction in consumer spending causes a recession in both an
408 ❖ Chapter 22/The Short-Run Trade-off between Inflation and Unemployment
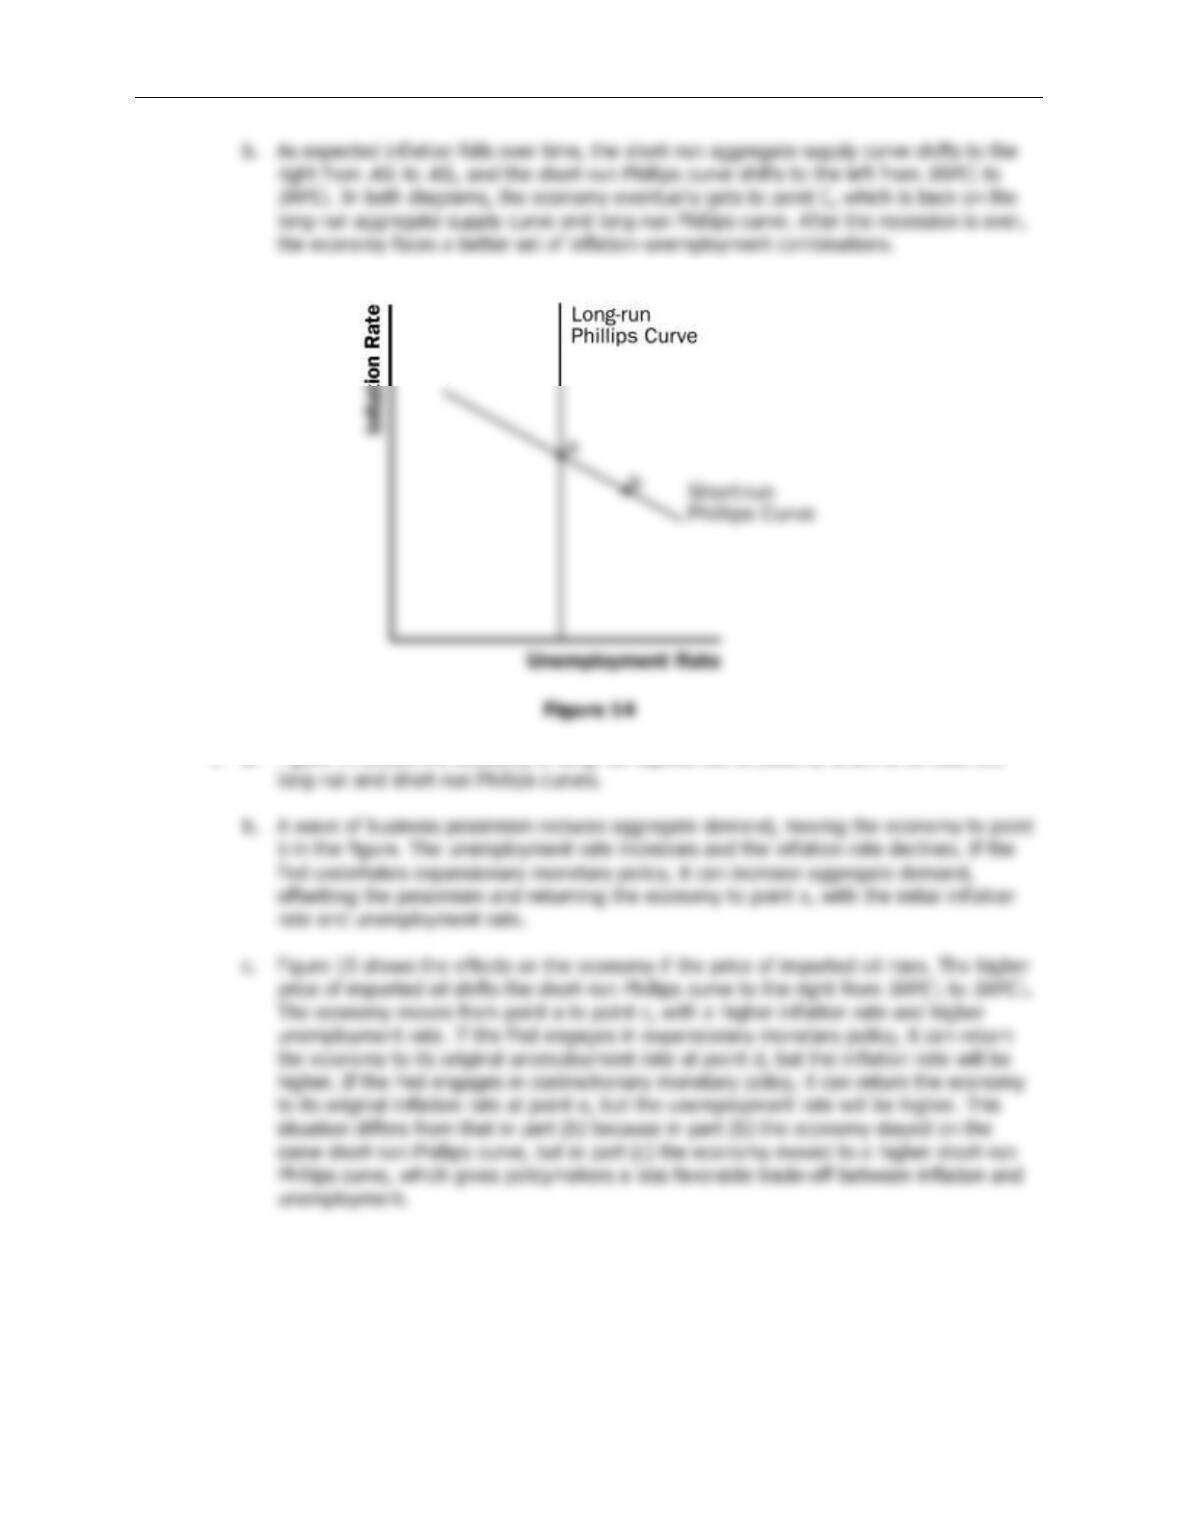
4. a. Figure 14 shows the economy in long-run equilibrium at point a, which is on both the
Chapter 22/The Short-Run Trade-off between Inflation and Unemployment ❖ 409
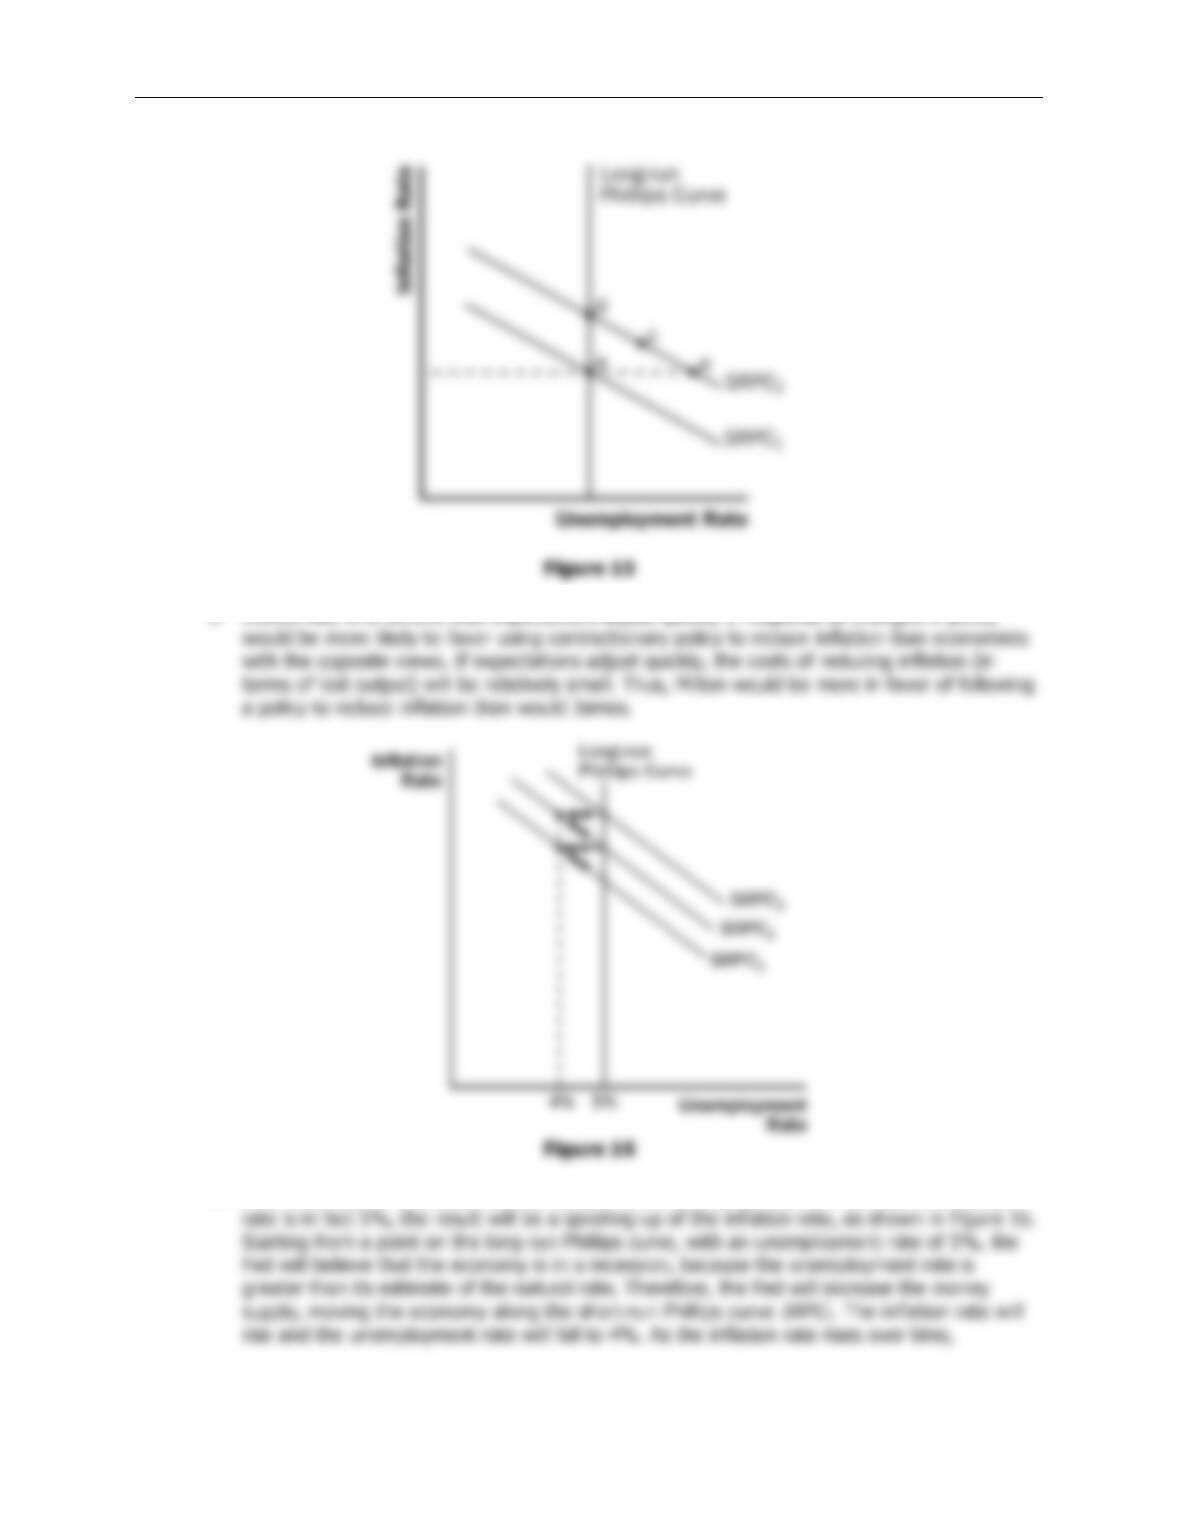
6. If the Fed acts on its belief that the natural rate of unemployment is 4%, when the natural
410 ❖ Chapter 22/The Short-Run Trade-off between Inflation and Unemployment
7. a. If wage contracts have short durations, a recession induced by contractionary monetary
policy will be less severe, because wage contracts can be adjusted more rapidly to reflect
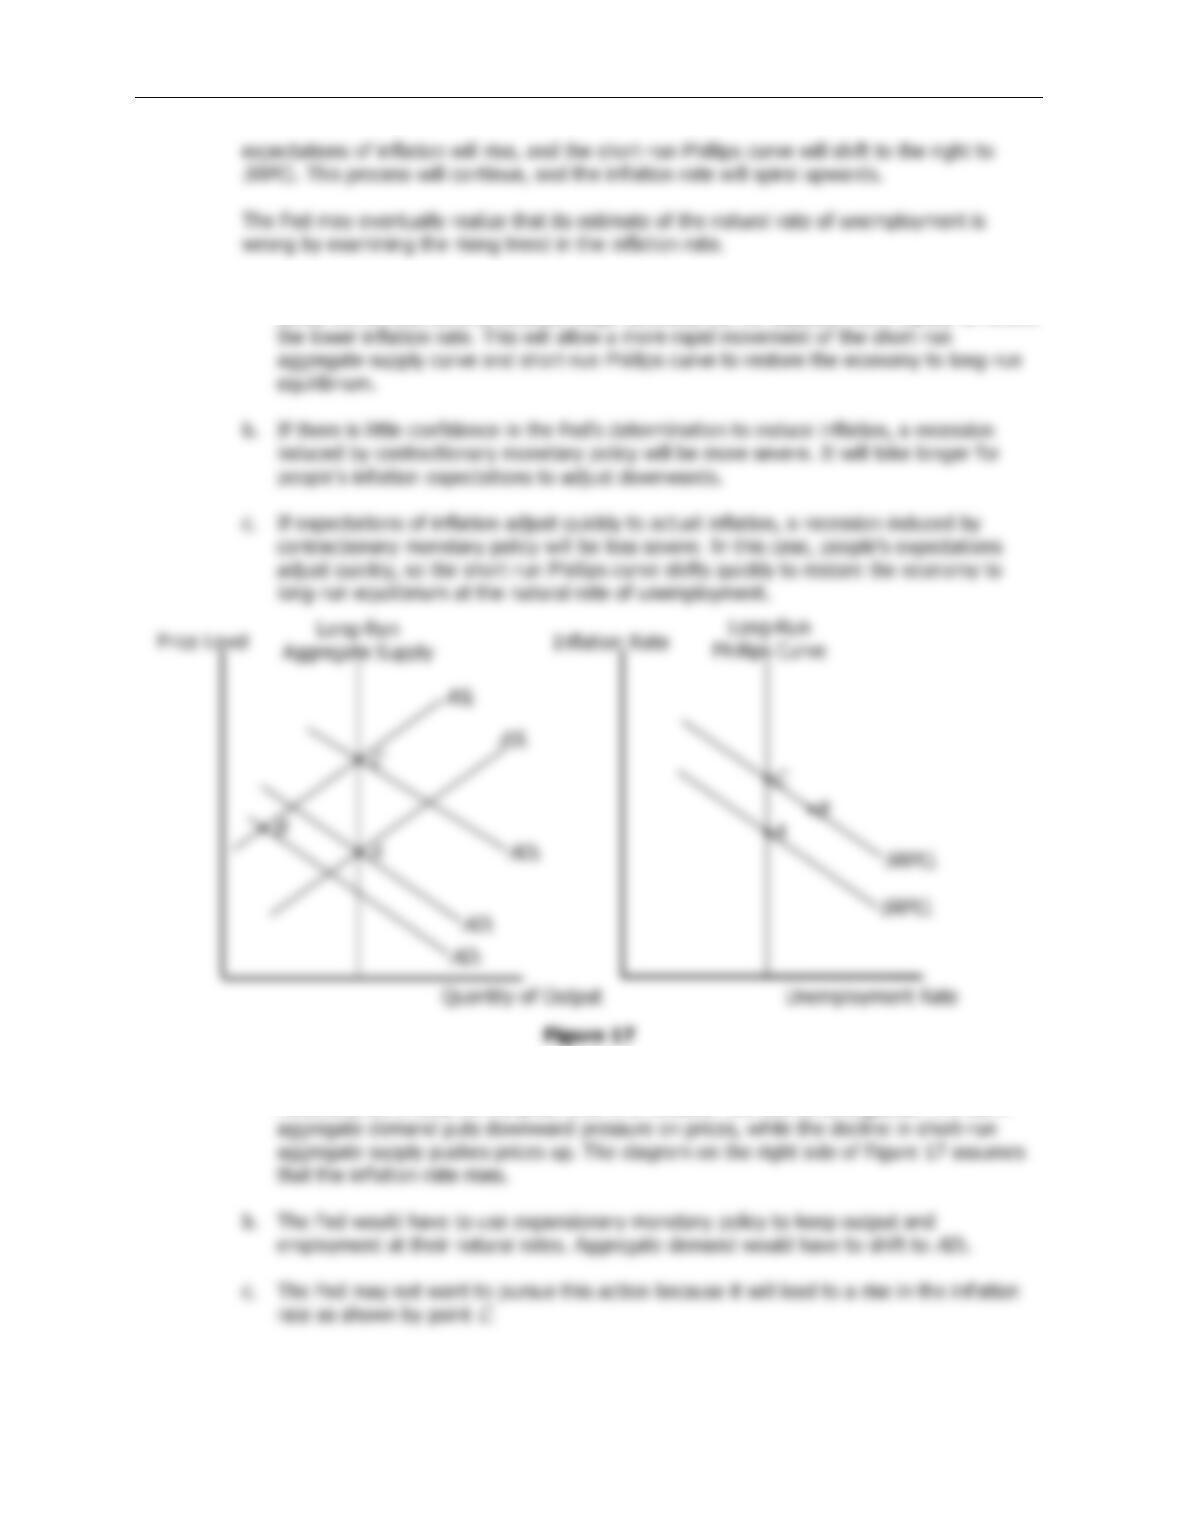
8. a. As shown in the left diagram of Figure 17, equilibrium output and employment will fall.
However, the effects on the price level and inflation rate will be ambiguous. The fall in