726 Chapter 21 • Business statistiCs and data presentation
Review exeRciSeS
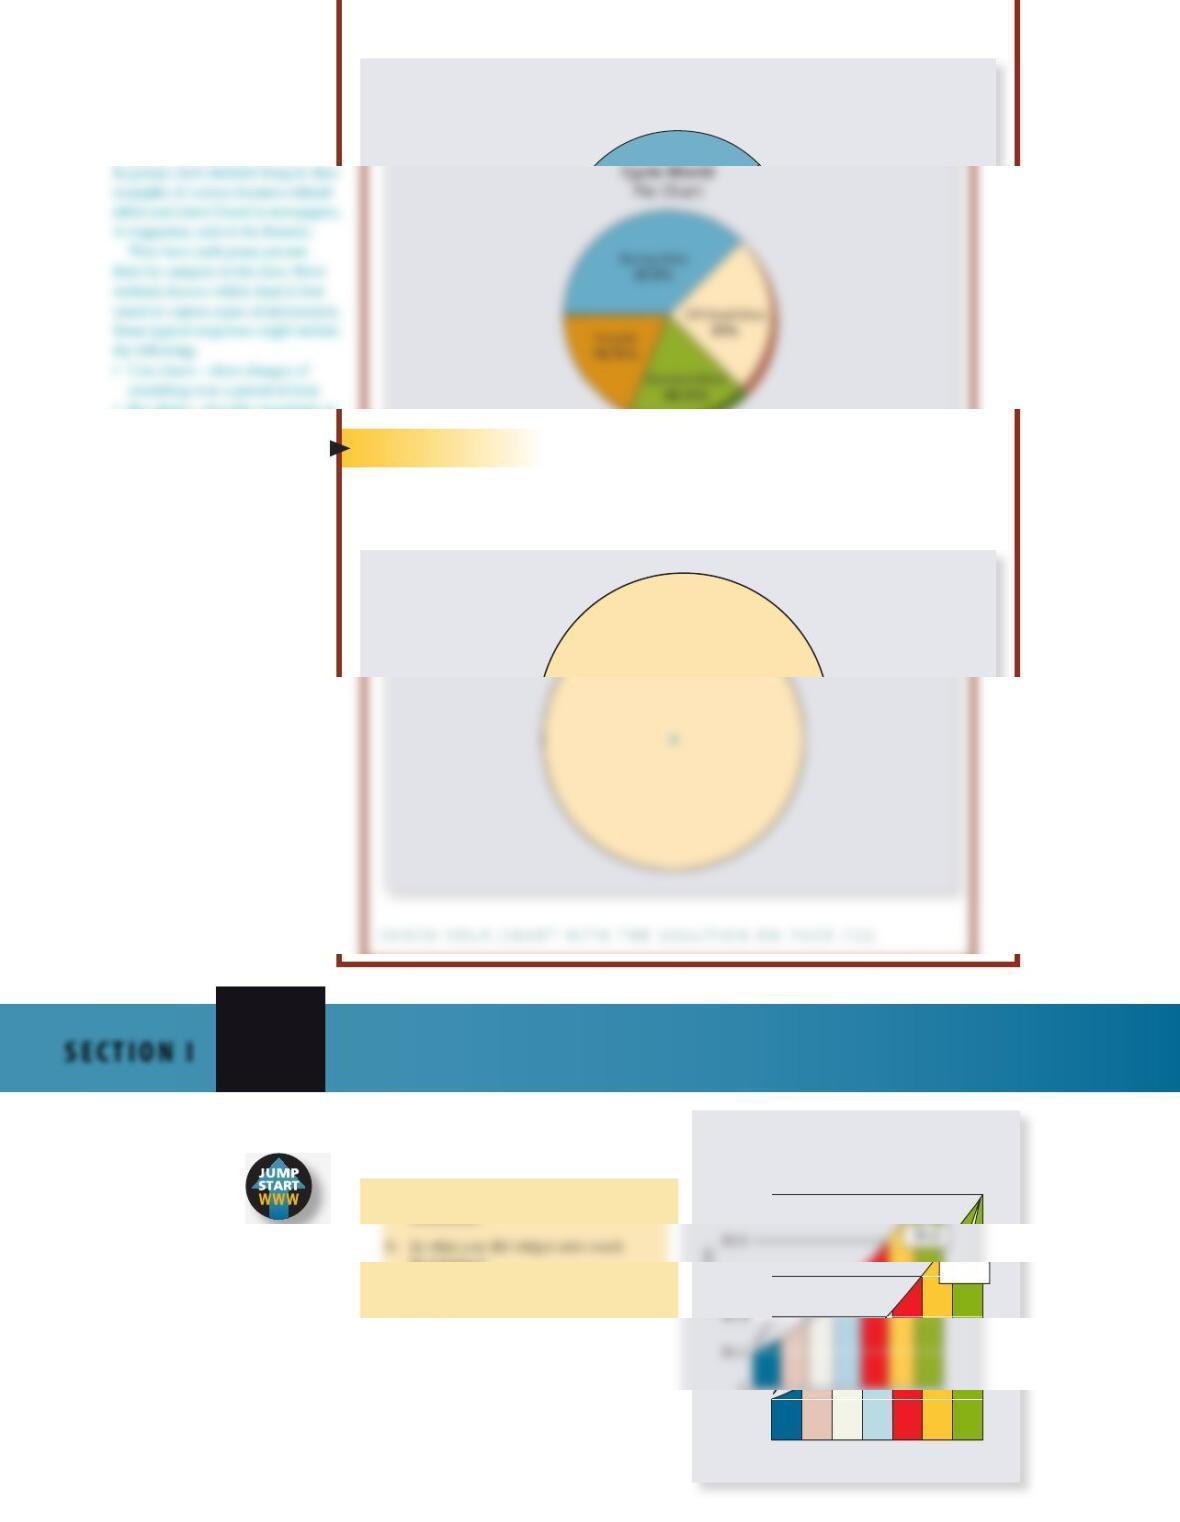
1. Use the line chart “Widget Sales 2009–2016”
to answer the following questions.
a. What was the amount of widget sales
in 2009?
b. In what year did widget sales reach
$0.8billion?
‘09 ‘10 ‘11 ‘12 ‘13 ‘14 ‘15 ‘16
0
$0.2
$0.8
$1.2
Widget Sales 2009–2016
Widget Corporation of Americ
a
$1.2
Cycle World
Pie Chart
tryitexerciSe 10
From the Interstate Business College enrollment figures in the table on page 722, construct a pie
chart illustrating the winter term enrollment.
ClassrooM aCtivity
In groups, have students bring to class
examples of various business-related
tables and charts found in newspapers,
in magazines, and on the Internet.
a whole
21
Section i
85461_ch21_hr_711-761_1.indd 726 9/23/15 5:12 PM
seCtion i • data interpretation and presentation 727
c. What does this line graph represent?
d. What variables are represented on the x-axis and the y-axis?
e. What was the amount of widget sales in 2015?
f. In which year did sales reach $0.6 billion?
g. Calculate how much greater widget sales were in 2016 compared with 2009.
as the sales manager for Magnum enterprises, you have been asked by the president to
prepare the following charts for the shareholders’ meeting next week. Use the six-month
sales report, Table 21-1 on page 713, as the database for these charts. Calculate totals as
required.
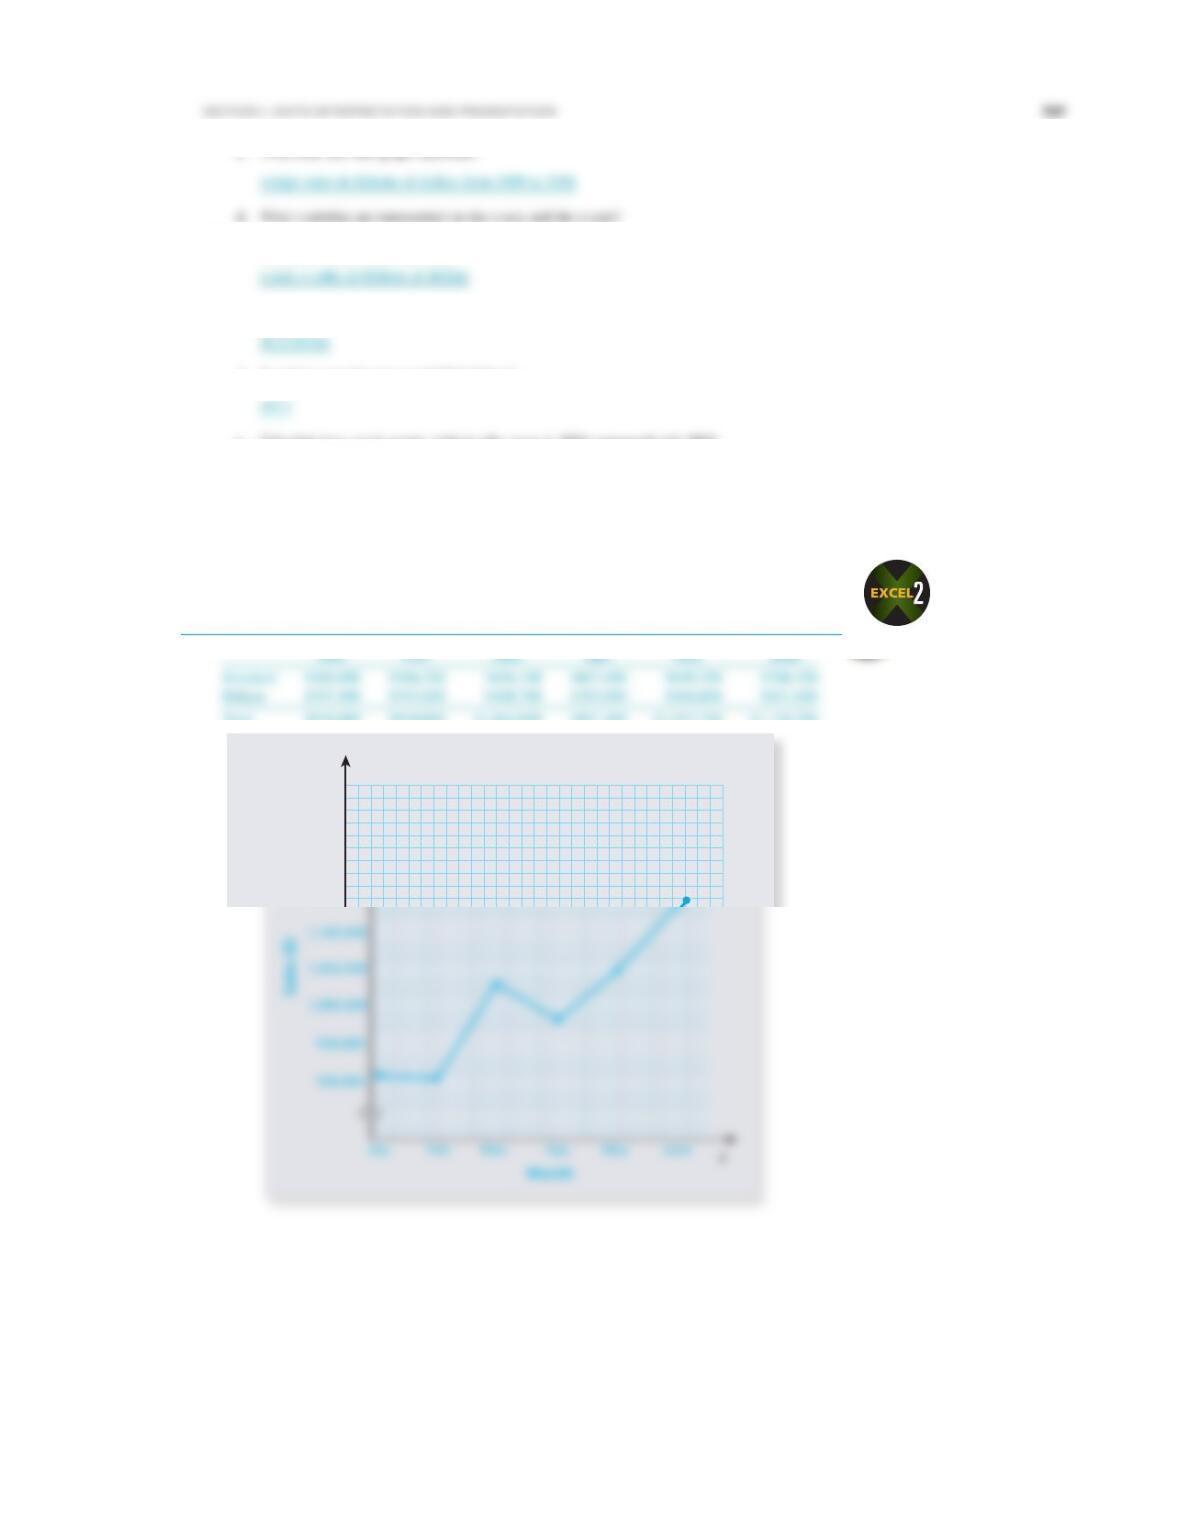
2. Single-line chart of the total company sales per month
Jan. Feb. Mar. Apr. May June
Standard $569,400 $566,200 $636,100 $607,400 $649,700 $706,700
1,200,000
1,150,000
y
85461_ch21_hr_711-761_1.indd 727 9/23/15 5:12 PM
728 Chapter 21 • Business statistiCs and data presentation
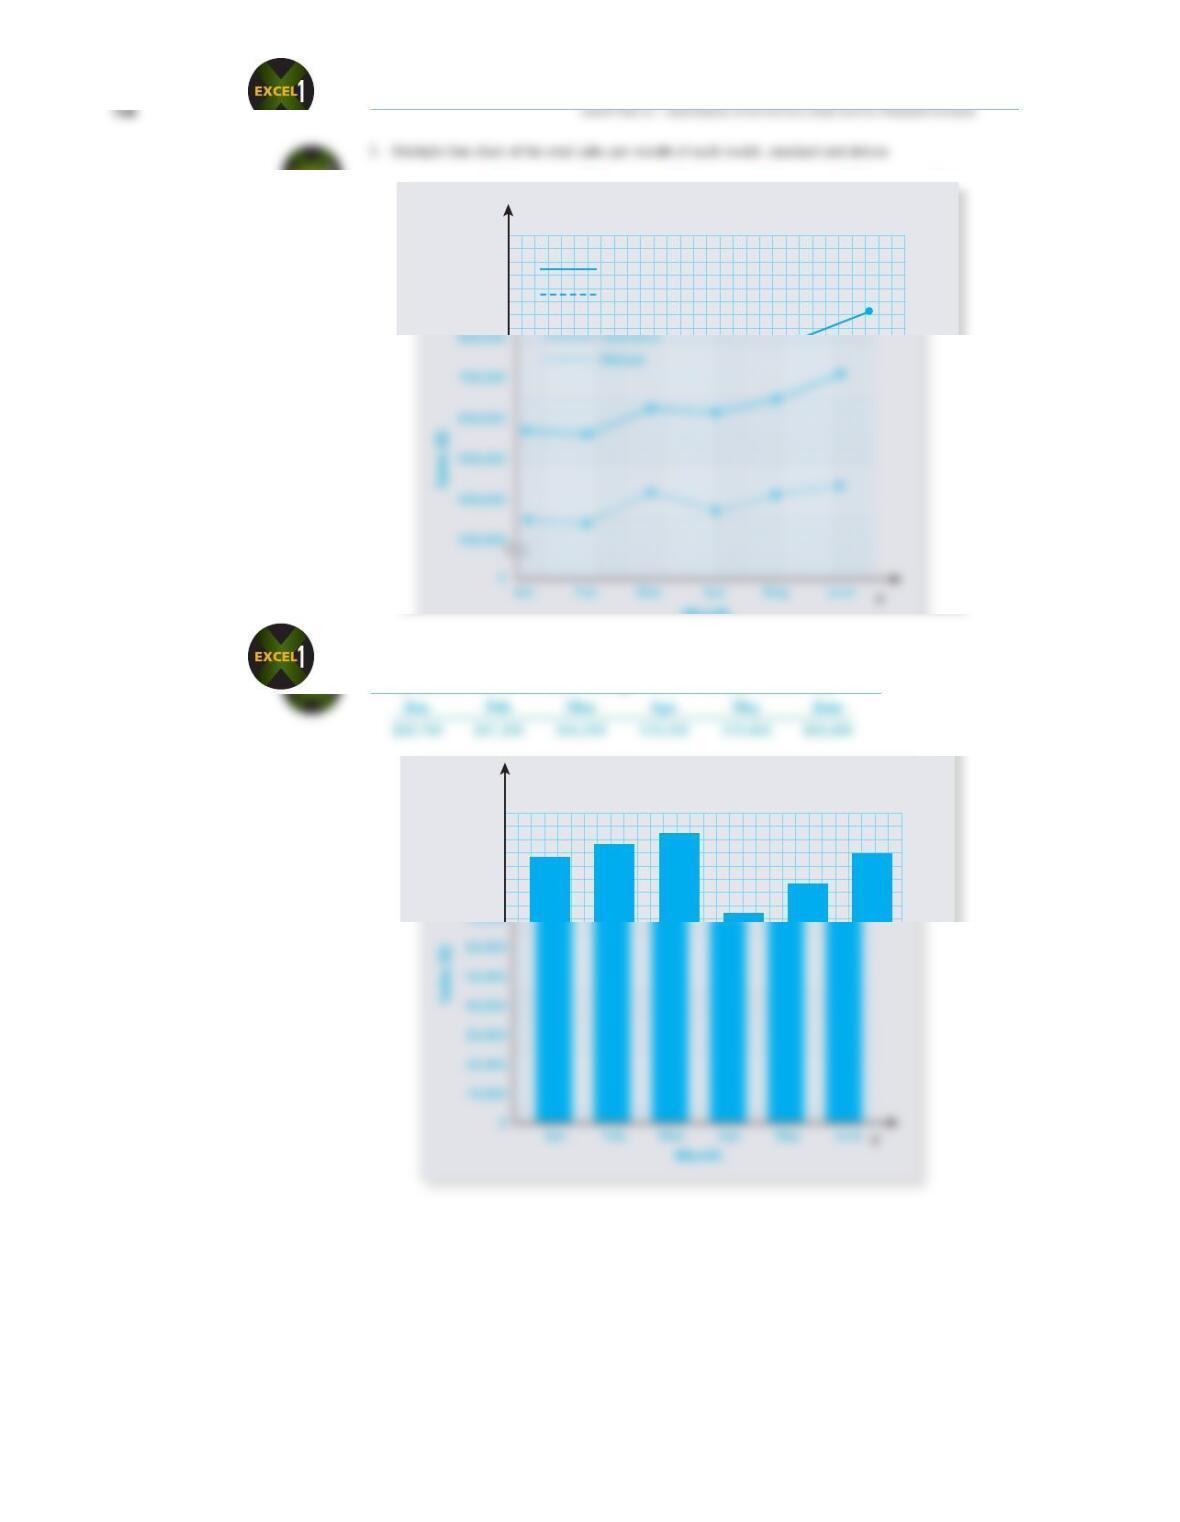
3. Multiple-line chart of the total sales per month of each model, standard and deluxe
Jan. Feb. Mar. Apr. May June
y
800,000
700,000
Standard
Deluxe
4. Standard bar chart of the deluxe sales per month in the Southeast territory
Jan. Feb. Mar. Apr. May June
70,000
90,000
100,000
80,000
y
85461_ch21_hr_711-761_1.indd 728 9/23/15 5:12 PM
seCtion i • data interpretation and presentation 729
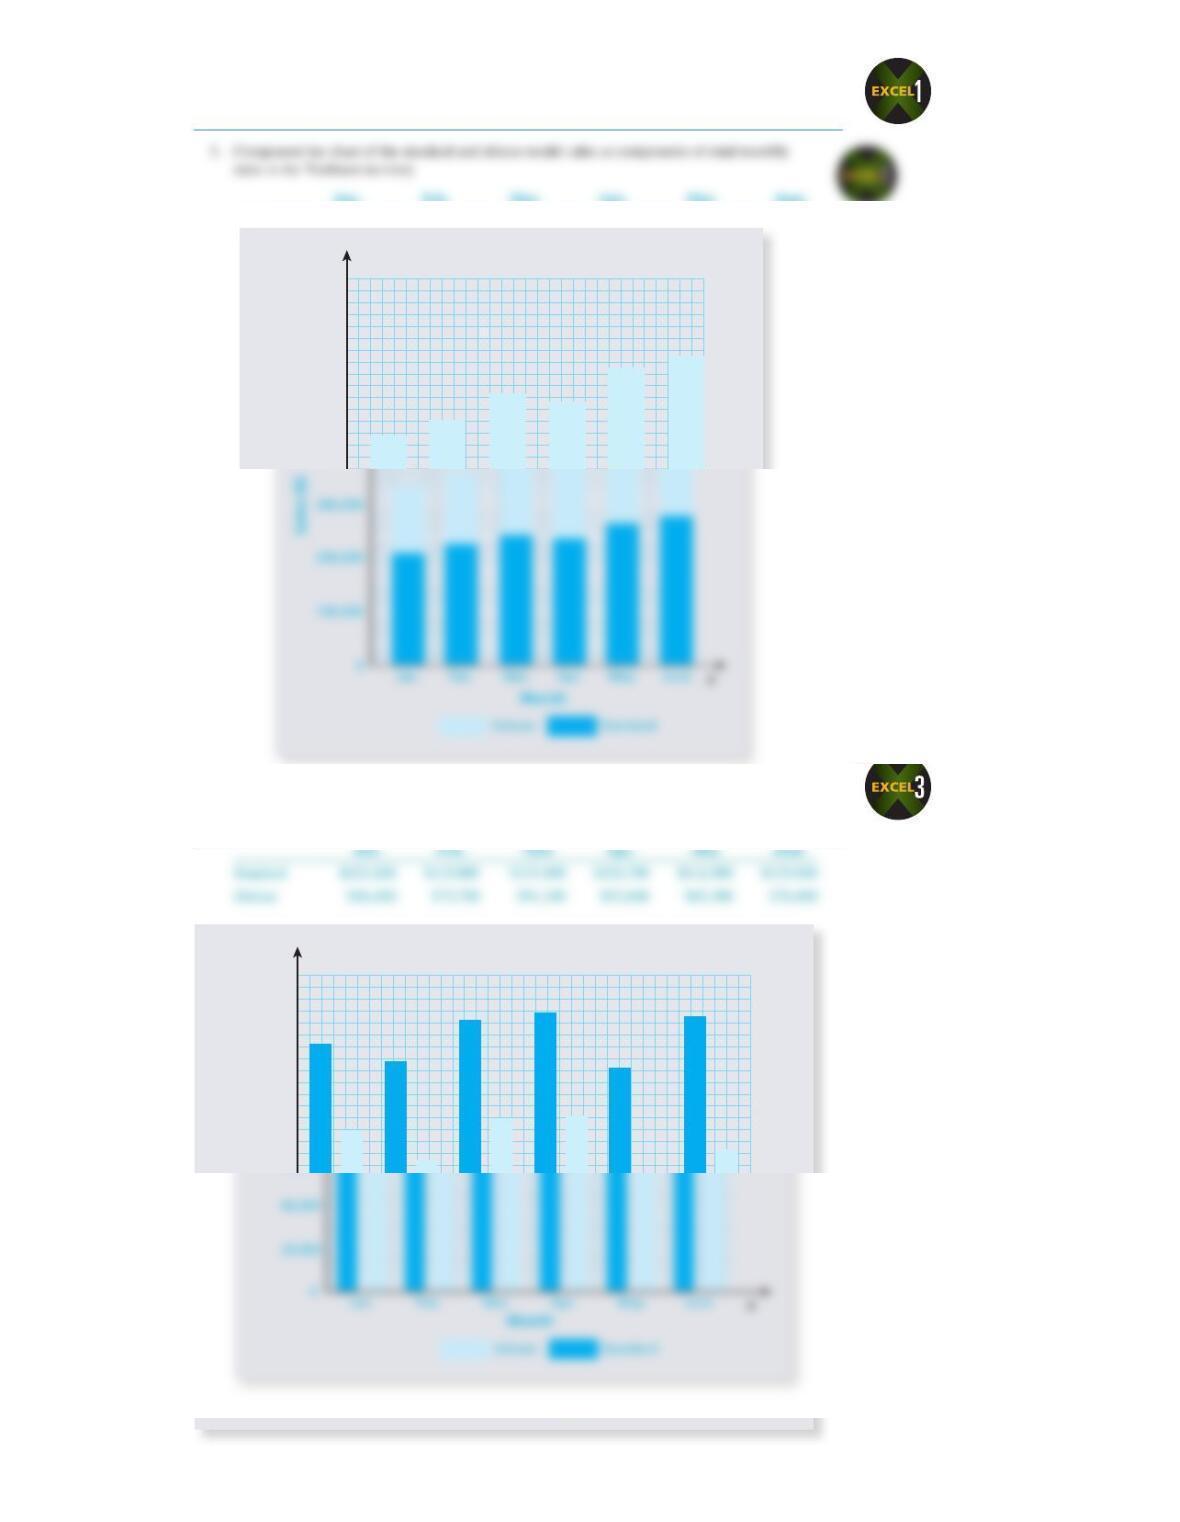
5. Component bar chart of the standard and deluxe model sales as components of total monthly
sales in the Northeast territory
Jan. Feb. Mar. Apr. May June
y
500,000
400,000
300,000
6. Comparative bar chart of the standard and deluxe model sales per month in the Northwest
territory
Jan. Feb. Mar. Apr. May June
140,000
120,000
100,000
80,000
y
85461_ch21_hr_711-761_1.indd 729 9/23/15 5:12 PM
730 Chapter 21 • Business statistiCs and data presentation
BuSineSS DeciSion: chooSing a chaRT
8. You have been asked to prepare a chart of stock prices for the upcoming semiannual stockholders’
meeting for Magnum Enterprises. The following table shows Magnum’s stock prices on the first
day of each month. Choose and prepare a chart that best illustrates this information.
Month Stock Price
January $35.50
February $32.75
March $37.25
April $38.50
May $40.25
y
$40
$39
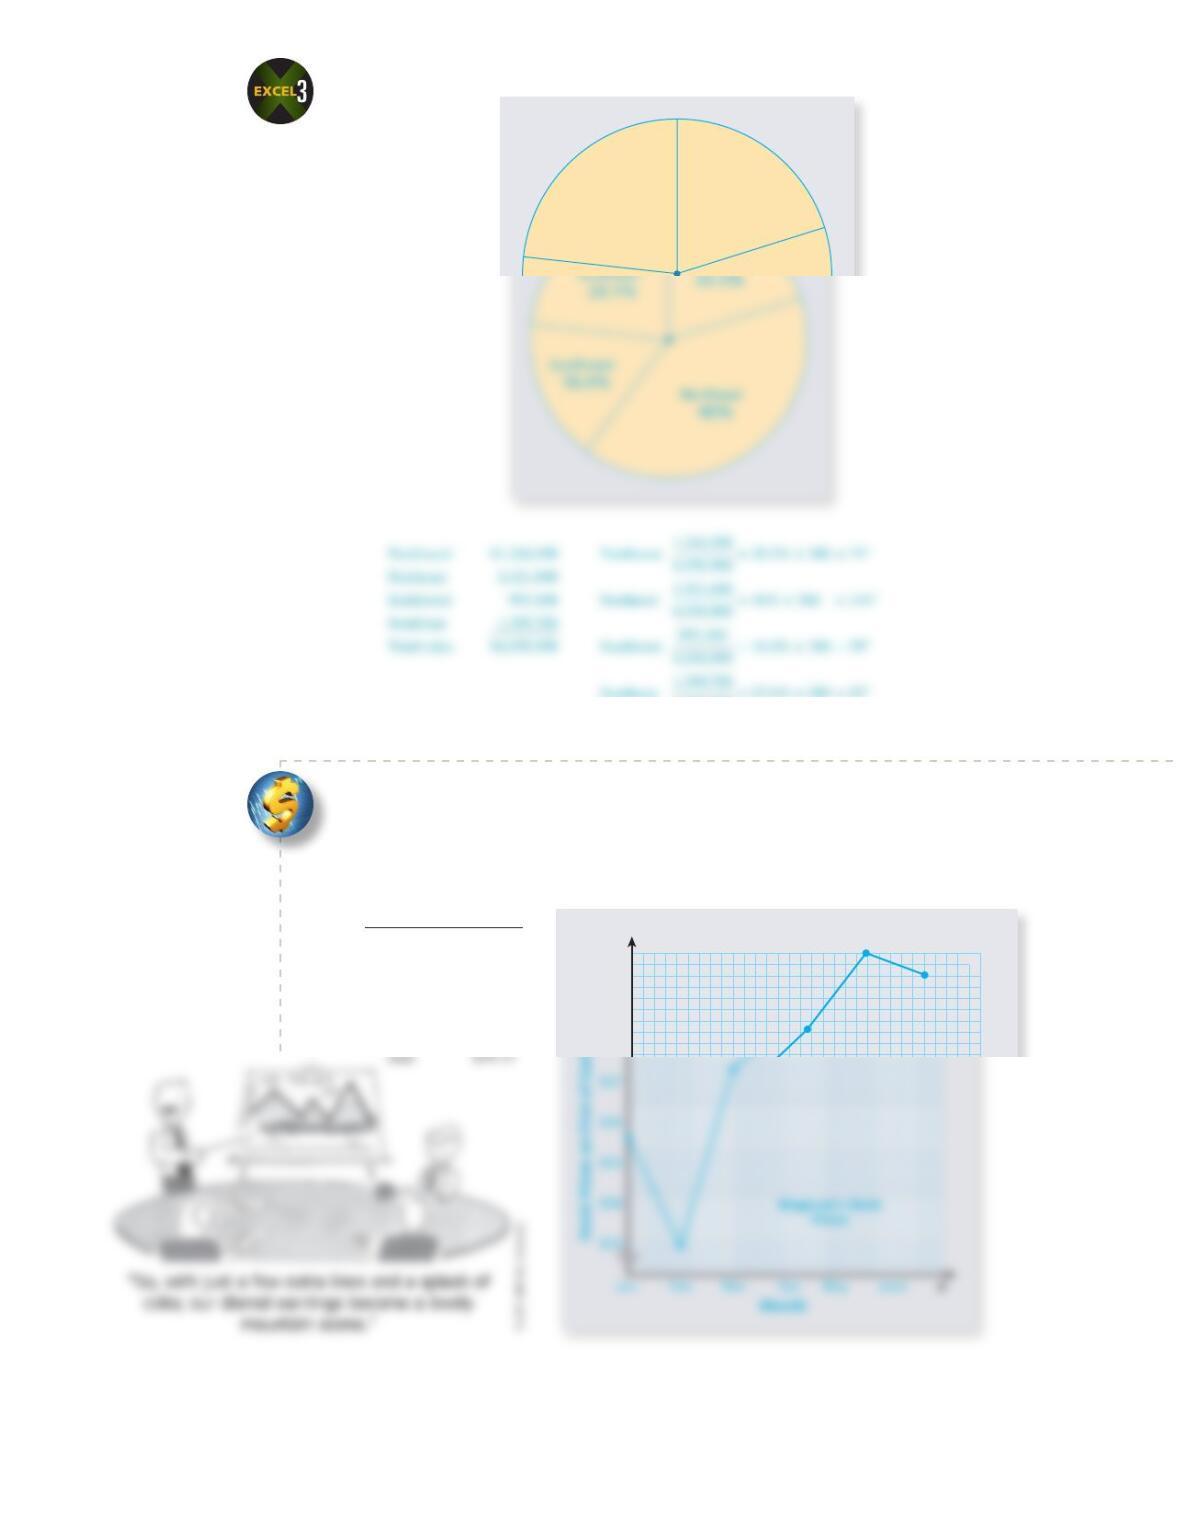
7. Pie chart of the total six-month sales of the four territories
Northwest
Southeast
23.1%
20.5%
85461_ch21_hr_711-761_1.indd 730 9/23/15 5:12 PM
734 chapter 21 • BuSineSS StatiSticS and data preSentation
deterMining the range
Although it does not measure central tendency as the mean, median, and mode do, the range is
another useful measure in statistics. The range is a measure of dispersion; it is the difference
between the lowest and the highest values in a data set. It is used to measure the scope, or
broadness of a set of data. A small range indicates that the data in a set are narrow in scope;
the values are close to each other. A large range indicates that the data in a set are wide in
scope; the values are spread far apart.
21-8
rangeThe difference between the lowest
and the highest values in a data set; used
as a measure of dispersion.
StepS To deTermine The range
claSSrooM activity
“Olympic-type” events are scored
by dropping the highest and lowest
determine the range of the following shirt prices at Styline men’s Shop.
$37.95 $15.75 $24.75 $18.50 $33.75 $42.50 $14.95 $27.95 $19.95
SolutionStrategy
To determine the range of shirt prices, subtract the lowest price from the highest price:
tryitexerciSe 15
Determine the range of the following temperature readings from the oven at Bon Appétit Bakery.
CHECK YOUR ANSWER WITH THE SOLUTION ON PAGE 752.
Review exeRcises
Calculate the mean of the following sets of values. round to the nearest tenth when
applicable.
1.
5 7 21 46 35 2 19 7
21
Section ii
85461_ch21_hr_711-761_2.indd 734 9/23/15 5:12 PM

Section ii • MeaSureS of central tendency and diSperSion—ungrouped data 735
3.
324 553 179 213 423 336 190 440 382 111 329 111 397
13
4.
4.87 4.32 5.43 6.3 9.4 7.25 5.13
determine the median of the following sets of values. round to the nearest tenth when
applicable.
5.
4 18 8 5 16 3 9 30 12
3 4 5 8 9 12 16 18 3
0
6.
56 34 28 60 48 55
28 34 48 55 56 60
7.
57 38 29 82 71 90 11 94 26 18 18
11 18 18 26 29 38 57 71 82 90 94
8.
$2.50 $3.25 $4.35 $1.22 $1.67 $4.59
9.
35% 51% 50% 23% 18% 67% 44% 52%
determine the mode of the following sets of values.
10.
8 3 5 6 3 7 2 1 8 2 4 3 6 2
8×2 3×3 5×1 6×2 7×1 2×3 1×1 4×1
Both 3 and 2 are modes in this set.
21 57 46 21 34 76 43 68 21 76 18 12
12.
$1,200 $7,300 $4,500 $3,450 $1,675
13.
4 9 3 5 4 7 1 9 9 4 7 1 8 1 4 6 7 4 6 9 9 2
determine the range of the following sets of values.
14.
184 237 256 359 36 71
Highest 359
Lowest −36
Range 323
number of credits earned foreach.
85461_ch21_hr_711-761_2.indd 735 9/23/15 5:12 PM

736 chapter 21 • BuSineSS StatiSticS and data preSentation
18. The following numbers represent the gallons of chocolate fudge syrup used per month by a Dairy
Queen to make hot fudge sundaes.
Jan.—225 Feb.—254 March—327 April—370 May—425 June—435
July—446 Aug.—425 Sept.—359 Oct.—302 Nov.—270 Dec.—241
a. What is the mean of this set of data?
b. What is the median of this set of data?
c. What is the mode of this set of data?
d. What is the range of this set of data?
19. You are the owner of The Dependable Delivery Service. Your company has four vehicles: a large
and a small van and a large and a small truck. The following set of data represents the number of
packages delivered last week.
Monday Tuesday Wednesday Thursday Friday
Small Van 67 86 94 101 86
Large Van 142 137 153 165 106
Small Truck 225 202 288 311 290
Large Truck 322 290 360 348 339
a. What is the mean number of packages delivered for each van?
b. What is the median number of packages delivered for each truck?
c. What is the mean number of packages delivered on Monday?
d. What is the median number of packages delivered on Thursday?
claSSrooM activity
Have students apply their knowledge
If three of the cars were valued at
$22,000, $28,000, and $34,000, what
22,000 +28,000 +34,000 +X
0
4=30,000
8
4,000 +X=4(30,000)
15.
48 42 54 28 112 76 95 27 36 11 96 196 191
16.
$2.35 $4.16 $3.42 $1.29 $.89 $4.55
ice Cream According to the U.S. Department
year. That translates to more than 21 pounds
per person.
has reported more than 5,700 stores in
19countries, including 652 locations
Andre Jenny/Alamy
17.
1,099 887 1,659 1,217 2,969 790
85461_ch21_hr_711-761_2.indd 736 9/23/15 5:12 PM
Section iii • Frequency DiStributionS—GroupeD Data 737
Frequency Distributions—GroupeD Data
In the previous section, the values in the sets are listed individually and are known as
ungrouped data. Frequently, business statistics deals with hundreds, even thousands, of
values in a set. In dealing with such a large number of values, it is often easier to represent the
ungrouped dataData that have not
been grouped into a distribution-type
format.
class of a frequency distribution.
StepS To ConsTruCT a FrequenCy DisTribuTion
Step 1. Divide the data into equal-size classes. Be sure to use classes that include all
values in the set.
e. What is the mode of all the packages delivered during the week?
f. What is the range of all the packages delivered during the week?
Business Decision: interpreting the numBers
20. You are the manager of a production plant that makes computer hard drives for Digital Storage
Corporation. Last week your plant had the following production numbers during a 6-day
production run:
2,300
2,430
2,018
2,540
2,675
4,800
a. What is the mean, median, mode, and range of this set of production data?
b. Which measure best describes the production at your plant? Why?
Section iii
21
constructinG a Frequency Distribution
frequency distribution or frequency
table The chart obtained by dividing data
into equal-size classes; used to organize
large amounts of data into a more compact
form without changing the essential
21-9
1. You are the vice president in charge of production for Endeavor Marine, Inc., a manufacturer of
custom fishing boats. The following figures represent the number of boats manufactured during
each of the past 18 months.
12
15
24
18
22
16
21
19
10
14
26
23
17
15
21
9
28
13
a. Group the data into five classes of equal size (5–9, 10–14, 15–19, 20–24, and 25–29) and
construct a frequency distribution of the number of boats.
Class Tally Frequency
5–9 | 1
b. Calculate the mean of the grouped data by using 7, 12, 17, 22, and 27 as the midpoints.
Roundthe mean to the nearest tenth if necessary.
Class Tally Frequency ( f ) Midpoint (m)f × m
5–9 | 1 7 7
18
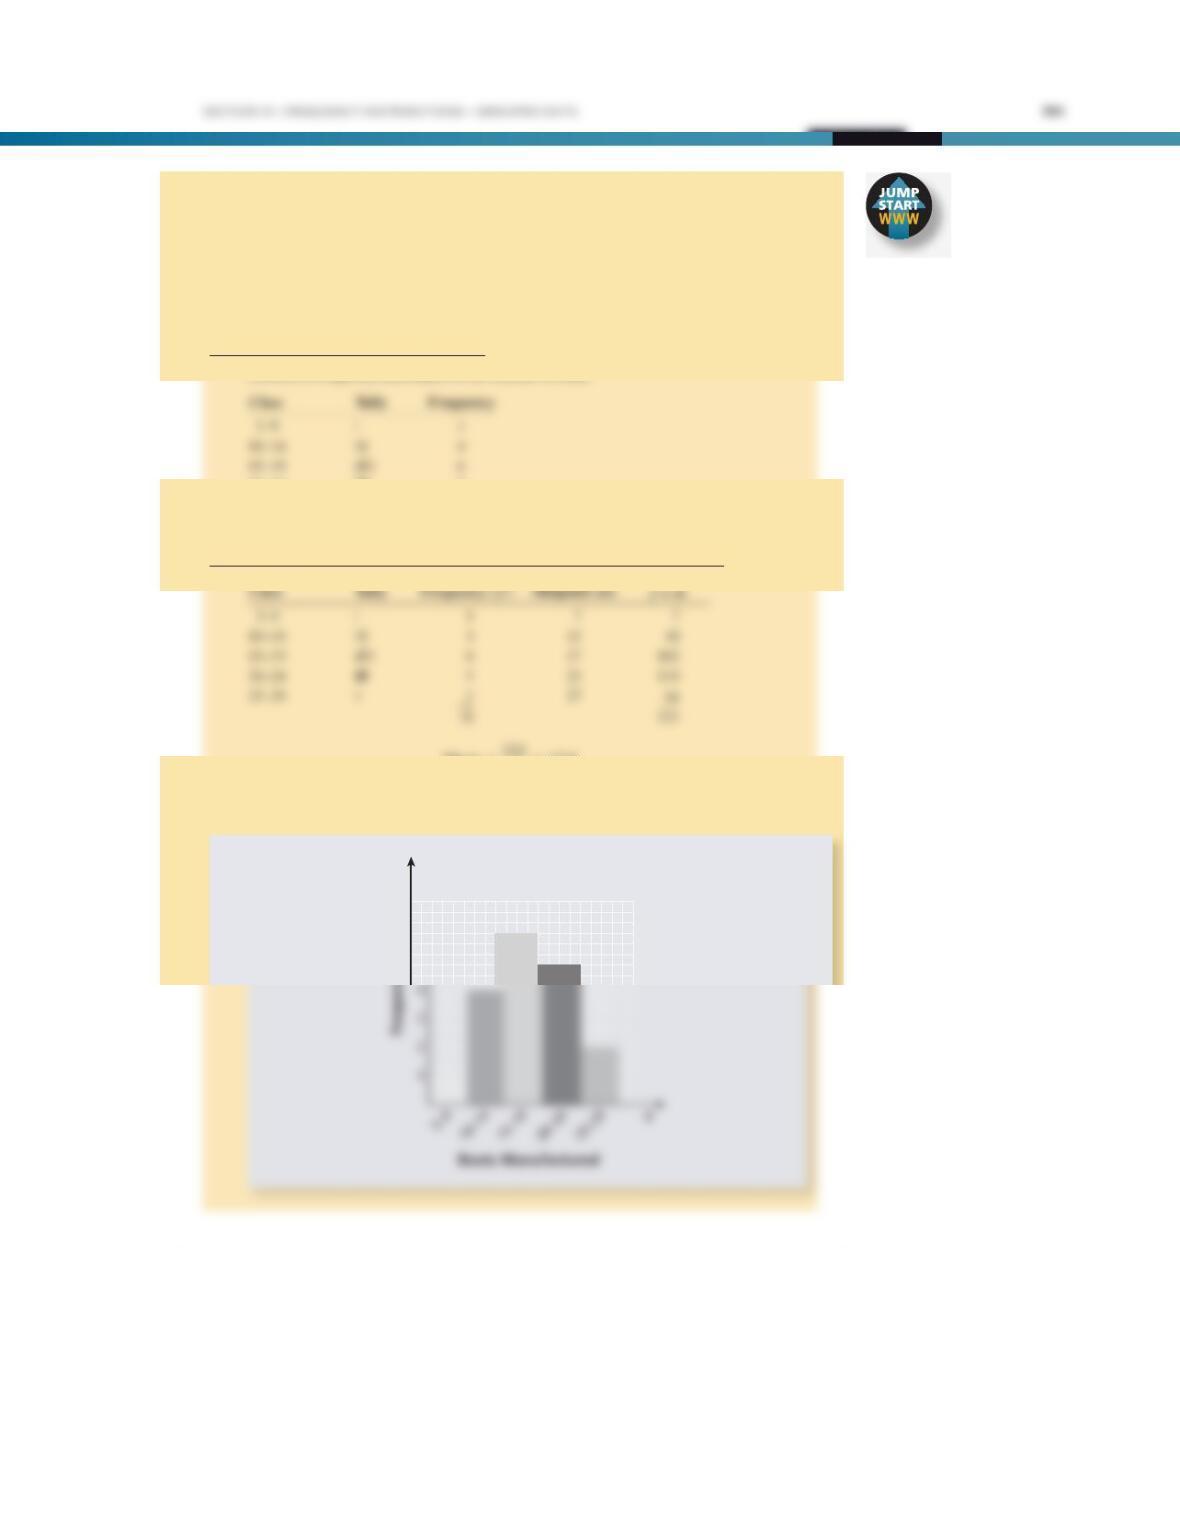
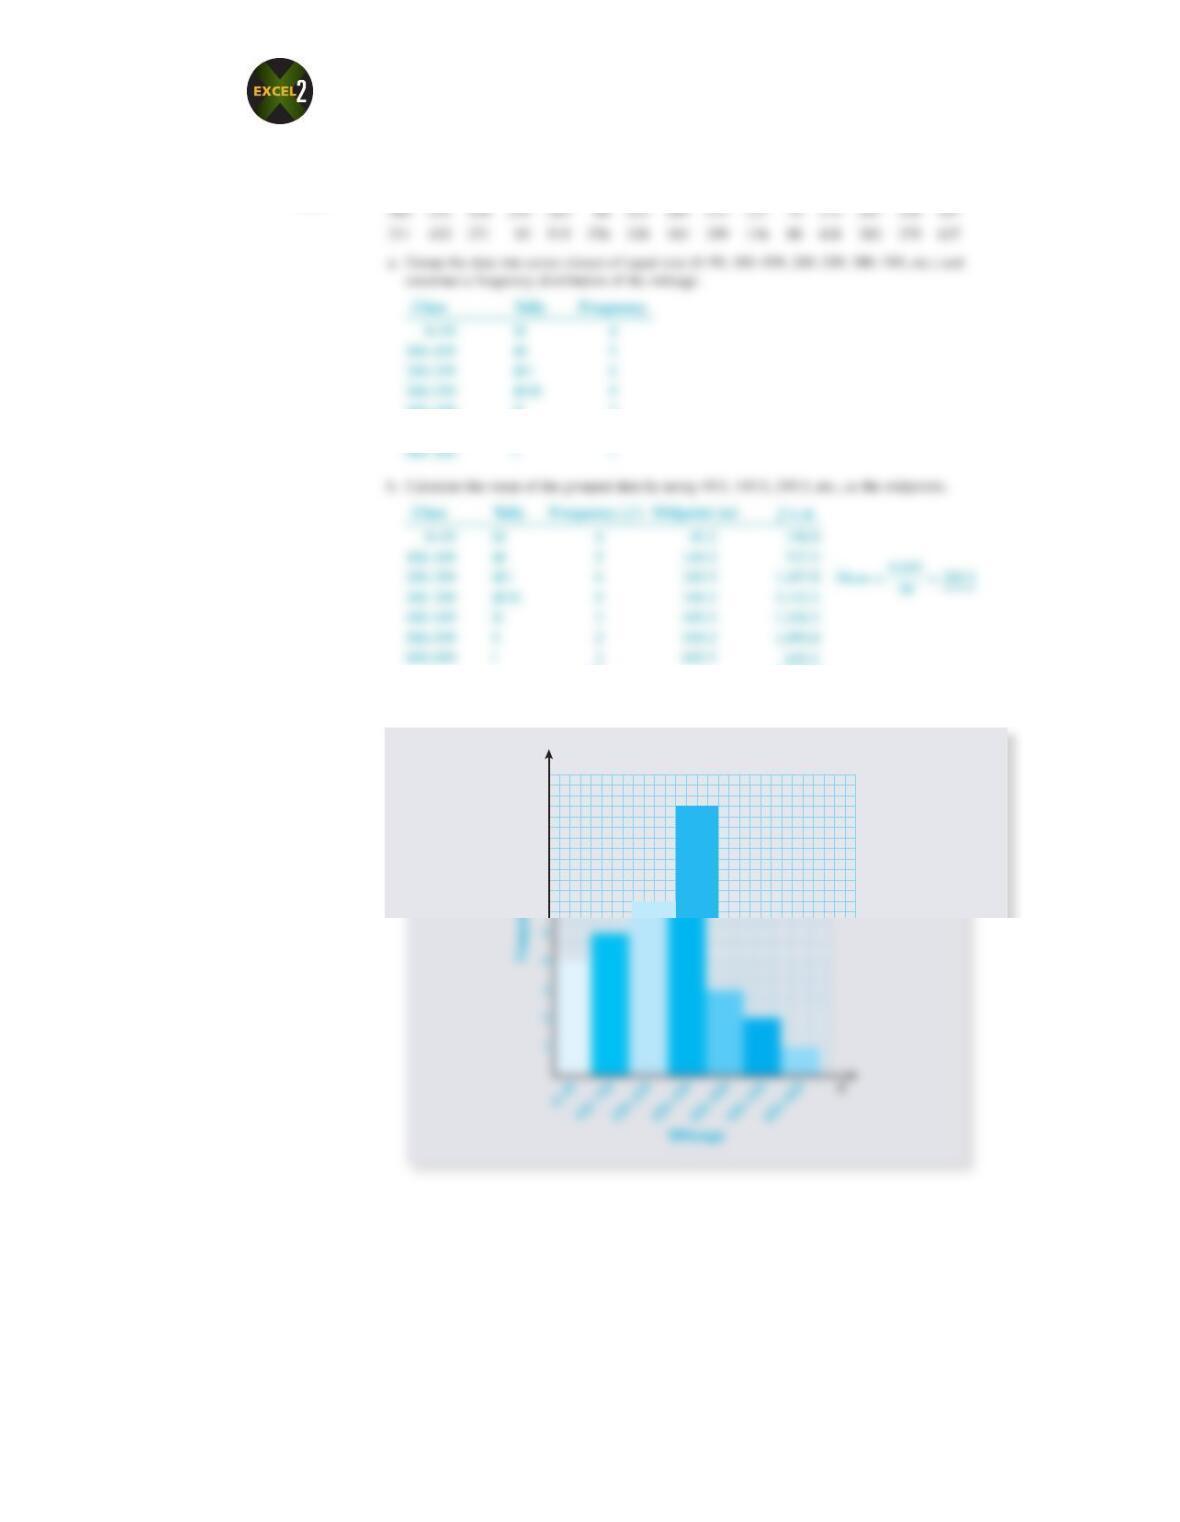
c. Construct a histogram of these data to graphically illustrate your company’s boat
manufacturing figures.
7
6
5
y
85461_ch21_hr_711-761_3.indd 741 9/23/15 5:13 PM
742 chapter 21 • buSineSS StatiSticS anD Data preSentation
2. You are the sales manager of the Esquire Sportswear Company. Last week your 30 salespeople
reported the following automobile mileage while making sales calls to retail stores around the
state:
385 231 328 154 283 86 415 389 575 117 75 173 247 316 357
211 432 271 93 515 376 328 183 359 136 88 438 282 375 637
a. Group the data into seven classes of equal size (0–99, 100–199, 200–299, 300–399, etc.) and
b. Calculate the mean of the grouped data by using 49.5, 149.5, 249.5, etc., as the midpoints.
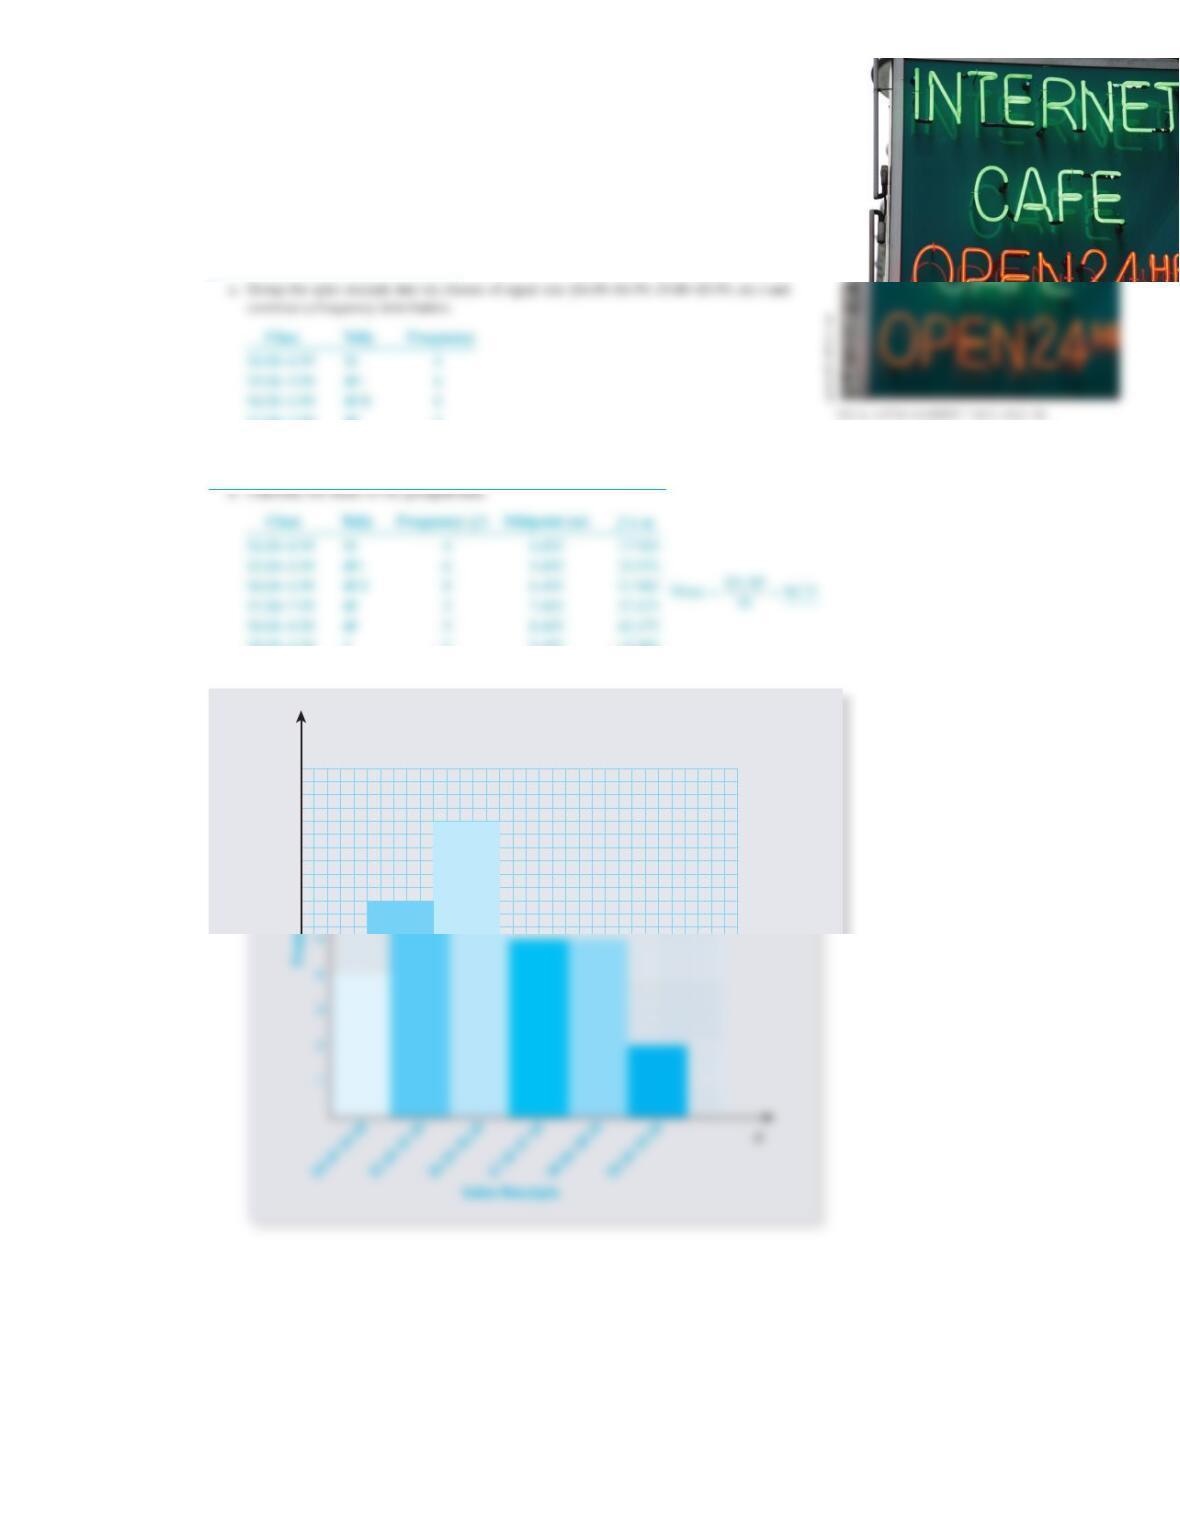
c. Using the grid provided below, prepare a histogram of these data to illustrate your
salespeoples’ mileage graphically.
9
8
7
6
y
85461_ch21_hr_711-761_3.indd 742 9/23/15 5:13 PM
Section iii • Frequency DiStributionS—GroupeD Data 743
3. You are the owner of the Internet Café. As part of a marketing effort to increase the “average
sale” per customer, you recently did a survey of the lunch-hour sales receipts for a busy Saturday.
Following are the results of that survey.
$4.15 $5.60 $4.95 $6.70 $5.40 $7.15 $6.45 $8.25 $7.60 $6.25
$5.50 $4.90 $7.60 $6.40 $7.75 $5.25 $6.70 $8.45 $7.10 $8.80
$9.65 $8.40 $6.50 $5.25 $6.75 $8.50 $5.35 $6.80 $4.25 $9.95
a. Group the sales receipts into six classes of equal size ($4.00–$4.99, $5.00–$5.99, etc.) and
construct a frequency distribution.
Class Tally Frequency
b. Calculate the mean of the grouped data.
Class Tally Frequency ( f ) Midpoint (m)f × m
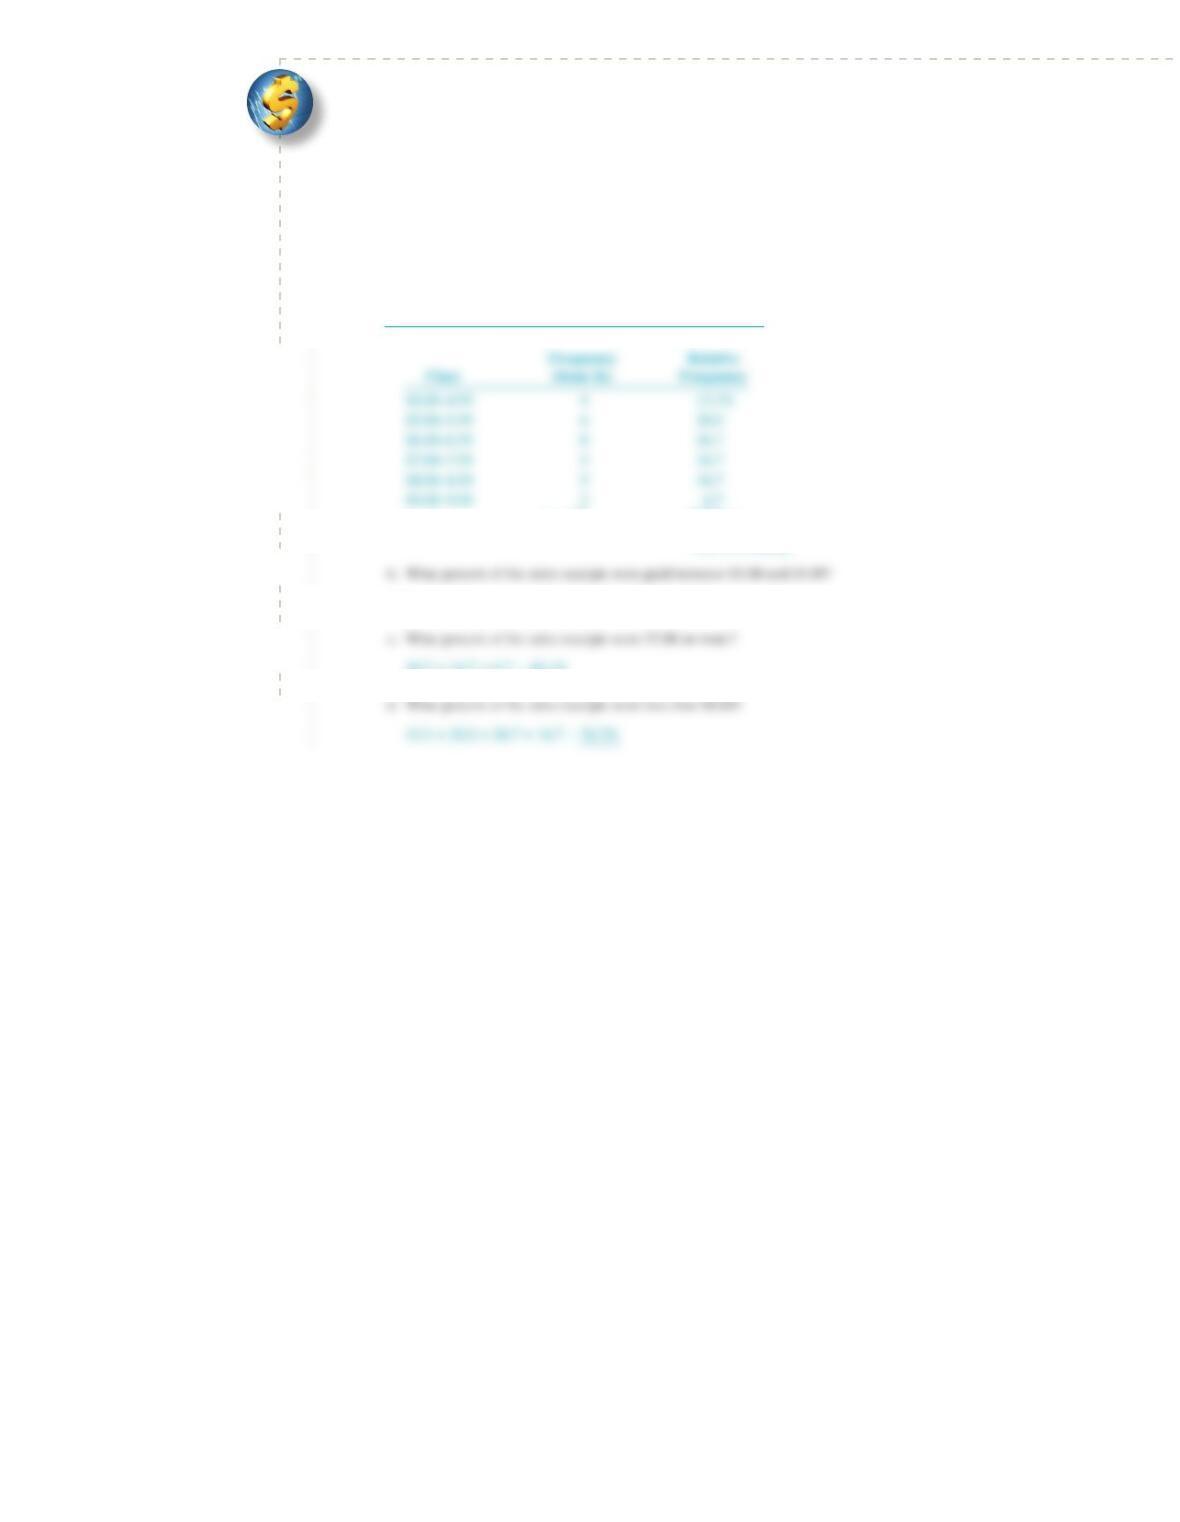
c. Using the grid provided below, prepare a histogram of the sales receipts.
8
7
6
8
7
6
y
744 chapter 21 • buSineSS StatiSticS anD Data preSentation
Business Decision: relative Frequency DistriBution
4. In business, percents are frequently used to represent the portion of observations falling within
classes of a frequency distribution. A relative frequency distribution expresses the distribu-
tion as percents. To convert a frequency distribution to a relative frequency distribution, divide
eachof the class frequencies (portion) by the total number of observations (base). Remember,
Rate = Portion ÷ Base.
a. From the frequency distribution you constructed for the Internet Café in Exercise 3a, convert
each class frequency to a relative class frequency, percents. Round your answers to tenths.
Class
Frequency
(from 3a)
Relative
Frequency
$4.00–4.99 4 13.3%
b. What percent of the sales receipts were paid between $5.00 and $5.99?
c. What percent of the sales receipts were $7.00 or more?
d. What percent of the sales receipts were less than $8.00?
85461_ch21_hr_711-761_3.indd 744 9/23/15 5:13 PM