Chapter 21
Business Statistics and Data Presentation
Student Performance Objectives:
Section I Data Interpretation and Presentation
21-1 Reading and Interpreting Information from Tables
Section II Measures of Central Tendency and Dispersion – Ungrouped Data
21-5 Calculating the Arithmetic Mean of Ungrouped Data
Section III Frequency Distributions – Grouped Data
21-9 Constructing a Frequency Distribution
21-11 Preparing a Histogram of a Frequency Distribution
Chapter Notes, Teaching Tips and Lecture Launchers
• Spotlight: Review with students the Performance Objectives at the beginning of this chapter.
• Have them note that the chapter is divided into three sections. Section I introduces
• Lecture Launcher: Point out to students that business statistics is the systematic process of
collecting, interpreting, and presenting numerical data about business situations. In business,
statistics is organized into two categories, descriptive statistics and statistical inference.
• Be sure students understand the difference between internal sources of information, such as
company records and external sources, such as government and industry publications.
• Remind students that the word “data” is the plural of the word “datum”.
• The Collaborative Learning Activity for this chapter, “Conducting a Marketing Research
• Spotlight: The Business Decision for this chapter, “Beat the Mean Bonus!” puts the students
in the role of owning a car dealership and using a unique bonus plan to pay the sales staff.
• Spotlight: Invite an insurance company actuary, marketing research person, or Six Sigma
Black Belt to class as a guest speaker. Have him or her discuss:
• The importance and variety of uses of statistics in today’s business world.
Section I Data Interpretation and Presentation
• Lecture Launcher: Open up for discussion why we use charts and tables – What are the
advantages over numerical data in sentence form?
• Collaborative Learning Activities: In groups, have students bring to class examples of tables
and charts found in newspapers and magazines.
• Classroom Activity: Discuss the Business Decision “Choosing a Chart” at the end of Section
I in class. Have the students consider each type of chart to determine which one would best
illustrate the data.
• Have students keep in mind that many current software programs such as Microsoft’s Excel
and PowerPoint, Lotus 123 and Harvard Graphics are designed to generate data in chart
form.
• Be sure students know that a line chart shows data changing over a period of time. The
x-axis is used to measure units of time and the y-axis shows the magnitude of something.
• Use Exhibits 21-1 and 21-2 to illustrate single and multiple line charts
• Call attention to the importance of the “scale” chosen for a chart.
• Demonstrate on the board how different scales can change the “look” of a chart.
• Have students keep in mind that there are three types of bar charts; standard, component
and comparative.
• Use Exhibits 21-3, 21-4, and 21-5, to illustrate these bar charts.
• Be sure students understand that a pie chart is a circle divided into section, usually expressed
in percentage form, representing the component parts of a whole.
• Spotlight: If 360 degrees represents 100% of a pie chart, then each percent is
represented by 3.6 degrees.
rcentdegrees/pe 3.6
percent 100
degrees 360 =
Section II Measures of Central Tendency and Dispersion – Ungrouped Data
• Lecture Launcher: Ask students to discuss what average means. Point out that average can
mean “typical” in a nonmathematical sense. As the students to describe the “average
• Collaborative Learning Activities: In groups of two’s, have students work to following.
• Try-It Exercise 11, calculating the mean.
• Have students discuss examples of how the mean is used in reporting various
statistics. (Sports, economics, weather, crime, . . . )
• Examples might include bowling average, baseball player batting
• Classroom Activity: Divide the class into two groups. Have each group calculate the mean,
median, and mode of the age of the group members.
• Next, have them calculate the same information for the class as a whole. Discuss the
difference in the results, if any.
• Classroom Activity: Olympic-type events are scored by dropping the highest and lowest
numbers in the set of judge’s scores. Ask students how this can affect the outcome and why
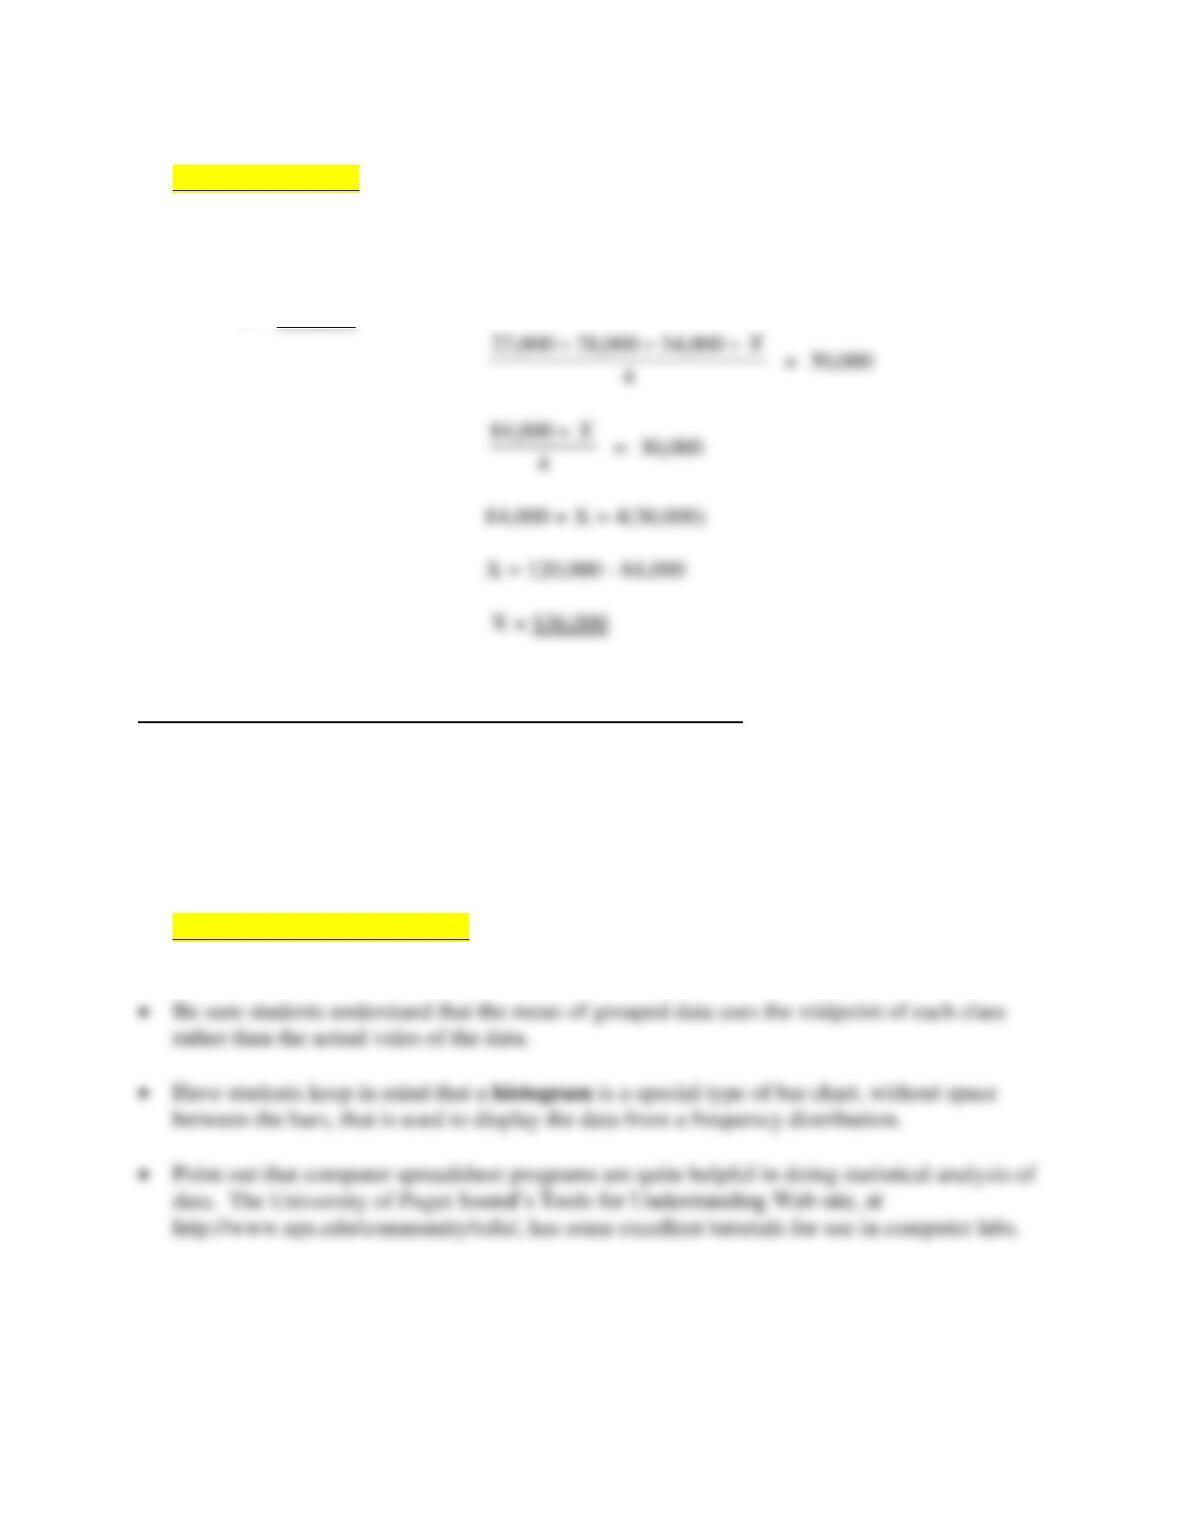
• Classroom Activity: Have students apply their knowledge of equations to solve the
following “challenge” problem:
• Yesterday, a car dealer sold four cars with a mean value of $30,000. If three of the
cars were valued at $22,000, $28,000 and $34,000, what was the value of the fourth
car?
• Solution:
Section III Frequency Distributions – Grouped Data
• Point out to students that frequently, business statistics deals with hundreds or even
thousands of values in a set. In dealing with such large amounts of values it is often easier to
represent the data by dividing the values into groups, creating grouped data.
• The number of values in each class is called the frequency, with the resulting chart
called a frequency distribution.
• Collaborative Learning Activity: In groups, have students work Try-It Exercise 16. Next,
have the groups compare answers with those of another group and resolve any differences.
Questions Students Always Ask
“Do I really need to know statistics?”
• Only if you want to be competitive in the workforce marketplace! Statistics help you see
the bigger picture of what’s going on in your organization or society, a picture that cannot
“I’ve heard that statistics lie. Can I trust statistics?”
• Yes, if you understand how the statistics were derived and what the terms mean. So