Level 2
Chapter 21 – Section I – Exercise 2
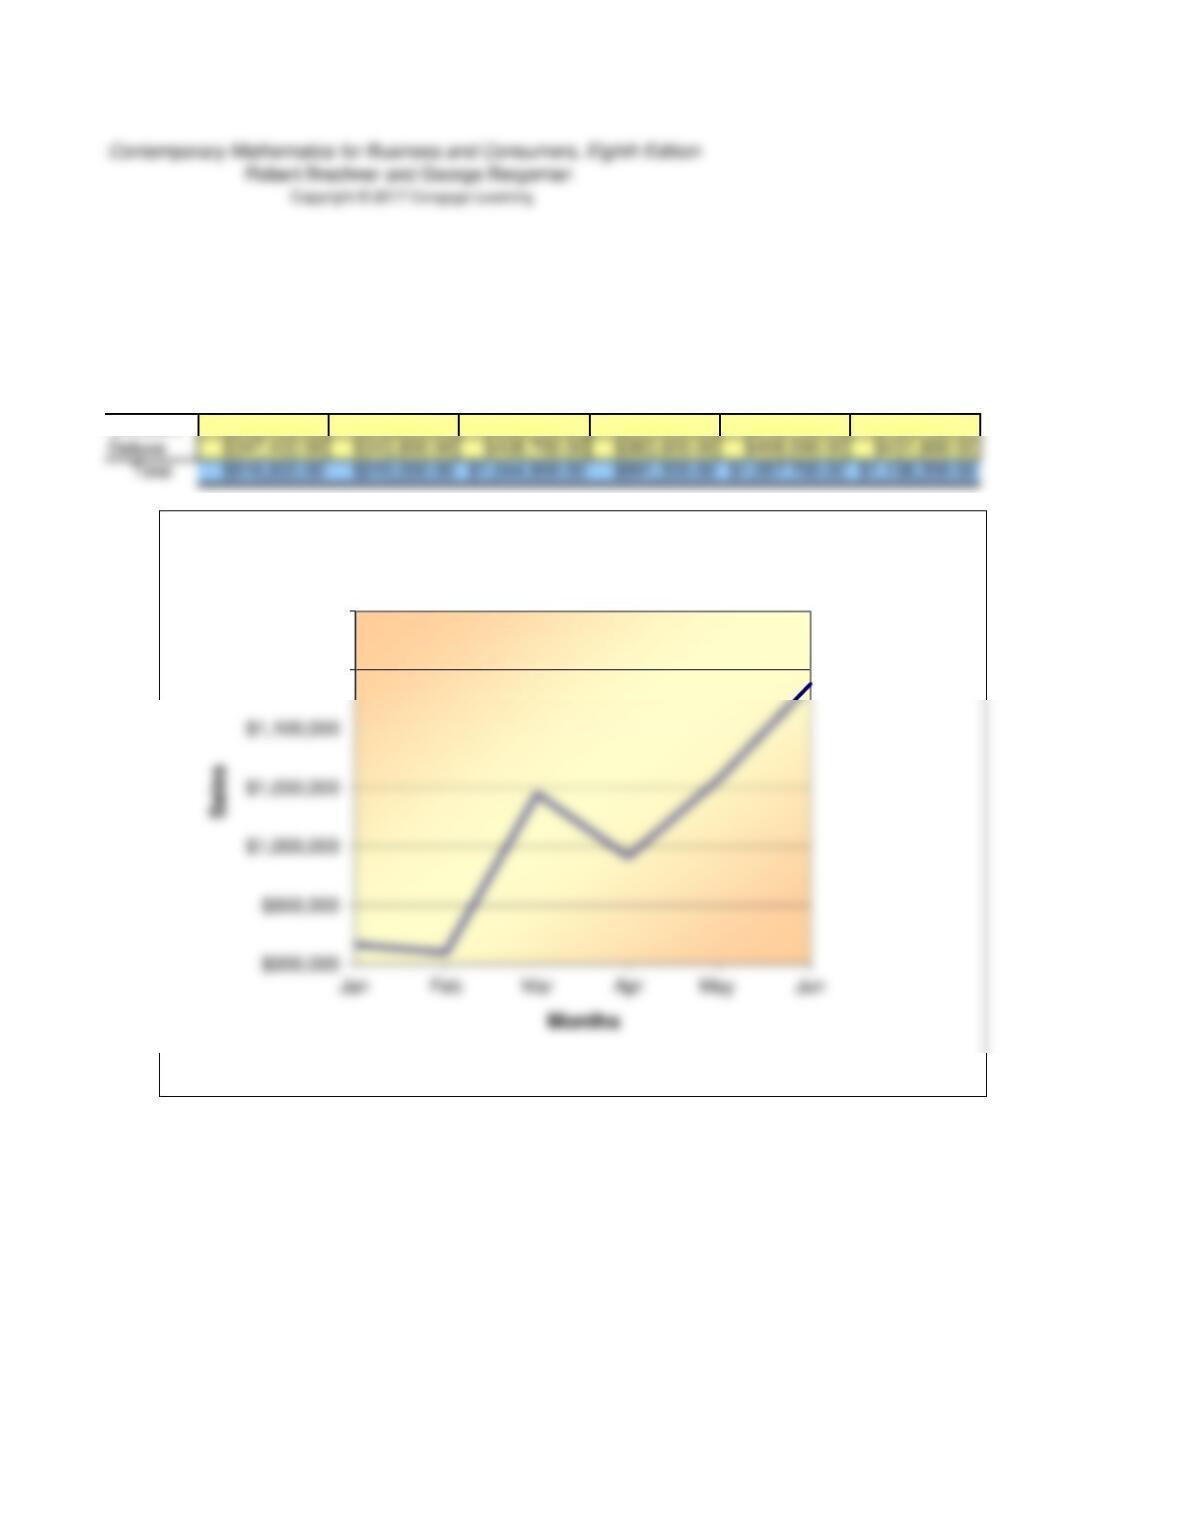
As the sales manager for Magnum Enterprises, you have been asked by the president to prepare a
single-line chart of the total company sales per month for the shareholders’ meeting next week. Use
the 6-month sales report, Table 21-1, as the database for this chart. Calculate totals as required:
Jan Feb Mar Apr May Jun
Standard $569,400.00 $566,200.00 $636,100.00 $607,400.00 $649,700.00 $706,700.00
$1,150,000
$1,200,000
Total Sales Per Month
Level 1
Chapter 21 – Section I – Exercise 3
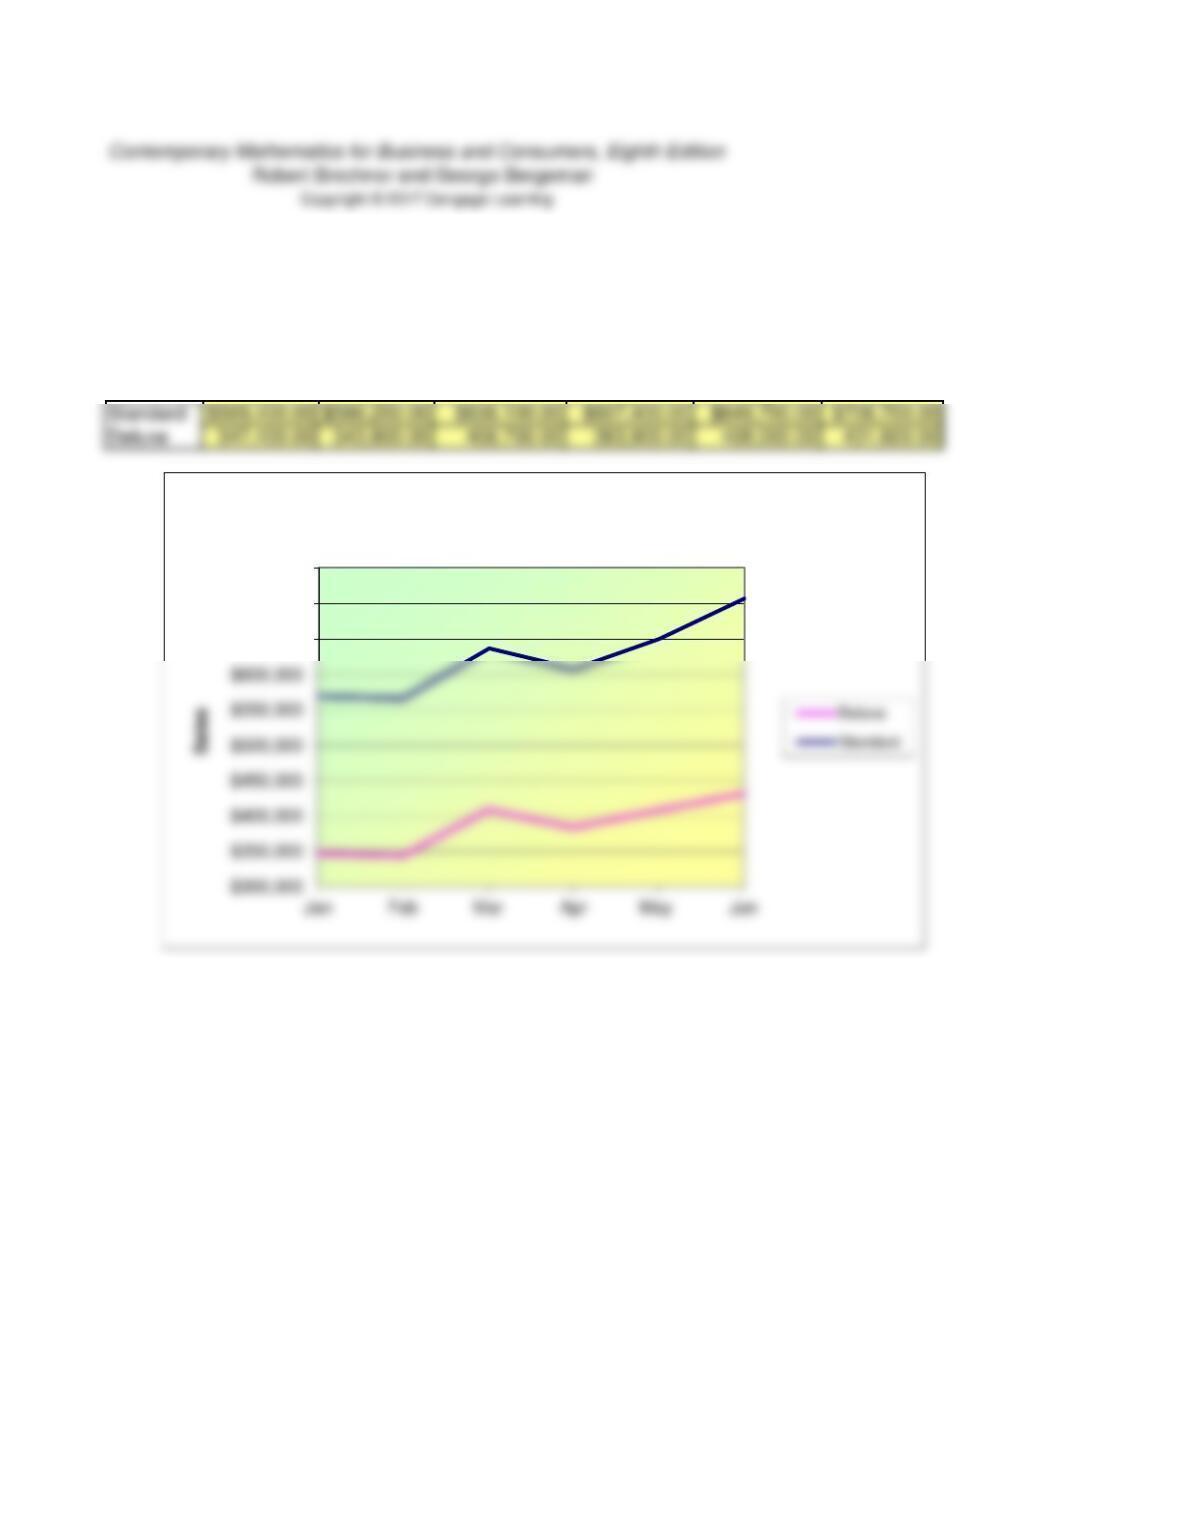
Construct a multiple-line chart of the total sales per month of each model, standard and deluxe.
Use Table 21-1 as the database for this chart.
Jan Feb Mar Apr May Jun
$650,000
$700,000
$750,000
Sales Per Month
Level 1
Chapter 21 – Section I – Exercise 4
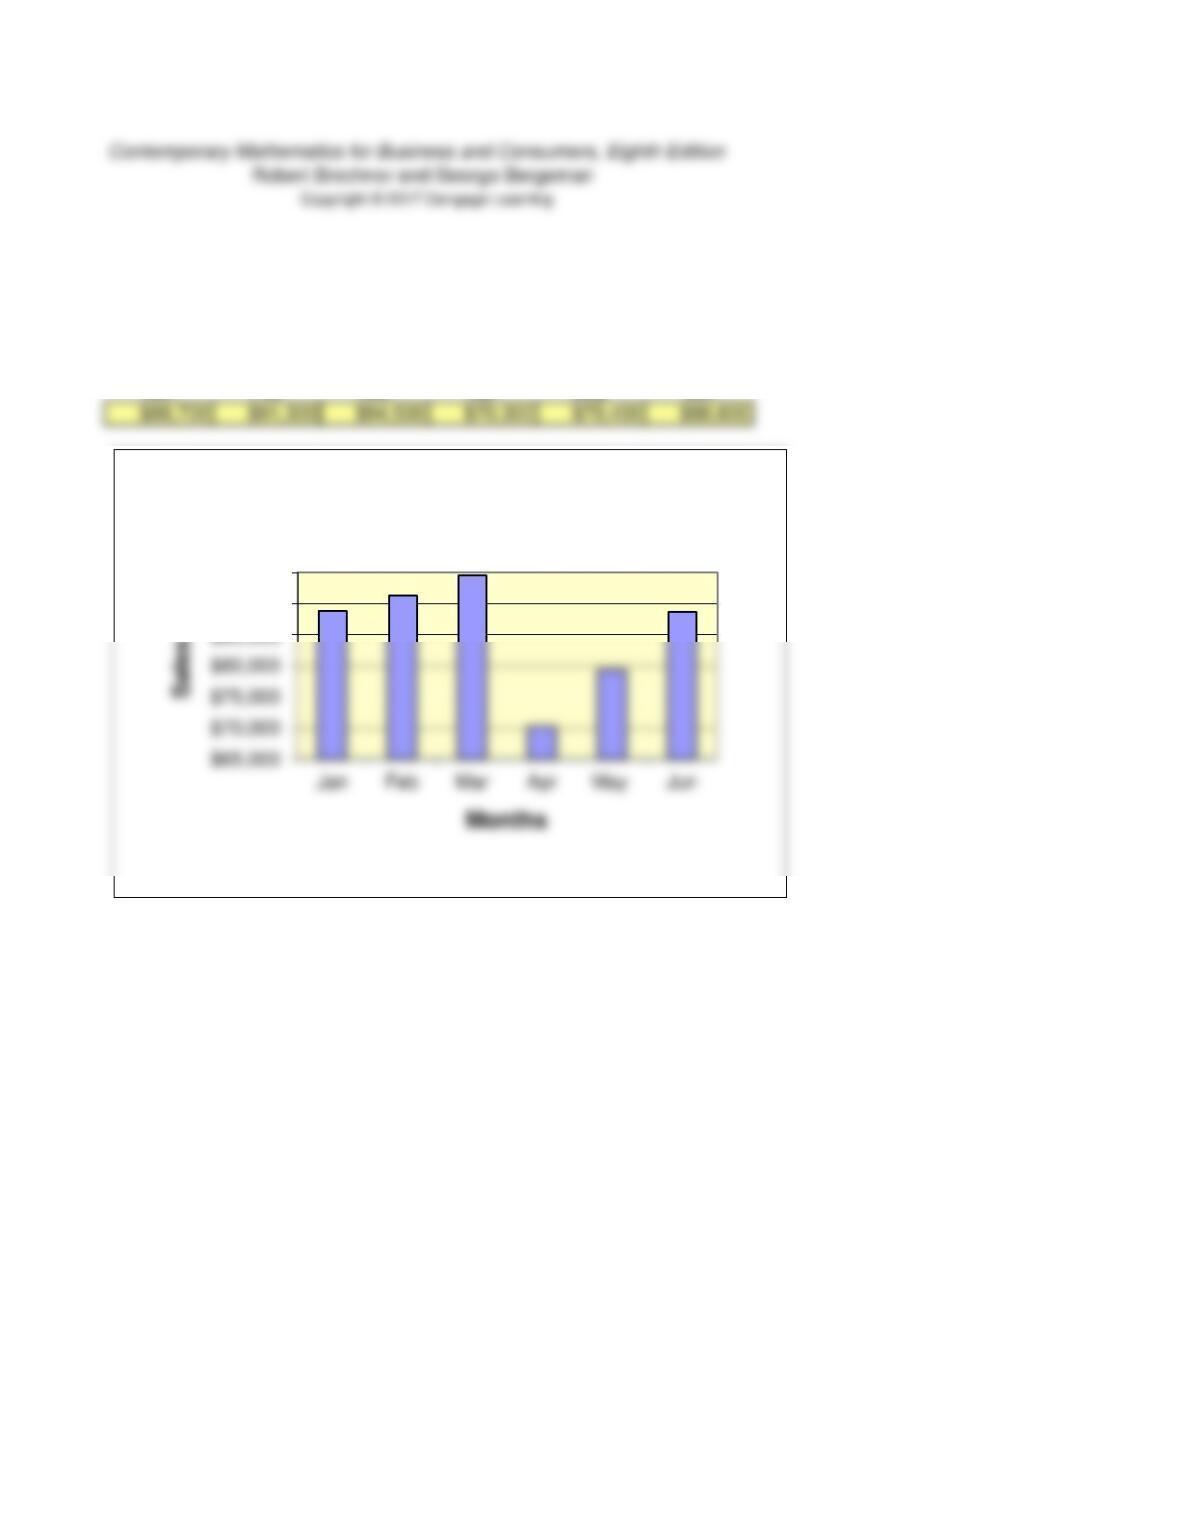
Construct a standard bar chart of the deluxe sales per month in the Southeast territory.
Use Table 21-1 as the database for this chart.
Jan Feb Mar Apr May Jun
$85,000
$90,000
$95,000
Deluxe Sales Per Month – Southeast Territory
Level 1
Chapter 21 – Section I – Exercise 5
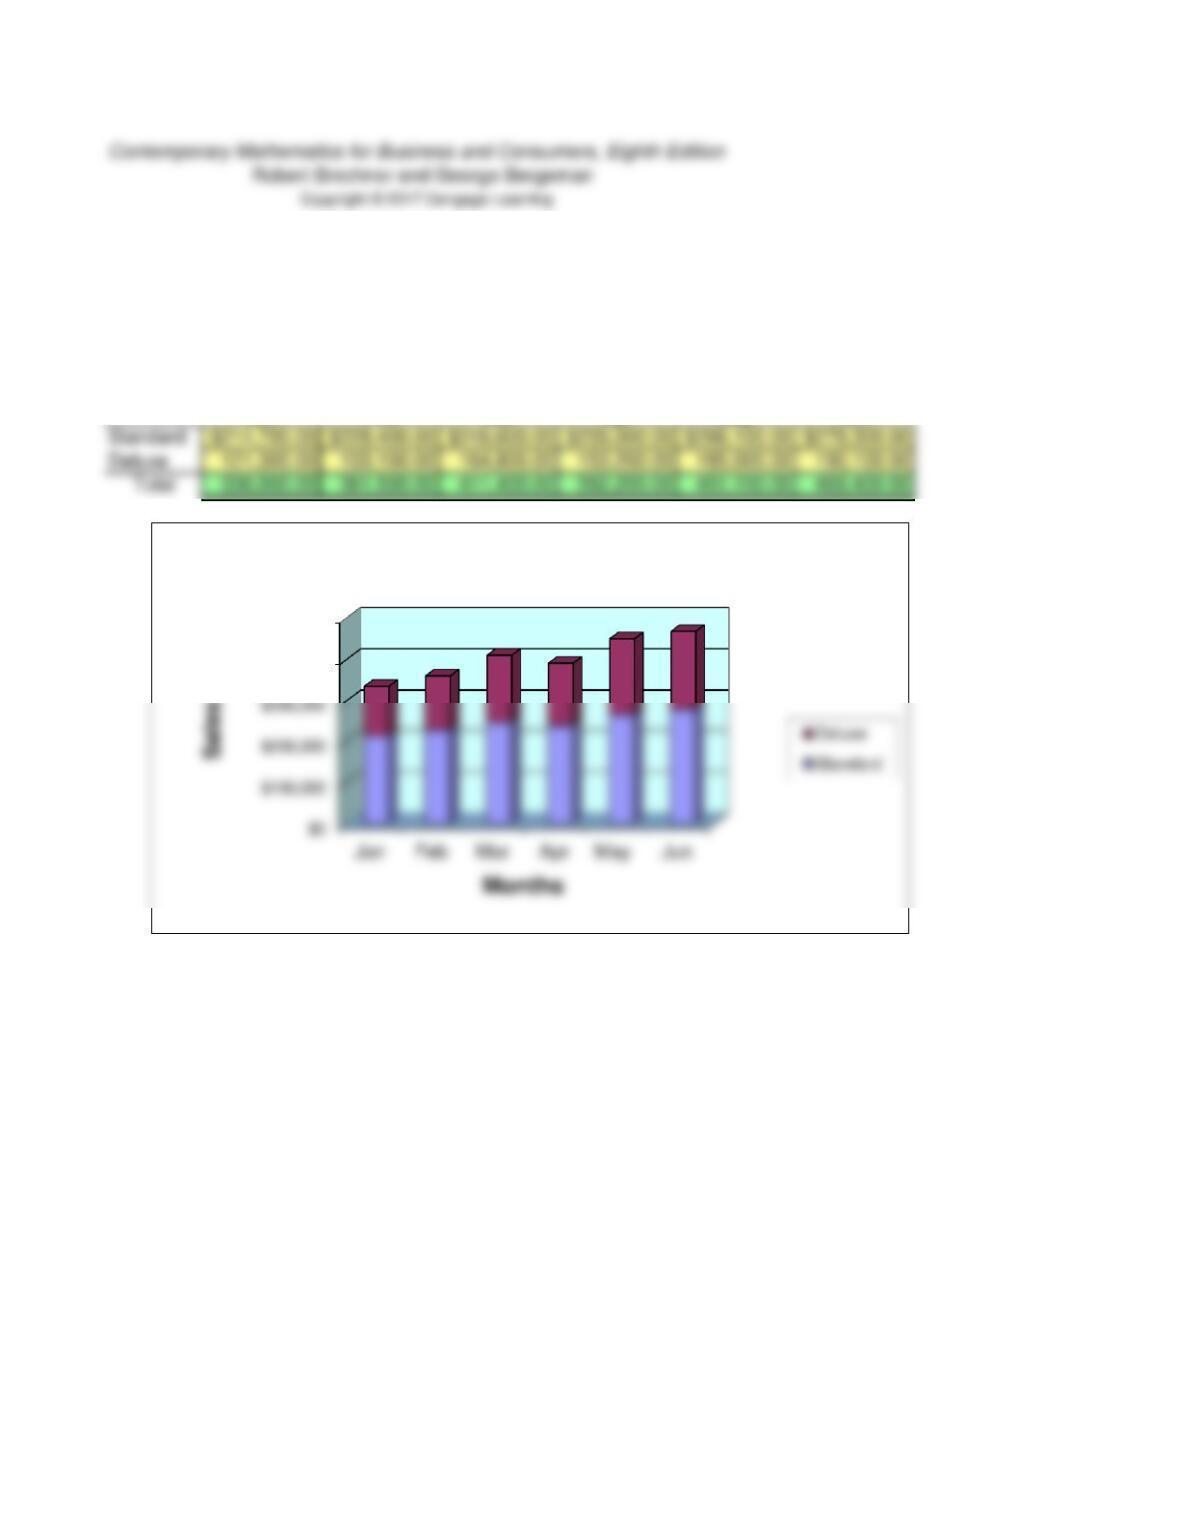
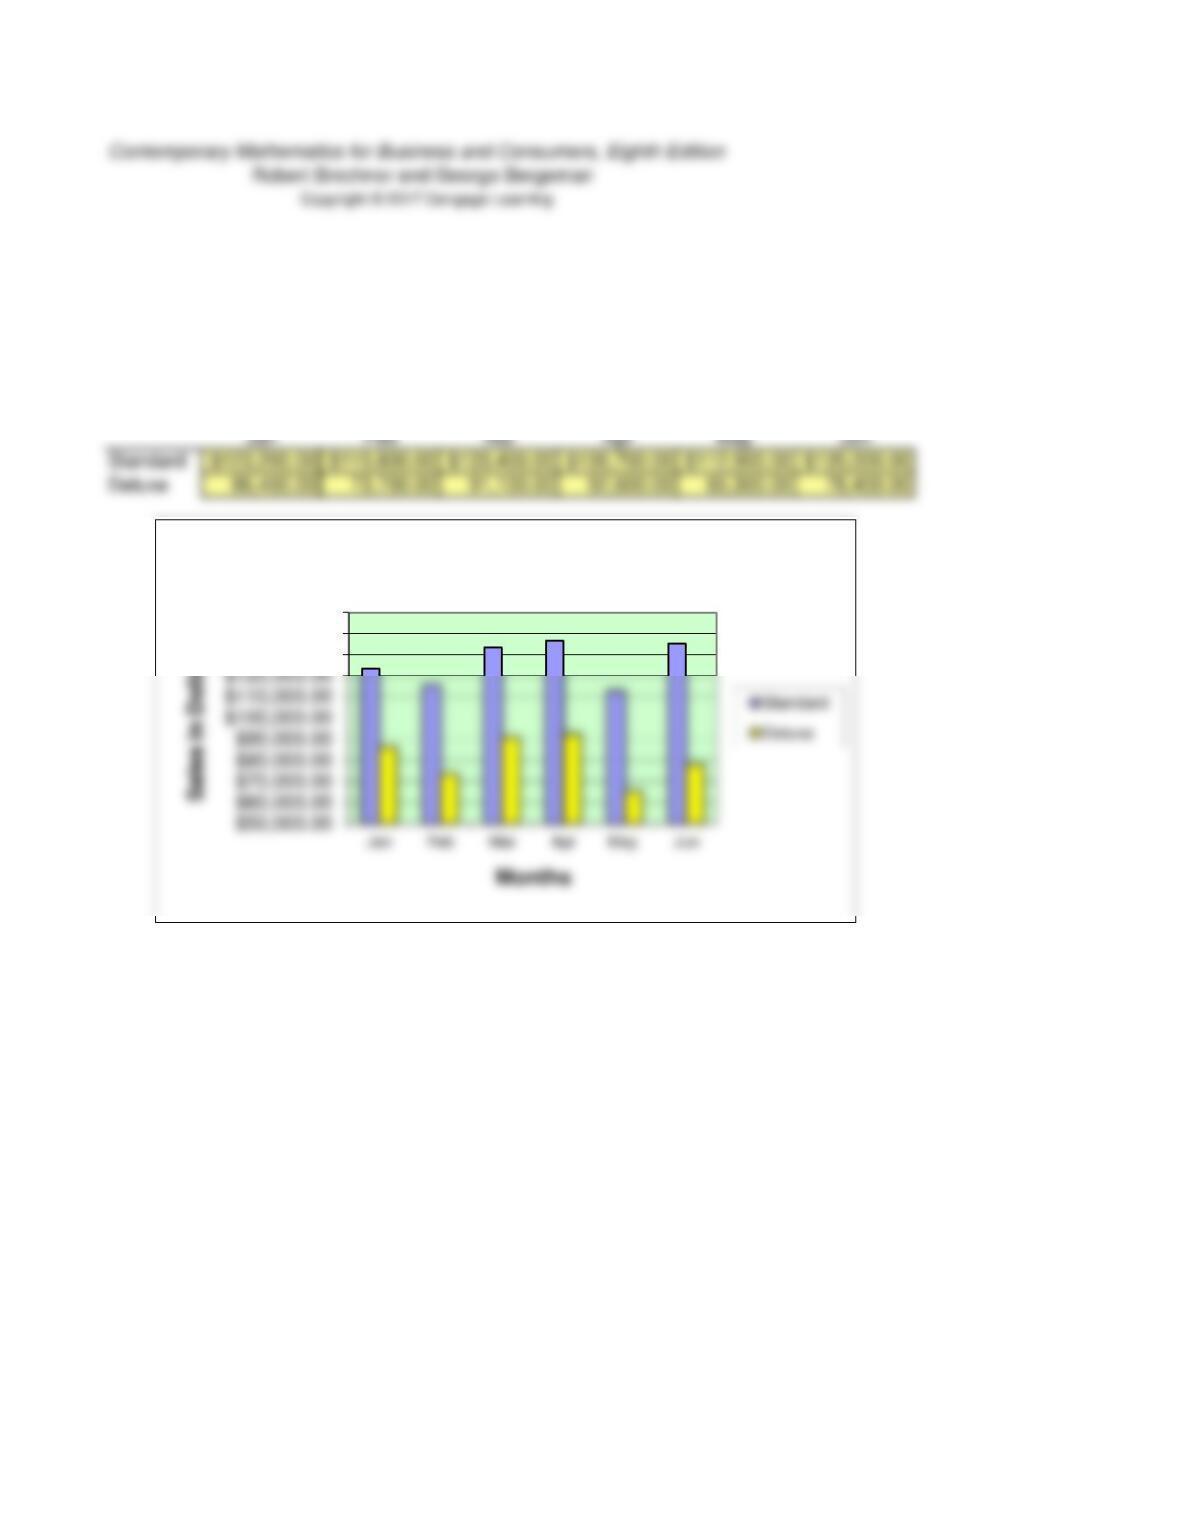
Construct a component bar chart of the standard and deluxe model sales as components of total
monthly sales in the Northeast territory.
Use Table 21-1 as the database for this chart.
Jan Feb Mar Apr May Jun
$400,000
$500,000
Standard/Deluxe Per Month
Level 3
Chapter 21 – Section I – Exercise 6
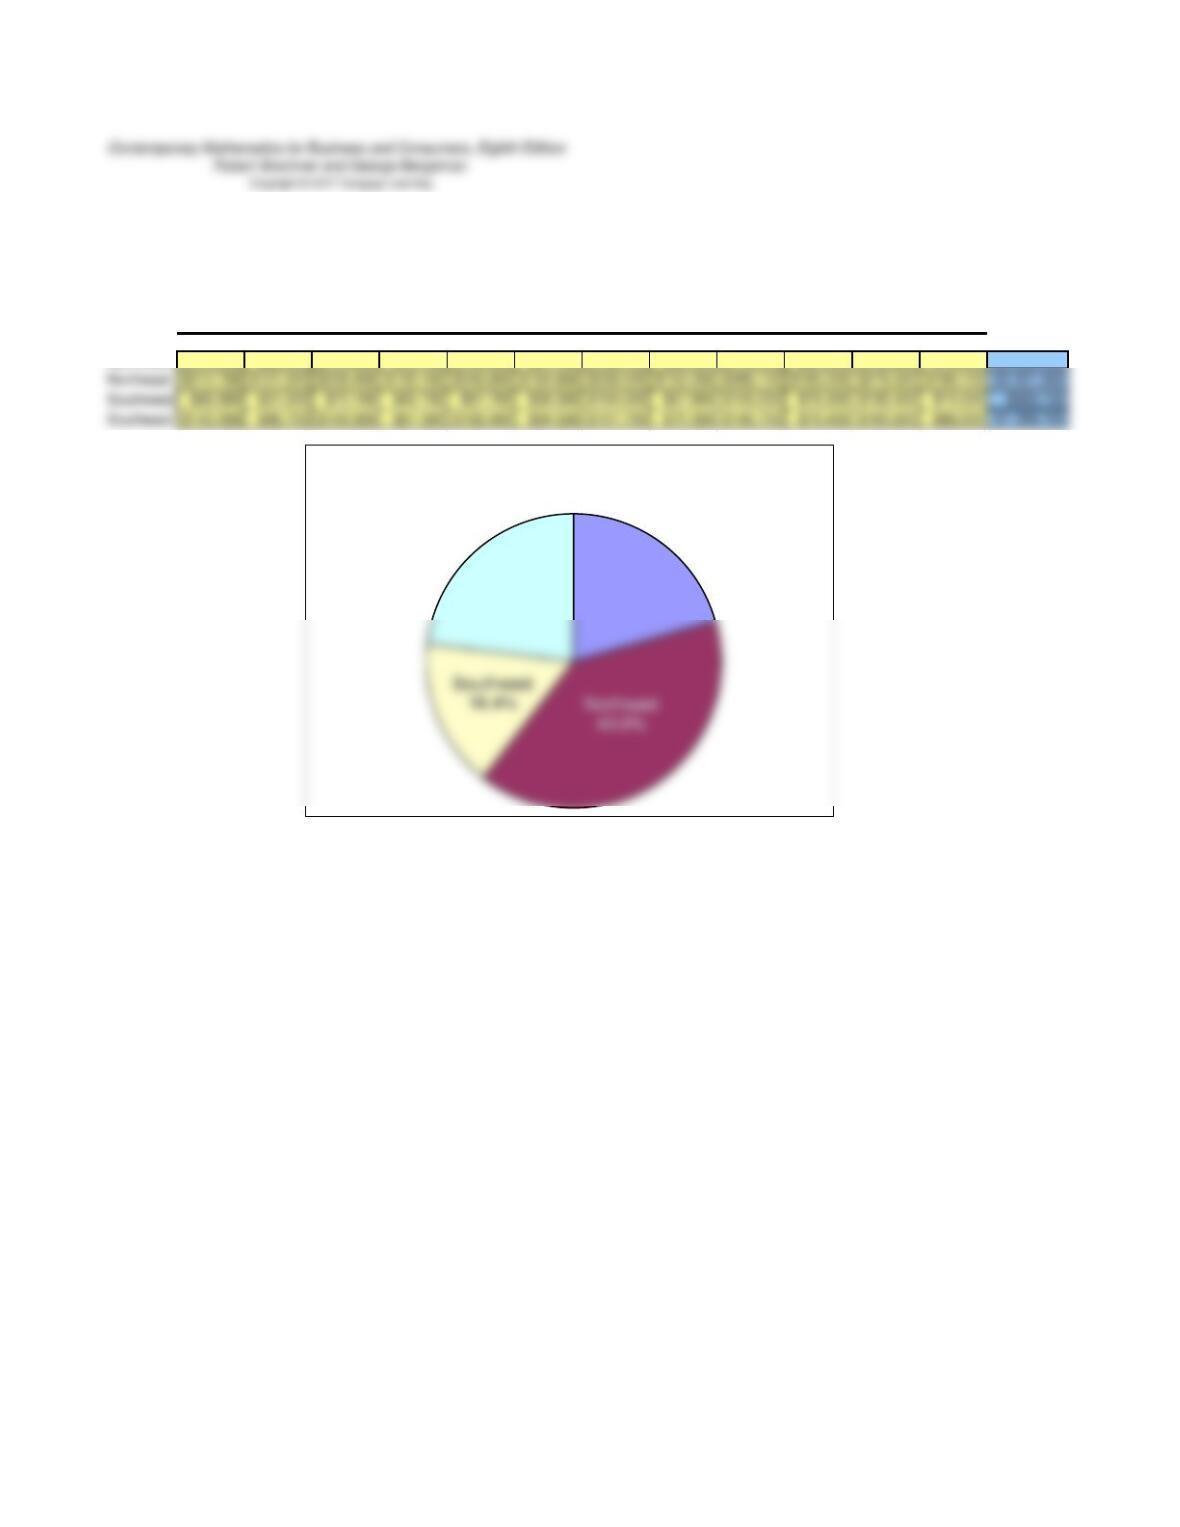
Construct a comparative bar chart of the standard and deluxe model sales per month in the Northwest
territory.
Use Table 21-1 as the database for this chart.
$130,000.00
$140,000.00
$150,000.00
Standard/Deluxe Sales Per Month
Level 2
Chapter 21 – Section I – Exercise 7
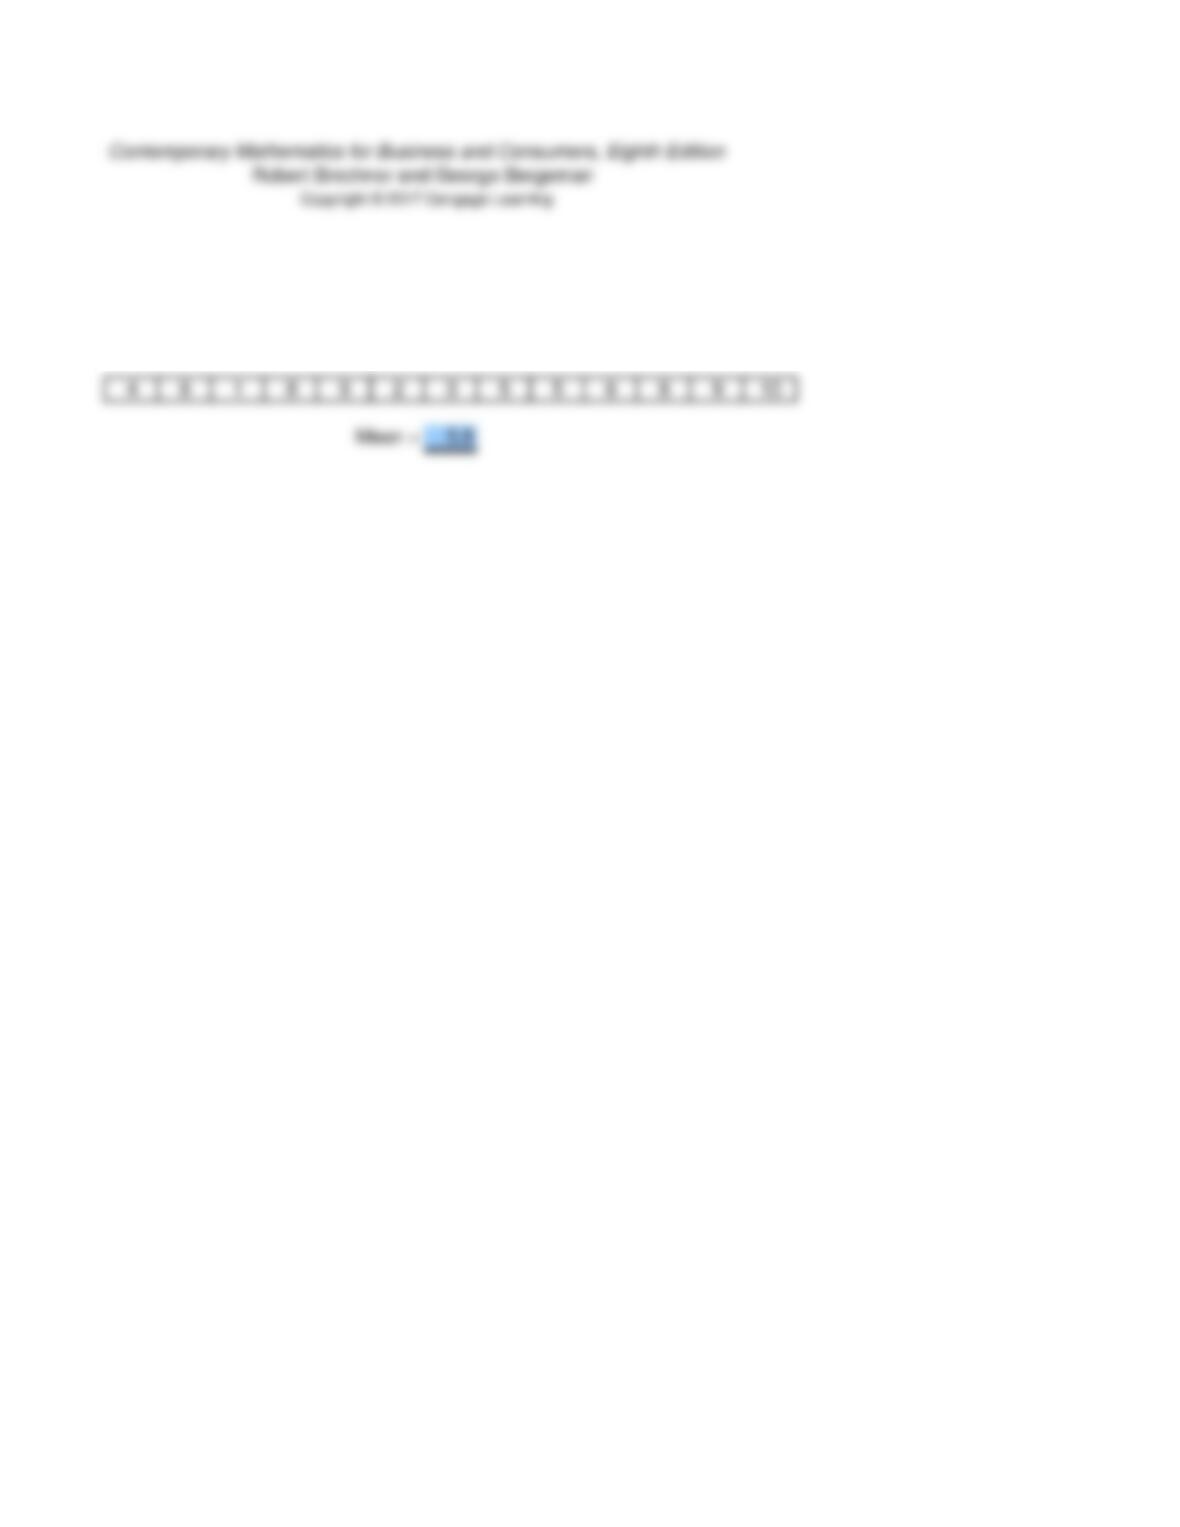
Using the 6-month sales report, Table 21-1, as the database, prepare a pie chart of the
total 6-month sales of the four territories.
Standard Deluxe Standard Deluxe Standard Deluxe Standard Deluxe Standard Deluxe Standard Deluxe
Northwest $123,200 $86,400 $115,800 $73,700 $133,400 $91,100 $136,700 $92,600 $112,900 $65,300 $135,000 $78,400 $1,244,500
Mar
Feb
Jan
Total Sales
Jun
May
Apr
Northwest
20.5%
Southeast
23.1%
6-month Sales by Territory as a Percent of Total
Sales
Level 2
Chapter 21 – Section II – Exercise 2
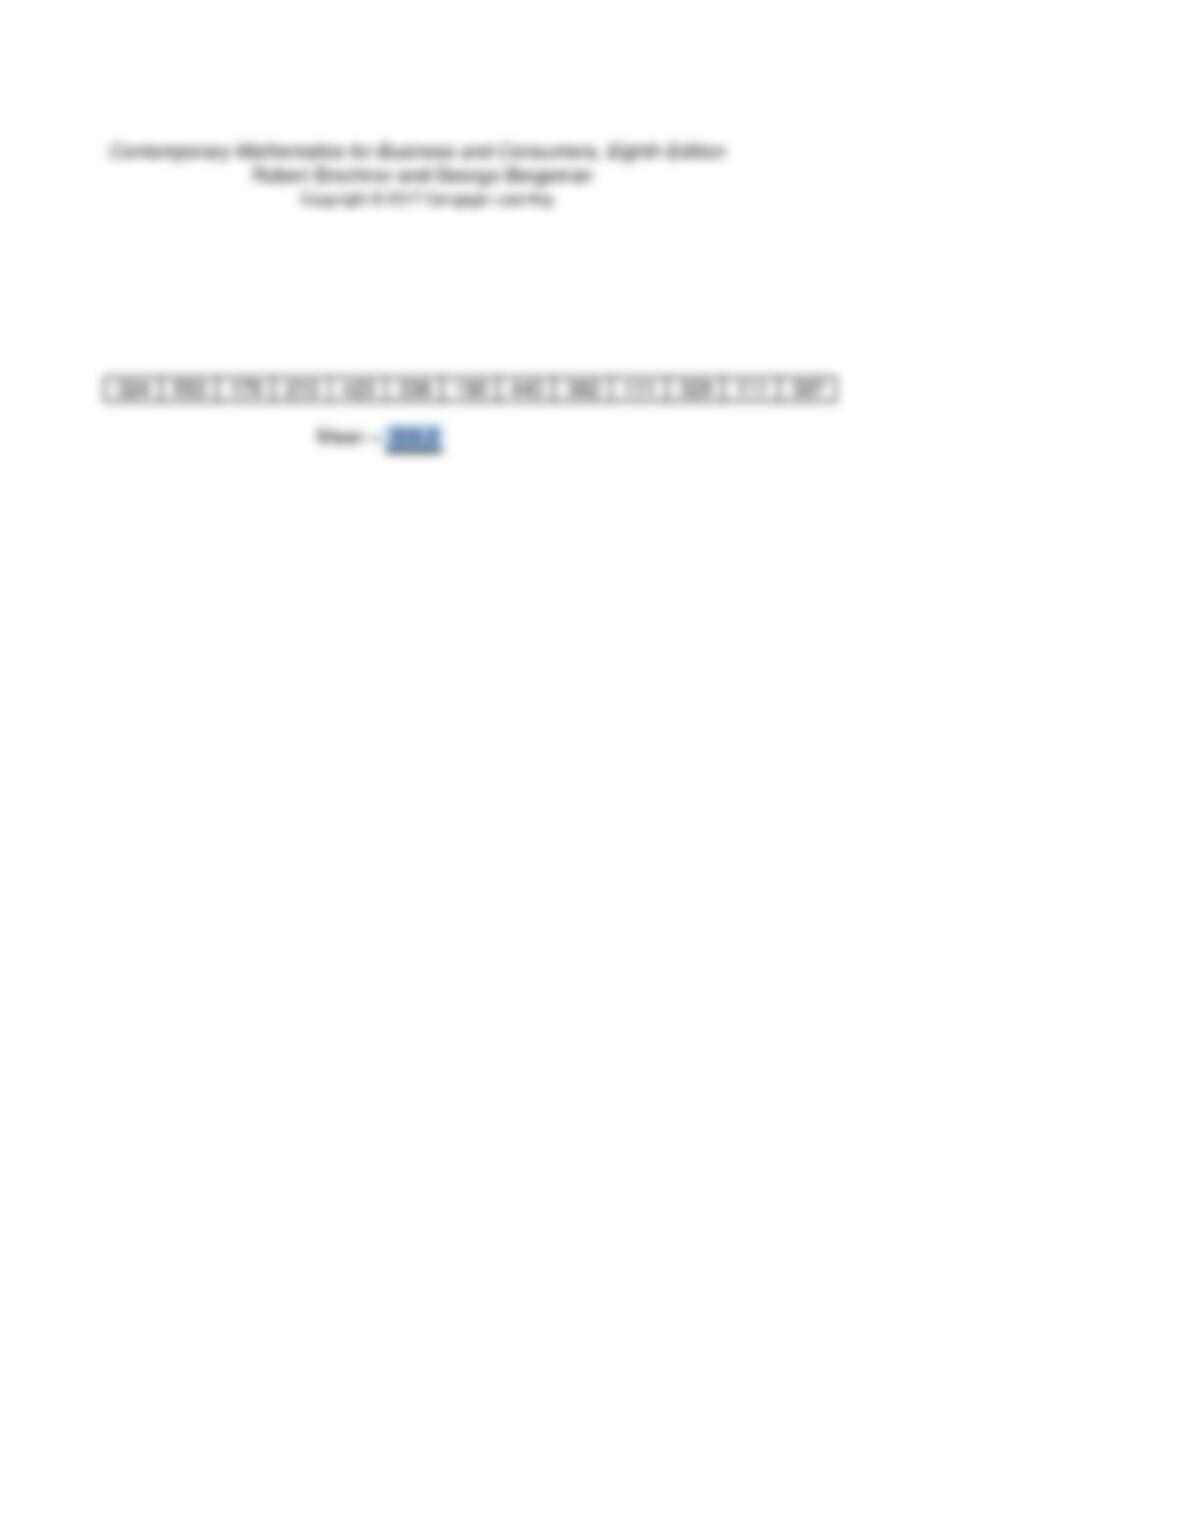
Calculate the mean of the following set of values (round to the nearest tenth when
applicable):
Level 3
Chapter 21 – Section II – Exercise 3
Calculate the mean of the following set of values (round to the nearest tenth when
applicable):
Level 1
Chapter 21 – Section II – Exercise 7
Determine the median of the following set of values: 57, 38, 29, 82, 71, 90, 11, 94, 26, 18, 18.
Values:
57
Level 1
Chapter 21 – Section II – Exercise 11
Determine the mode of the following set of values: 21, 57, 46, 21, 34, 76, 43, 68, 21, 76, 18, 12.
Level 1
Chapter 21 – Section II – Exercise 16
Determine the range of the following set of values: $2.35, $4.16, $3.42, $1.29, $.89, $4.55.
Values:
$2.35
Level 3
Chapter 21 – Section II – Exercise 19
You are the owner of The Dependable Delivery Service. Your company has four vehicles:
a large and a small van and a large and a small truck. The following set of data repre-
sents the number of packages delivered last week:
Monday Tuesday Wednesday Thursday Friday
Small Van 67 86 94 101 86
Large Van 142 137 153 165 106
Small Truck 225 202 288 311 290
Large Truck 322 290 360 348 339
a. What is the mean number of packages delivered for each van?
b. What is the median number of packages delivered for each truck?
c. What is the mean number of packages delivered on Monday?
d. What is the median number of packages delivered on Thursday?
Level 2
Chapter 21 – Section III – Exercise 2
You are the sales manager of the Esquire Sportswear Company. Last week, your 30
salespeople reported the following automobile mileages while making sales calls to
retail stores around the state:
385 231 328 154 283 86 415 389 575 117 75 173 247 316 357
211 432 271 93 515 376 328 183 359 136 88 438 282 375 637
a. Group the data into seven classes of equal size (0-99, 100-199, 200-299, 300-399,
etc.) and construct a frequency distribution of the mileages.
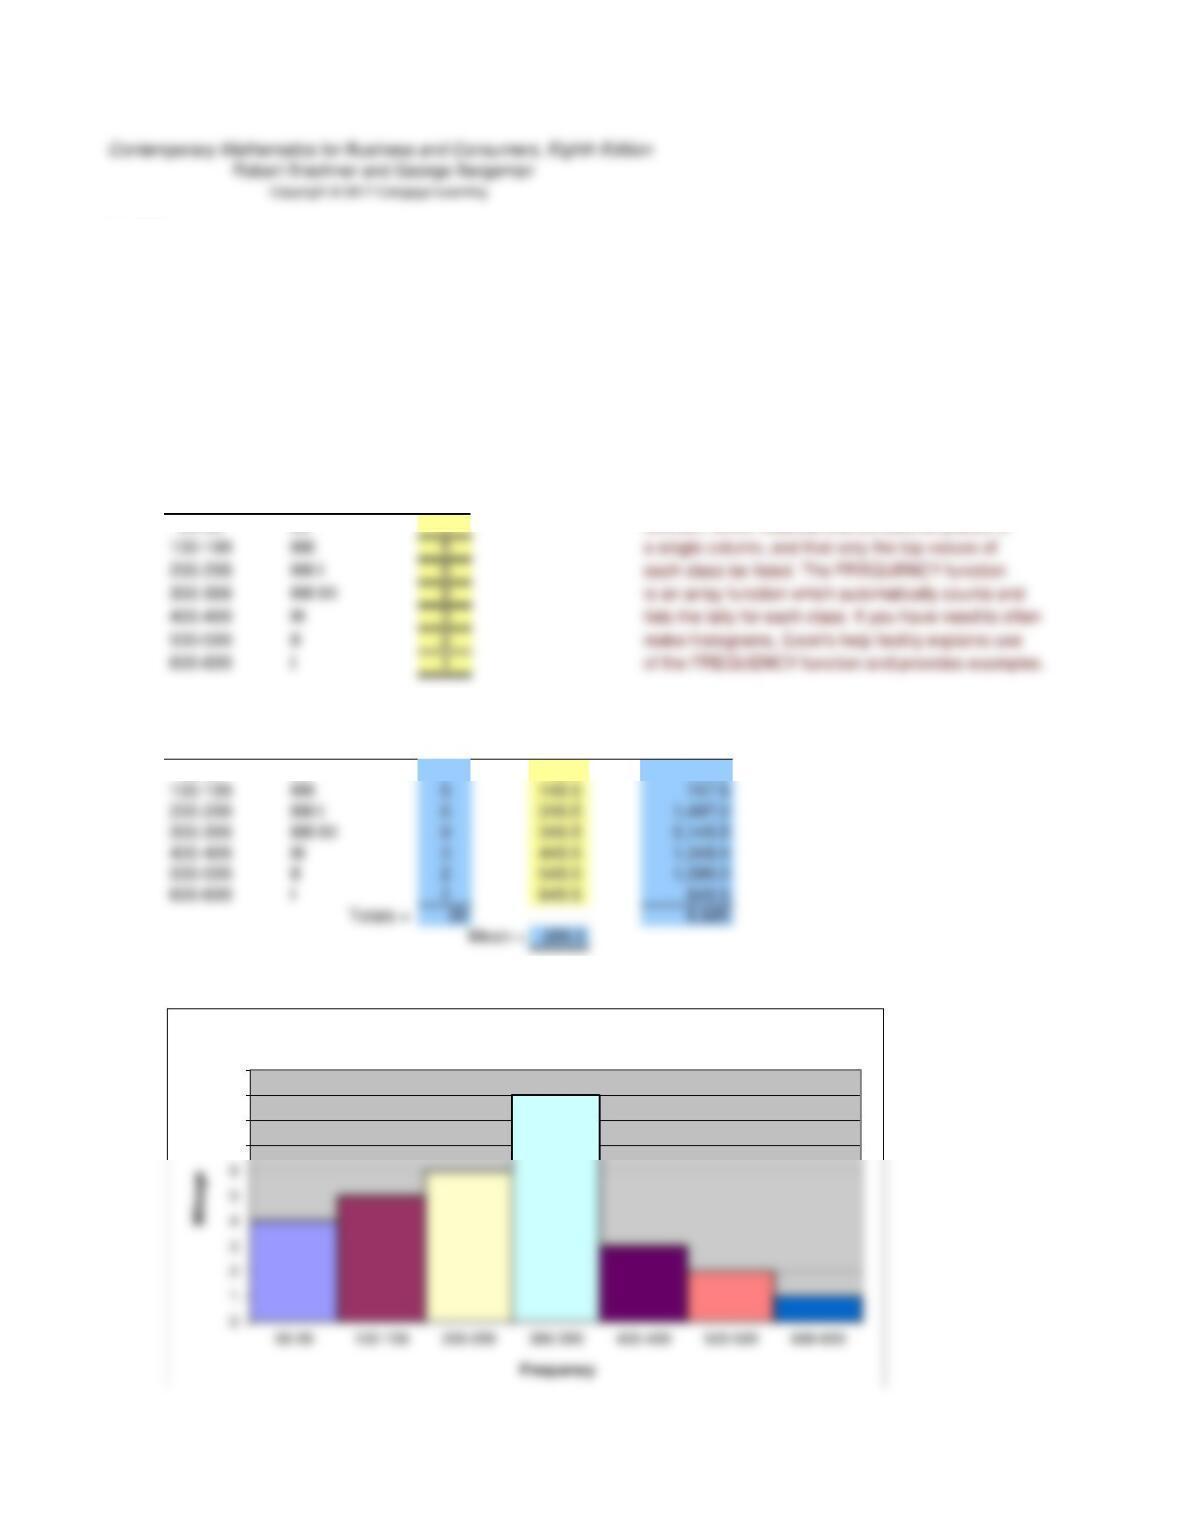
Class Tally Frequency Note: this can also be done using Excel’s FREQUENCY
00-99 IIII 4function, which requires that all data be placed in
b. Calculate the mean of the grouped data by using 49.5, 149.5, 249.5, etc., as the midpoints.
Class Tally Frequency Midpoint (m) f x m
00-99 IIII 4 49.5 198.0
c. Prepare a histogram of these data to graphically illustrate your salespersons’ mileages.
7
8
9
10
Mileage

Frequency
Level 1
Chapter 21 – Assessment Test – Exercise 1
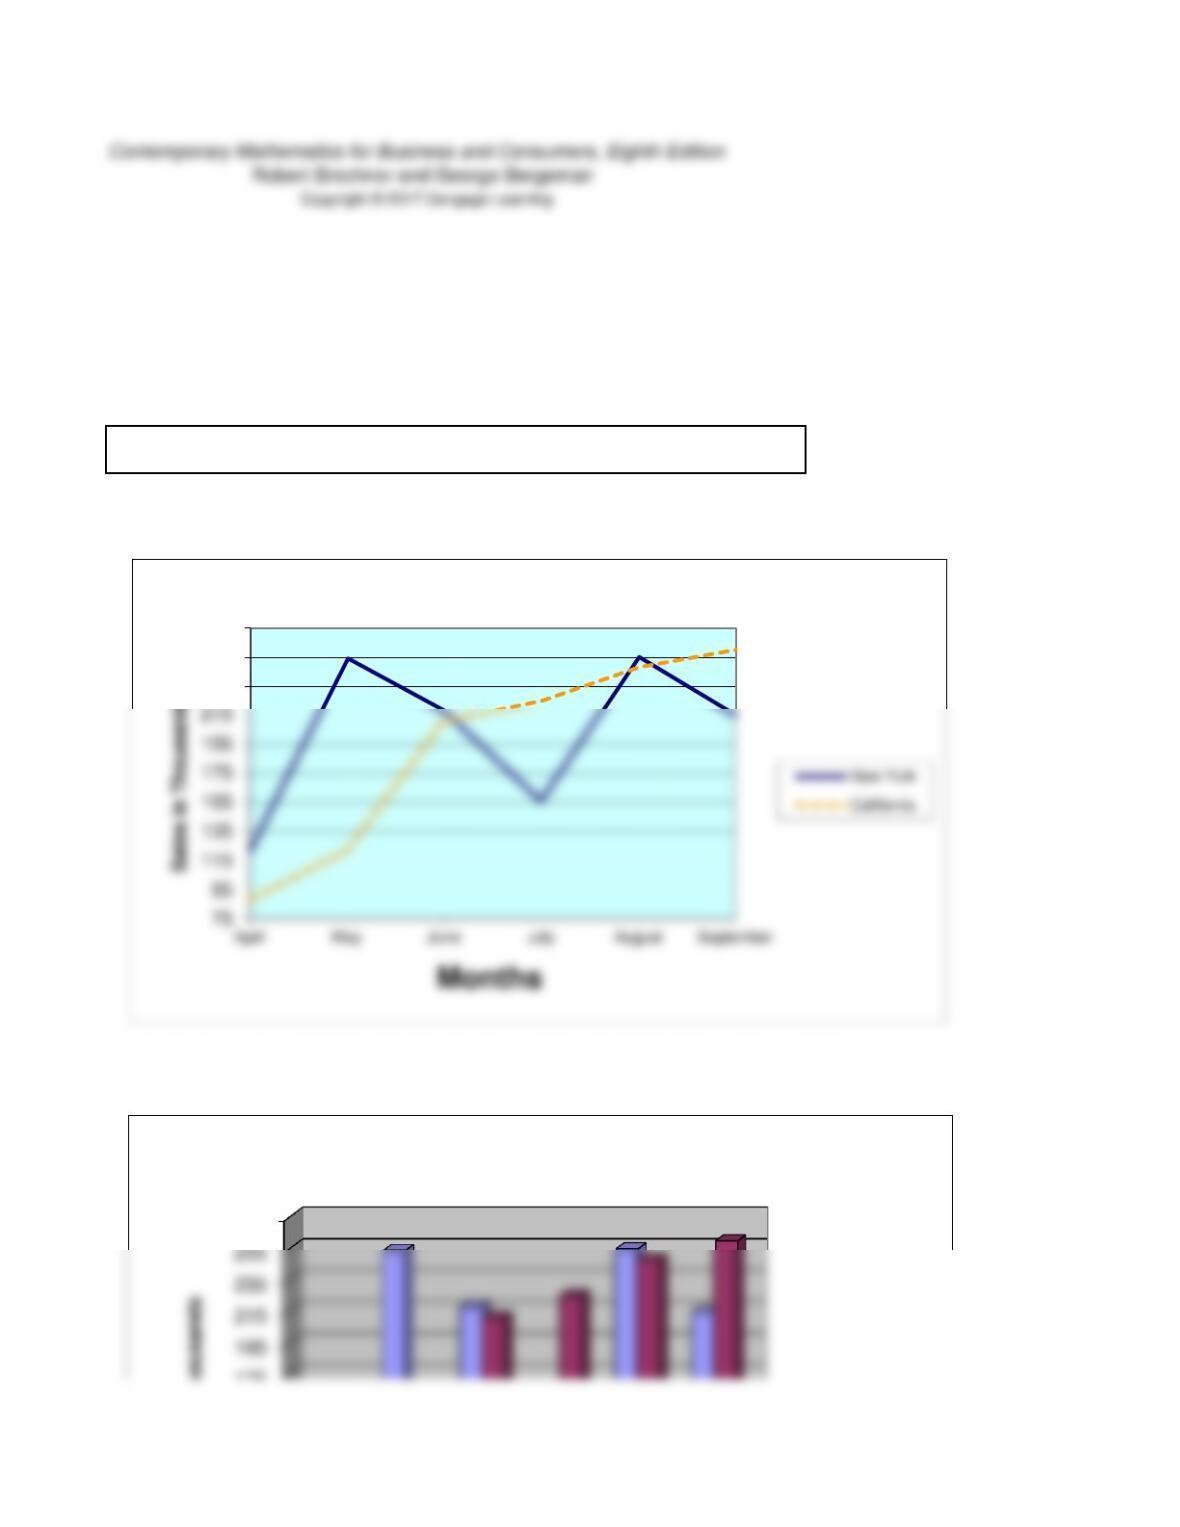
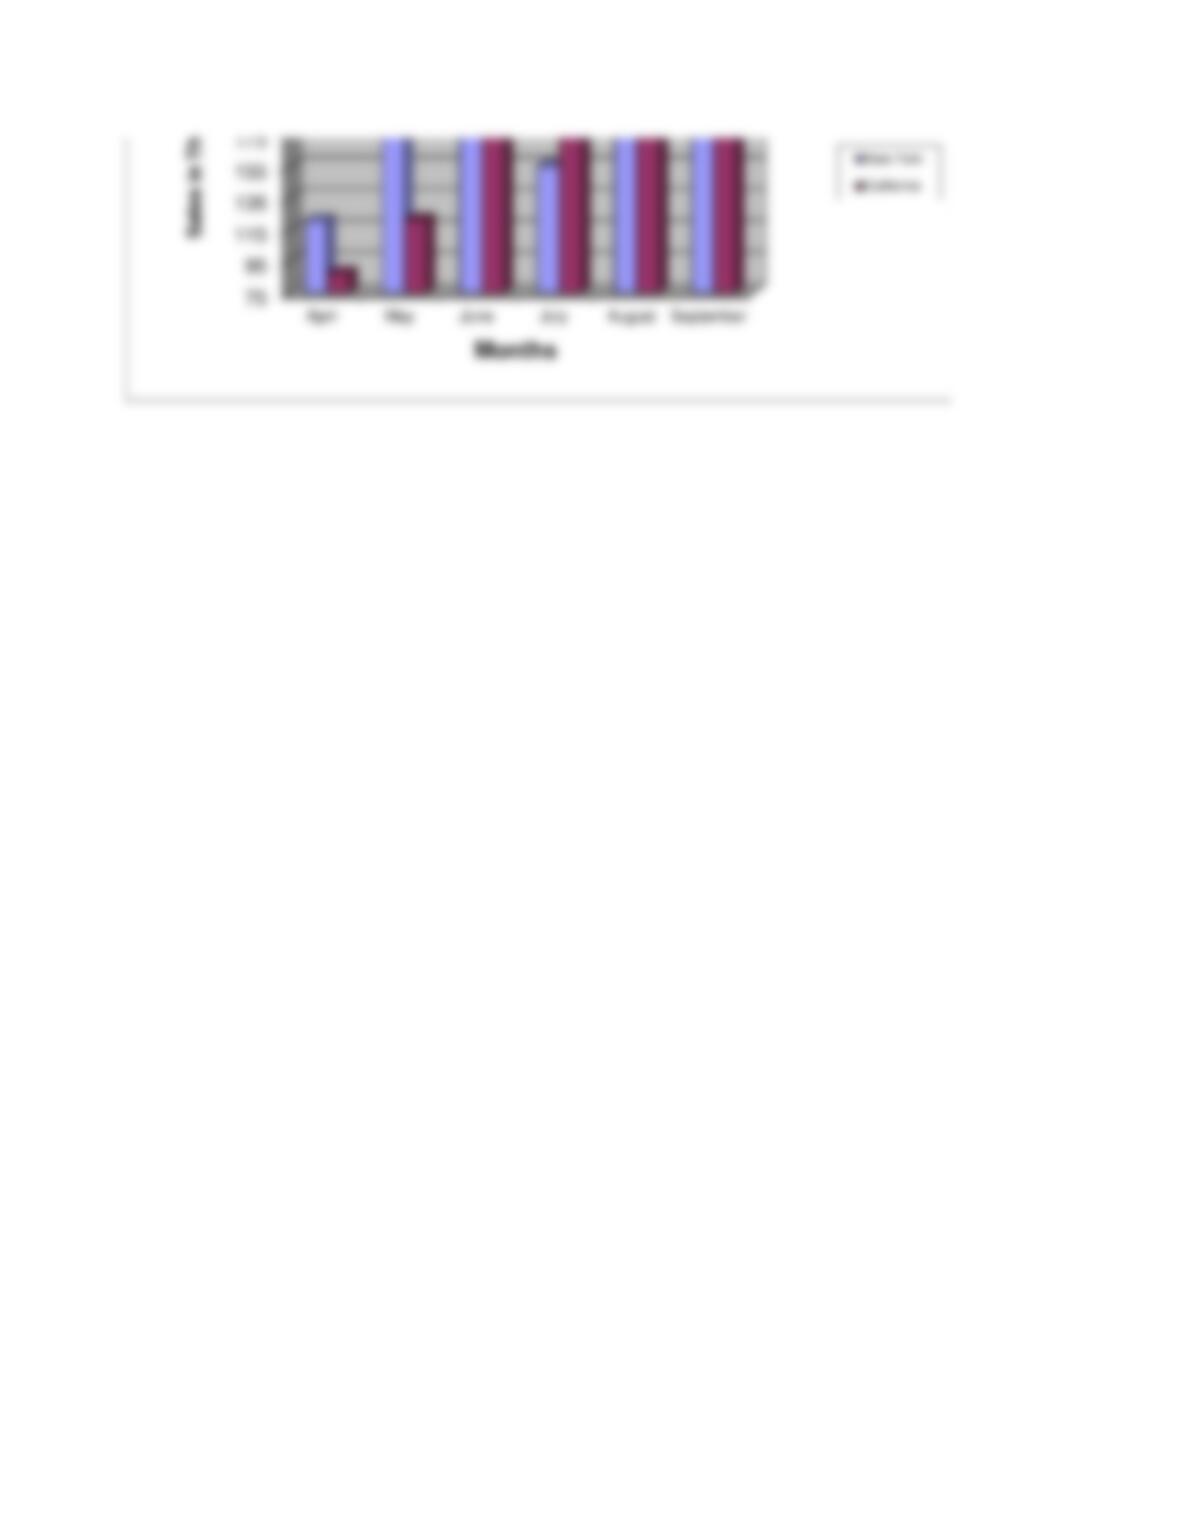
The following data represent the monthly sales figures, in thousands, for the New York
and California branches, respectively, of the Universal Corporation. April: 121, 88;
May: 254, 122; June: 218, 211; July: 156, 225; August: 255, 248; September: 215, 260.
April May June July August September
New York 121 254 218 156 255 215
California 88 122 211 225 248 260
a. Construct a multiple-line chart depicting the monthly sales for the two branches. Show
the New York branch as a solid line and the California branch as a dashed line.
b. Construct a comparative bar chart for the same data. Highlight the bars for each branch
differently.
235
255
275
Monthly Sales
275
Sales in Thousands
Monthly Sales
Level 3
Chapter 21 – Assessment Test – Exercise 3
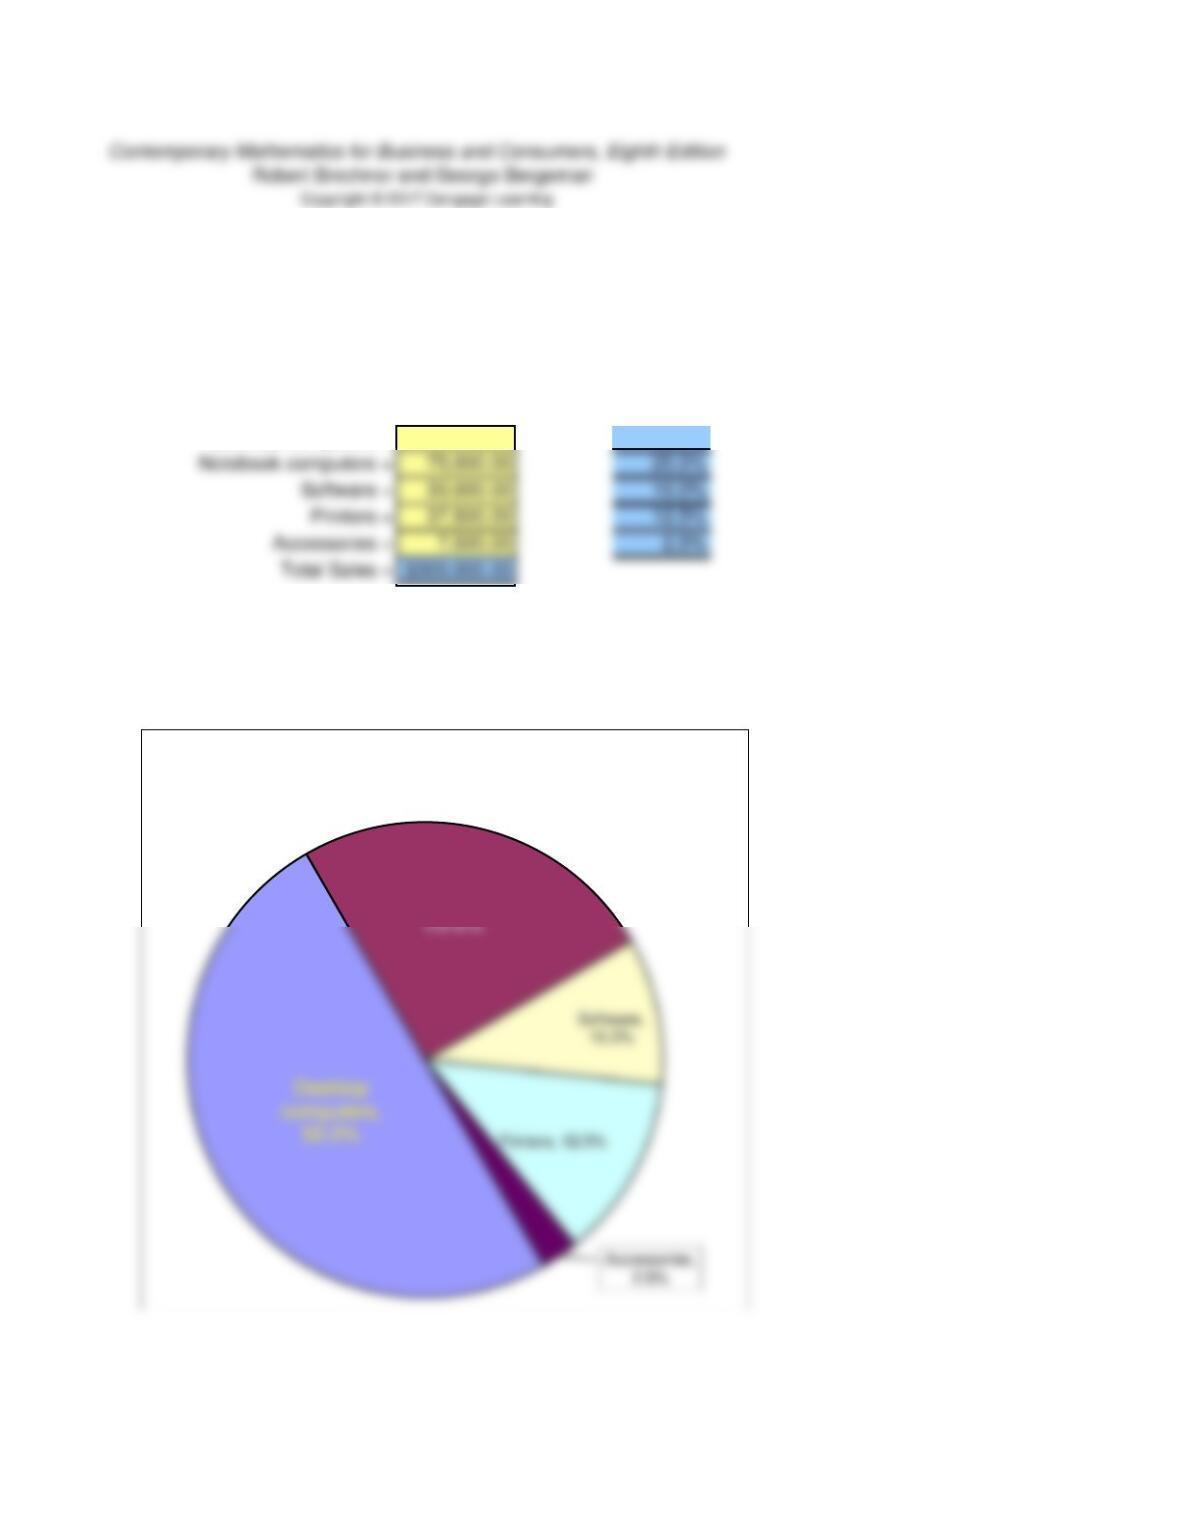
Last month, The Computer Connection sold $150,000 in desktop computers, $75,000 in
notebook computers, $30,000 in software, $37,500 in printers, and $7,500 in accessories.
a. What percent of the total sales does each category of merchandise represent?
Percent
Desktop computers = $150,000.00 50.0%
b. Construct a pie chart showing the percentage breakdown of sales by merchandise
category.
Hint: To show percents rounded to tenths, select Show values for the Data
labels when setting your Chart options.
Notebook
computers,
Sales By Category