Chapter 21/The Theory of Consumer Choice ❖ 377
SOLUTIONS TO TEXT PROBLEMS:
Quick Quizzes
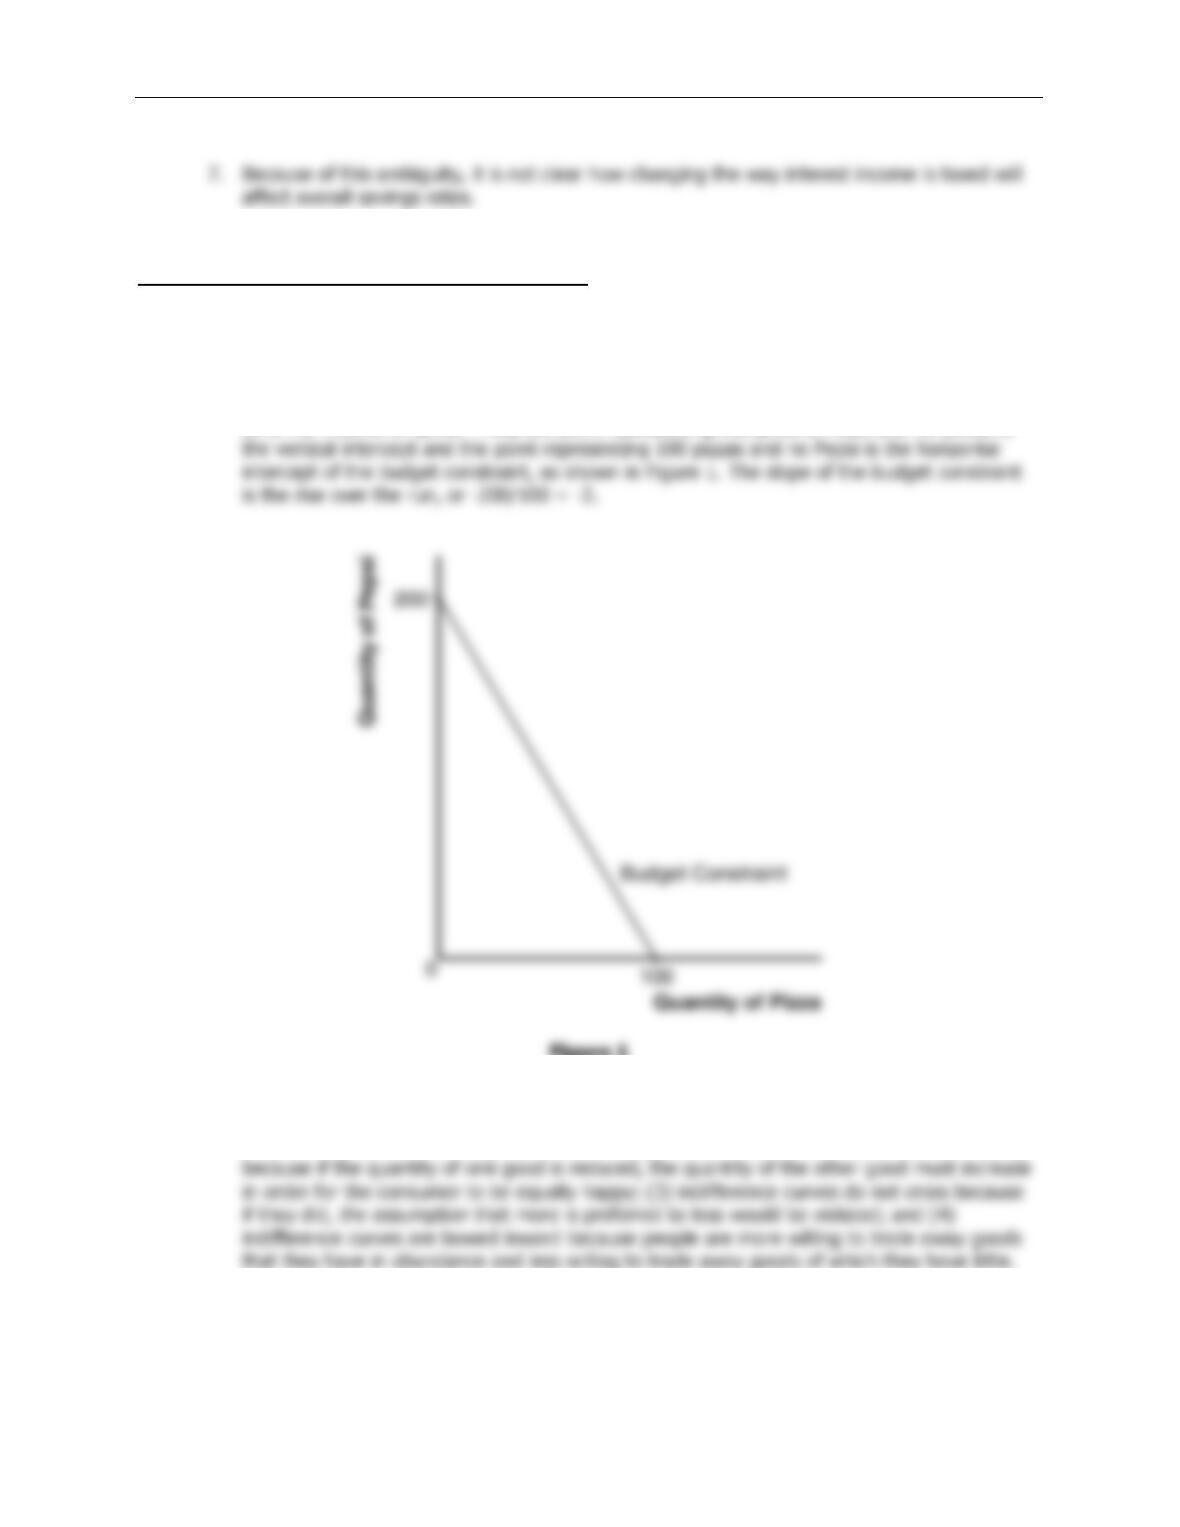
1. A person with an income of $1,000 could purchase $1,000/$5 = 200 pints of Pepsi if she
spent all of her income on Pepsi or she could purchase $1,000/$10 = 100 pizzas if she spent
all of her income on pizza. Thus, the point representing 200 pints of Pepsi and no pizzas is
Figure 1
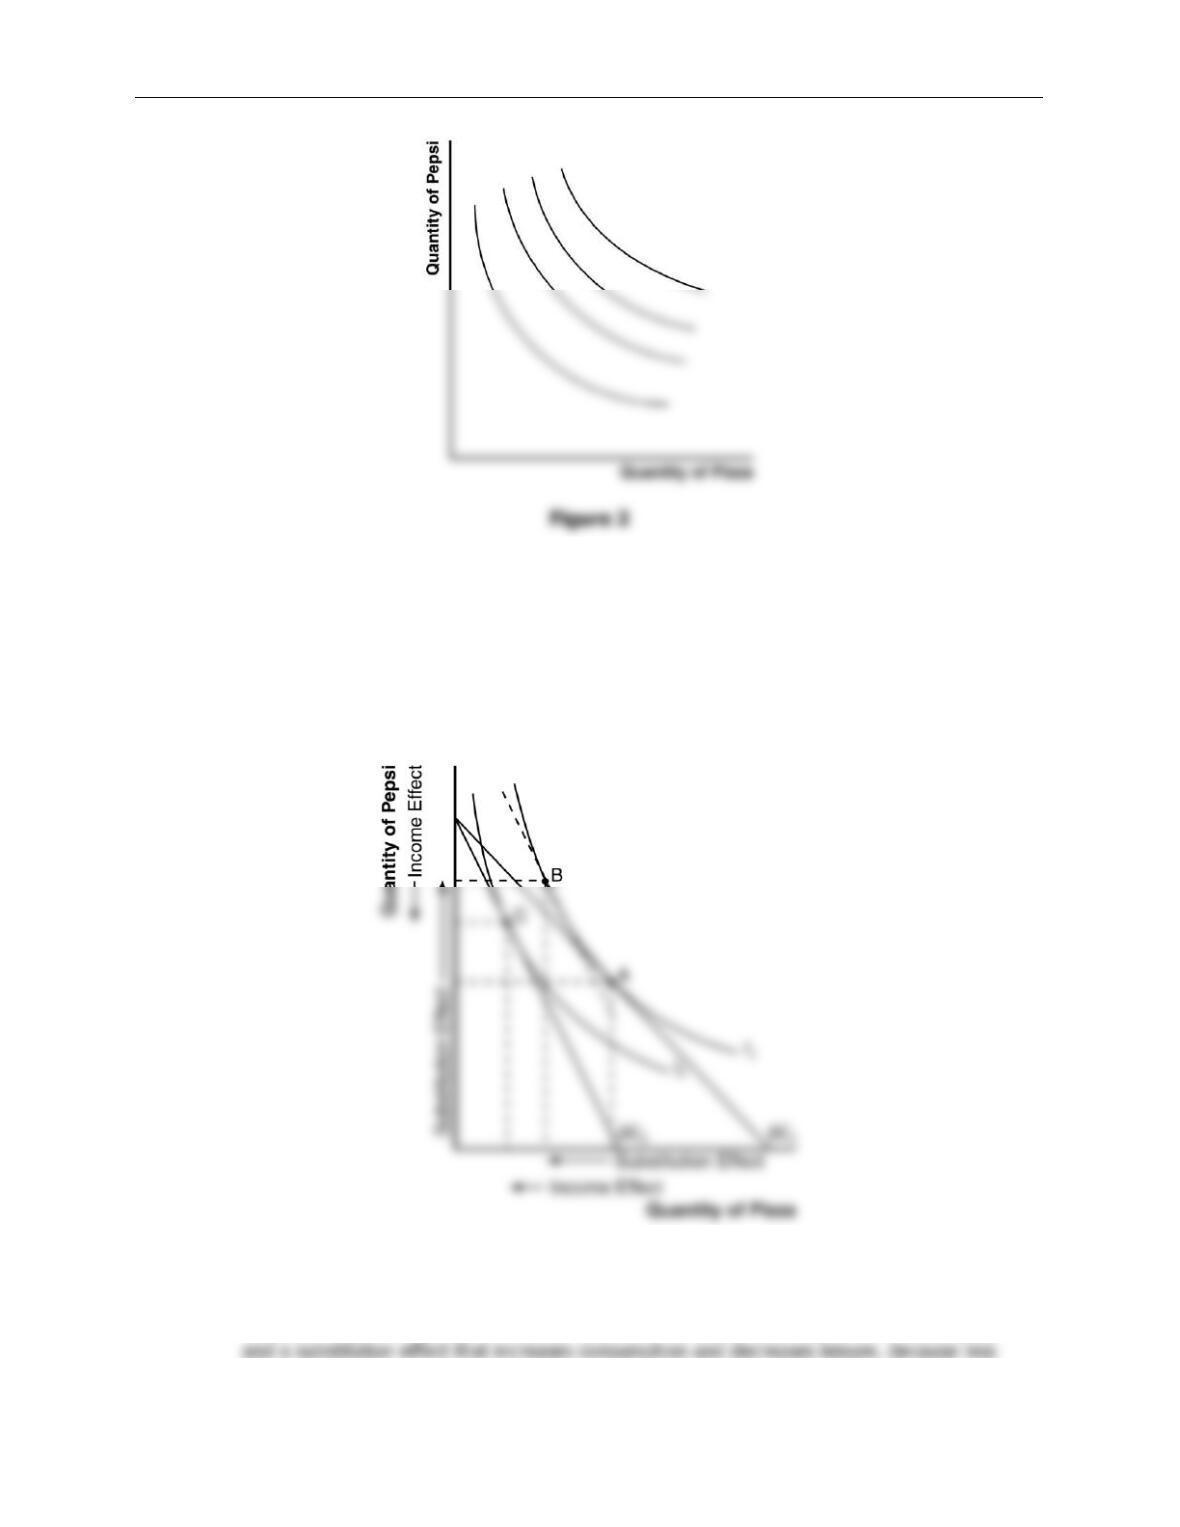
2. Figure 2 shows indifference curves between Pepsi and pizza. The four properties of these
indifference curves are: (1) higher indifference curves are preferred to lower ones because
consumers prefer more of a good to less of it; (2) indifference curves are downward sloping
378 ❖ Chapter 21/The Theory of Consumer Choice
3. Figure 3 shows the budget constraint (
BC
1) and two indifference curves. The consumer is
initially at point A, where the budget constraint is tangent to an indifference curve. The
increase in the price of pizza shifts the budget constraint to
BC
2, and the consumer moves to
point C where the new budget constraint is tangent to a lower indifference curve. To break
this move down into income and substitution effects requires drawing the dashed budget line
shown, which is parallel to the new budget constraint and tangent to the original indifference
curve at point B. The movement from A to B represents the substitution effect, while the
movement from B to C represents the income effect.
Figure 3
4. An increase in the wage can potentially decrease the amount that a person wants to work
because a higher wage has an income effect that increases both leisure and consumption
Chapter 21/The Theory of Consumer Choice ❖ 379
Questions for Review
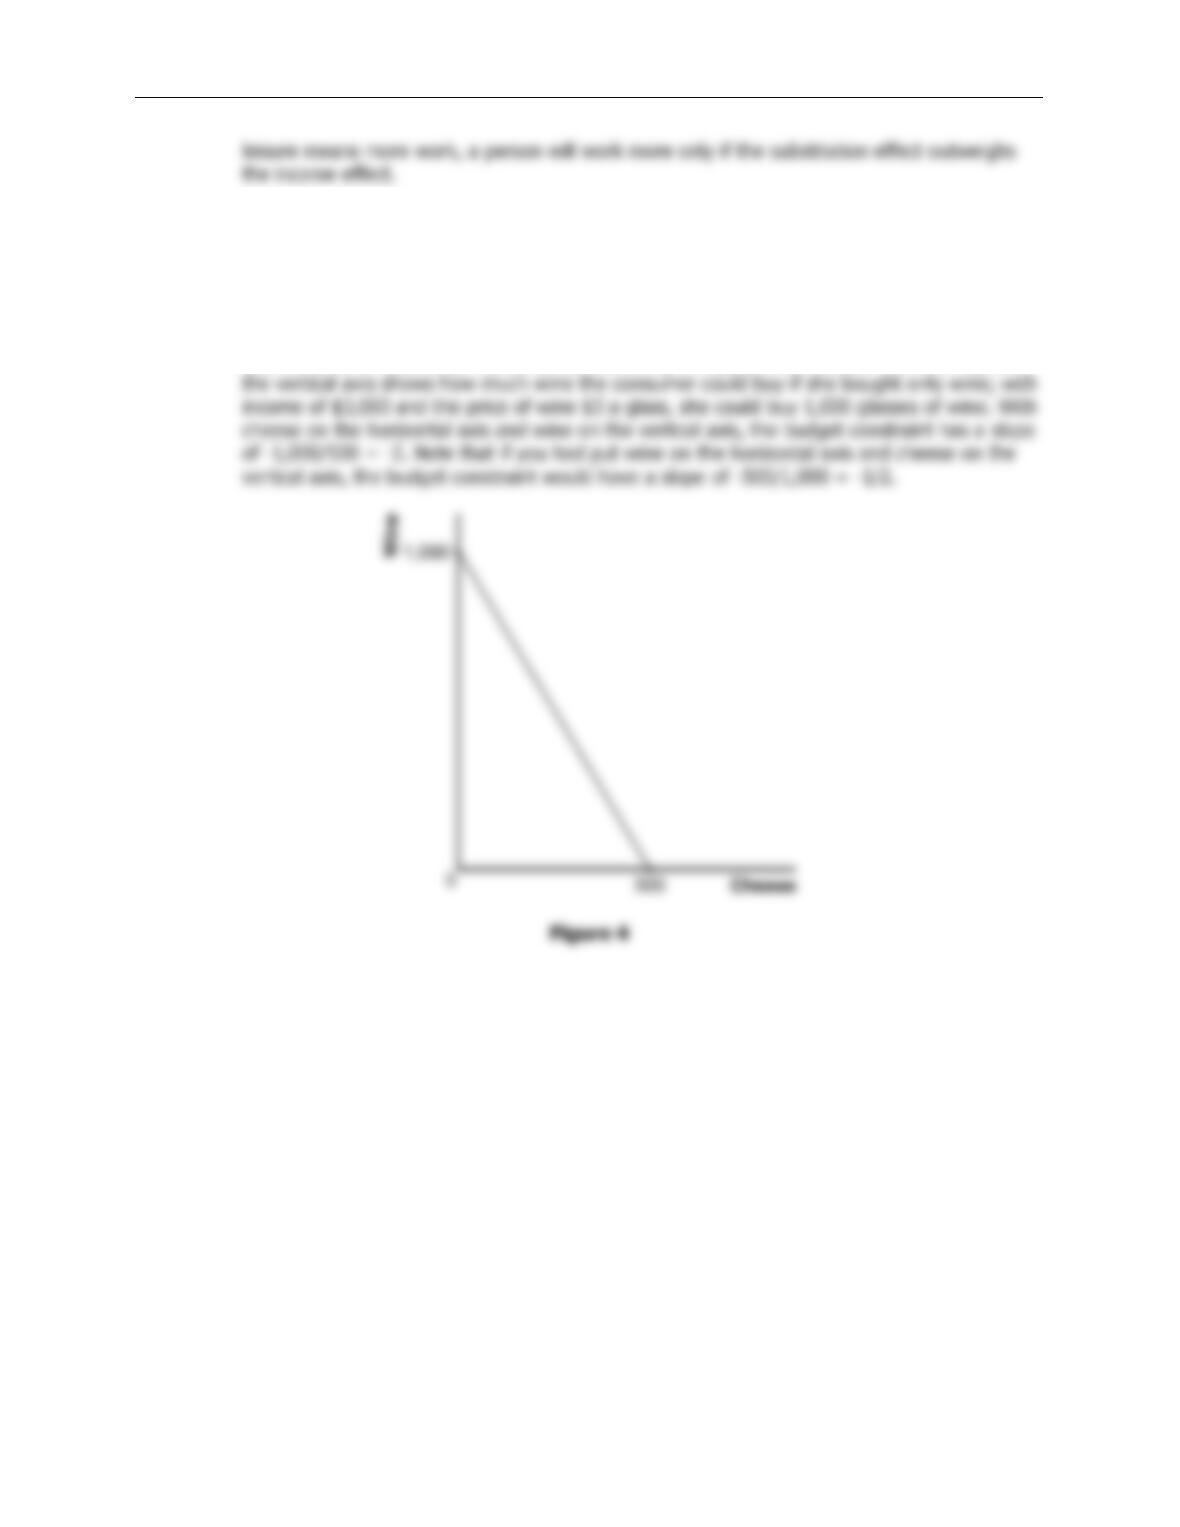
1. Figure 4 shows the consumer’s budget constraint. The intercept on the horizontal axis shows
how much cheese the consumer could buy if she bought only cheese; with income of $3,000
and the price of cheese $6 a pound, she could buy 500 pounds of cheese. The intercept on
380 ❖ Chapter 21/The Theory of Consumer Choice
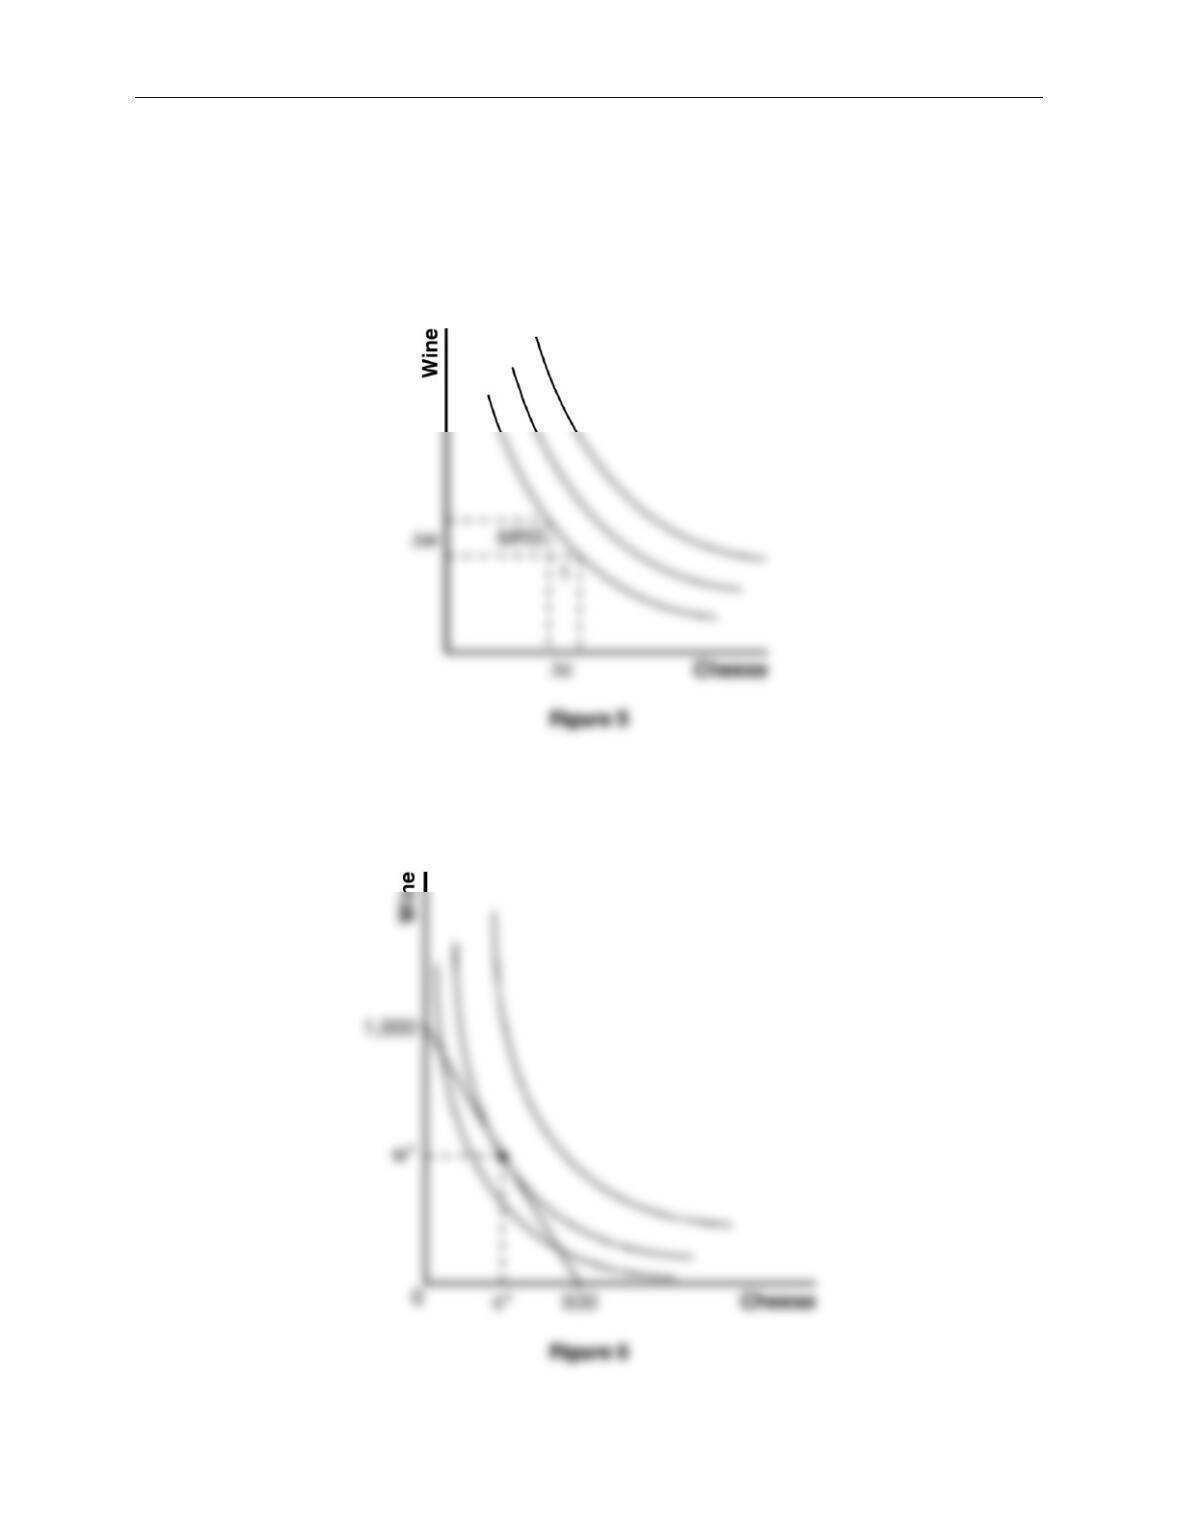
2. Figure 5 shows a consumer‘s indifference curves for wine and cheese. Four properties of
these indifference curves are: (1) higher indifference curves are preferred to lower ones
because more is preferred to less; (2) indifference curves are downward sloping because if
the quantity of wine is reduced, the quantity of cheese must increase for the consumer to be
equally happy; (3) indifference curves do not cross because a consumer prefers more to less;
and (4) indifference curves are bowed inward because a consumer is more willing to trade
away wine if she has a lot of it and less willing to trade away cheese if she has little of it.
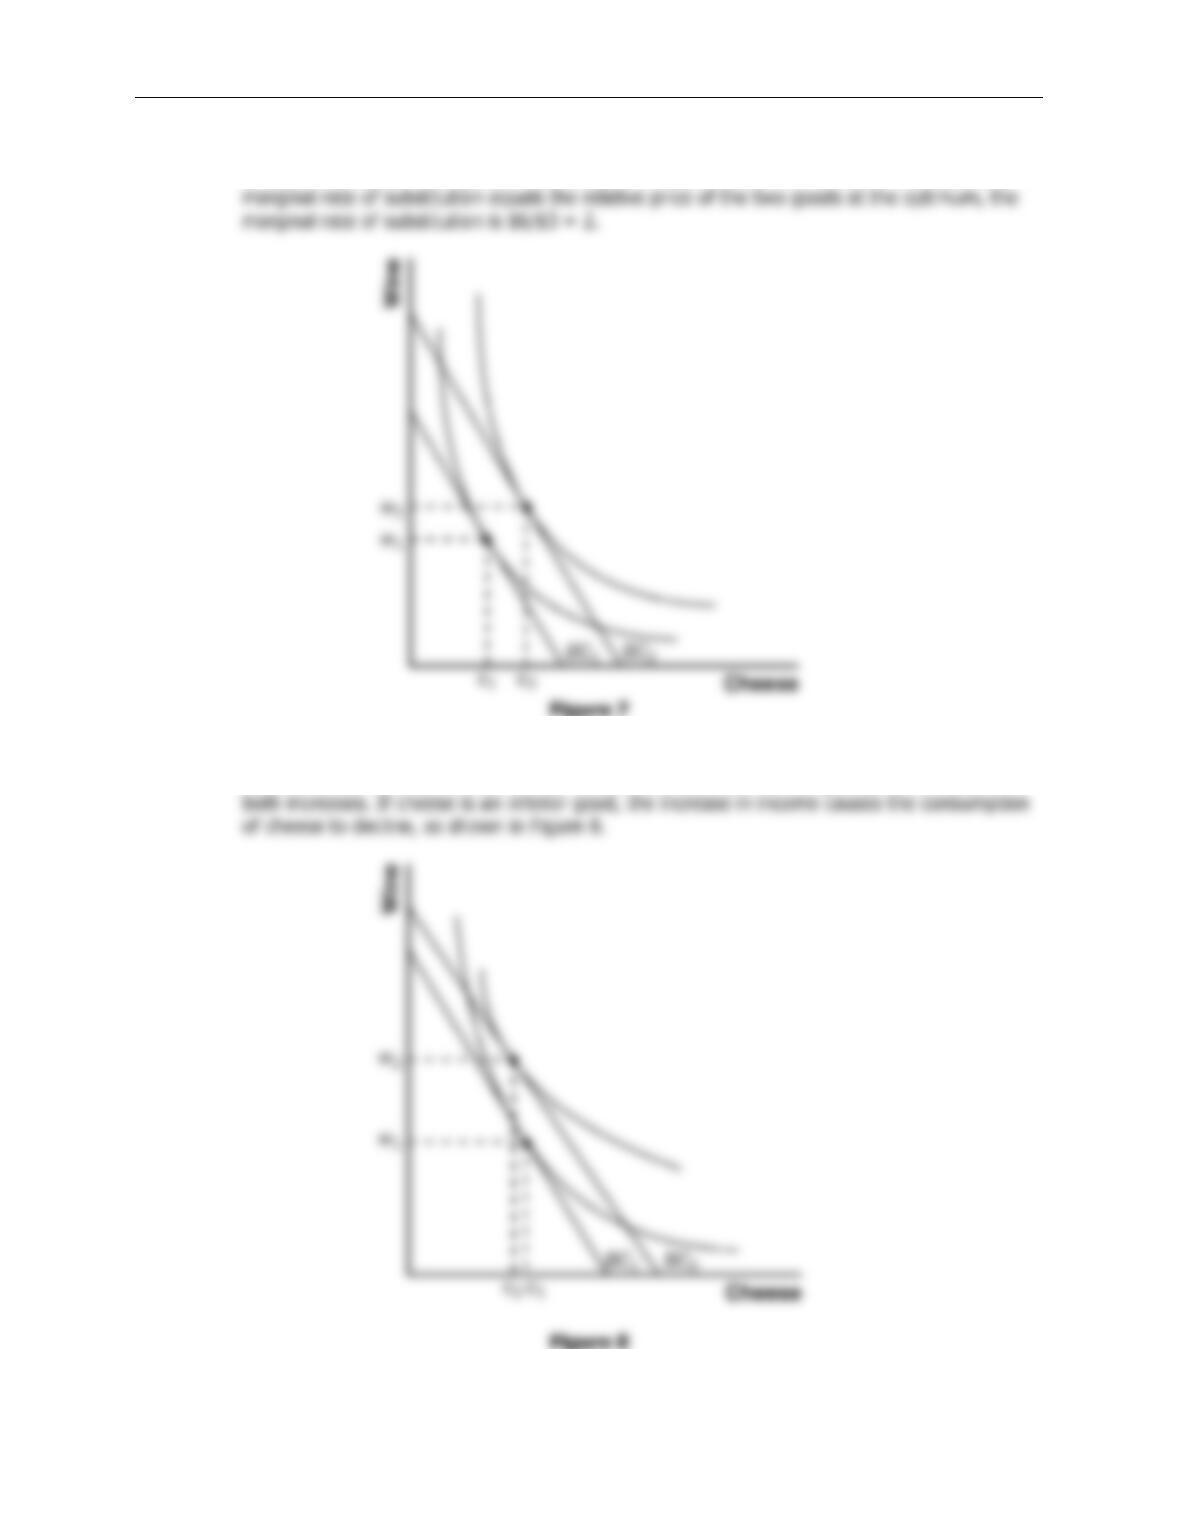
3. In Figure 5, the marginal rate of substitution (
MRS
) of one point on an indifference curve is
shown. The marginal rate of substitution shows the amount of wine the consumer would be
willing to give up to get one more pound of cheese.
Chapter 21/The Theory of Consumer Choice ❖ 381
4. Figure 6 shows the consumer’s budget constraint and indifference curves for wine and
cheese. The consumer’s optimum consumption choice is shown as w* and c*. Because the
5. Figure 7 shows the effect of an increase in income. The rise in income shifts the budget
constraint out from
BC
1 to
BC
2. If both wine and cheese are normal goods, consumption of
382 ❖ Chapter 21/The Theory of Consumer Choice
Figure 9
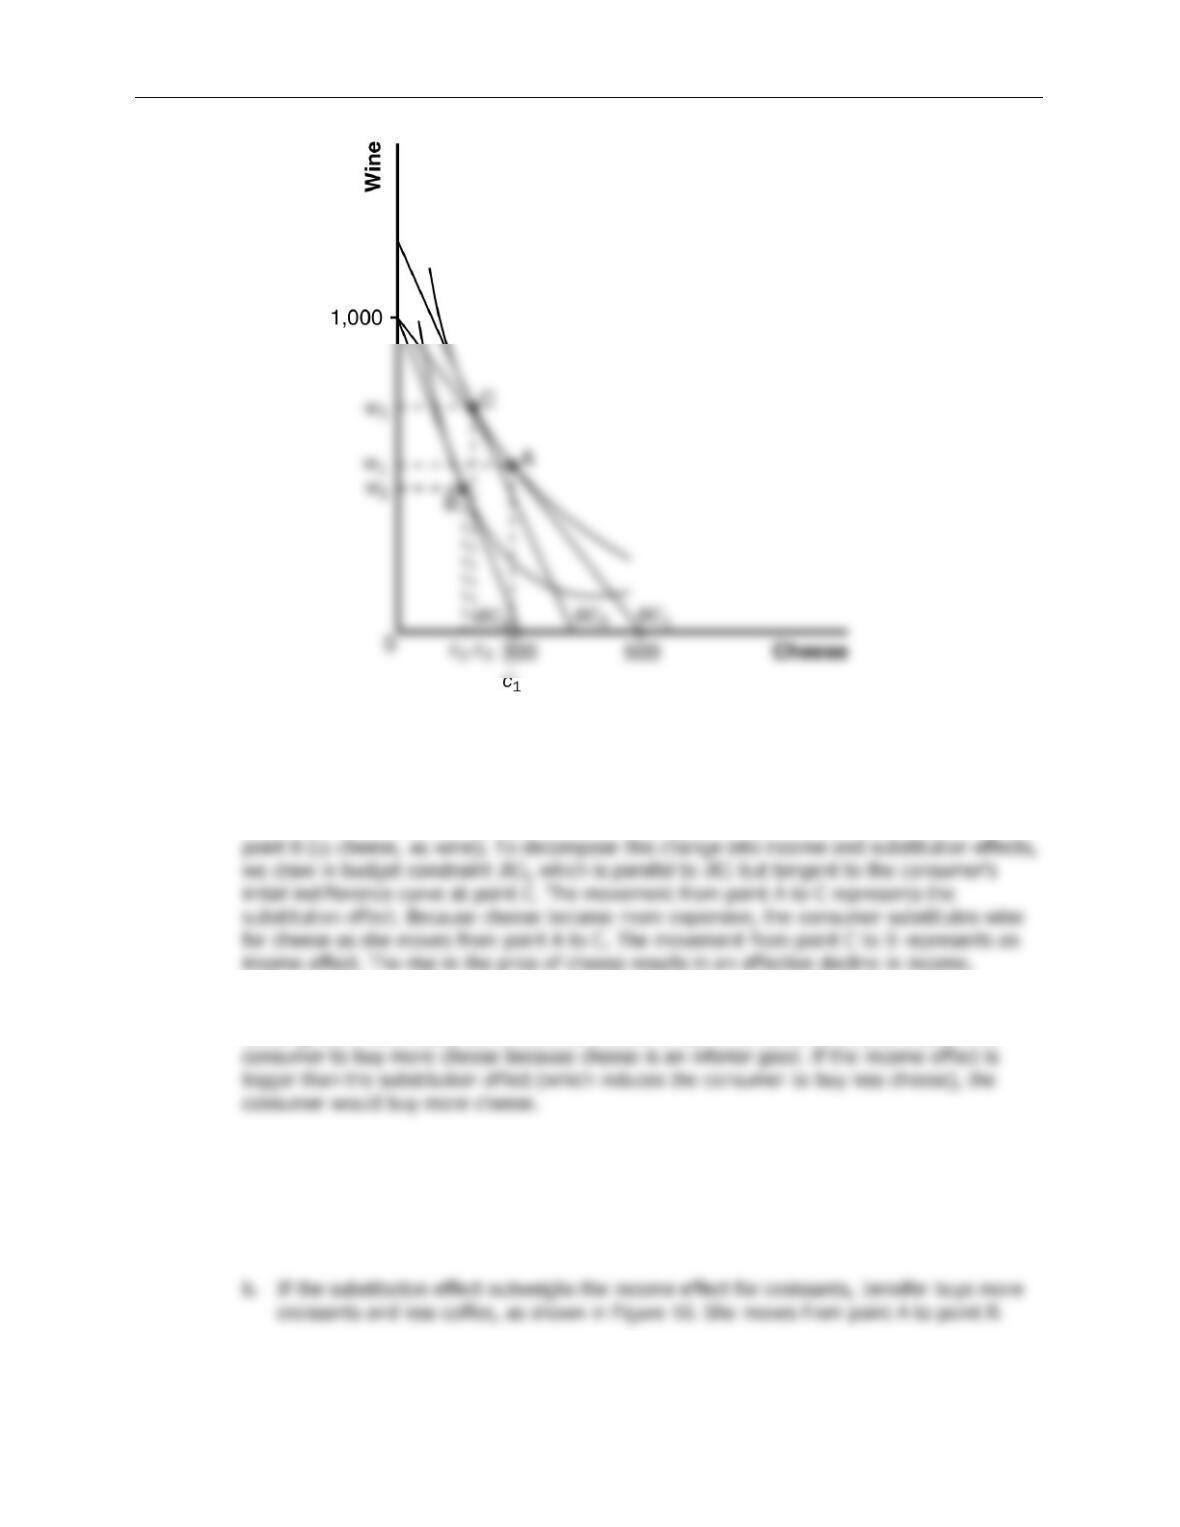
6. A rise in the price of cheese from $6 to $10 a pound makes the horizontal intercept of the
budget line decline from 500 to 300, as shown in Figure 9. The consumer’s budget constraint
shifts from
BC
1 to
BC
2 and her optimal choice changes from point A (
c
1 cheese,
w
1 wine) to
7. An increase in the price of cheese could induce a consumer to buy more cheese if cheese is a
Giffen good. In that case, the income effect of the rise in the price of cheese induces the
Problems and Applications
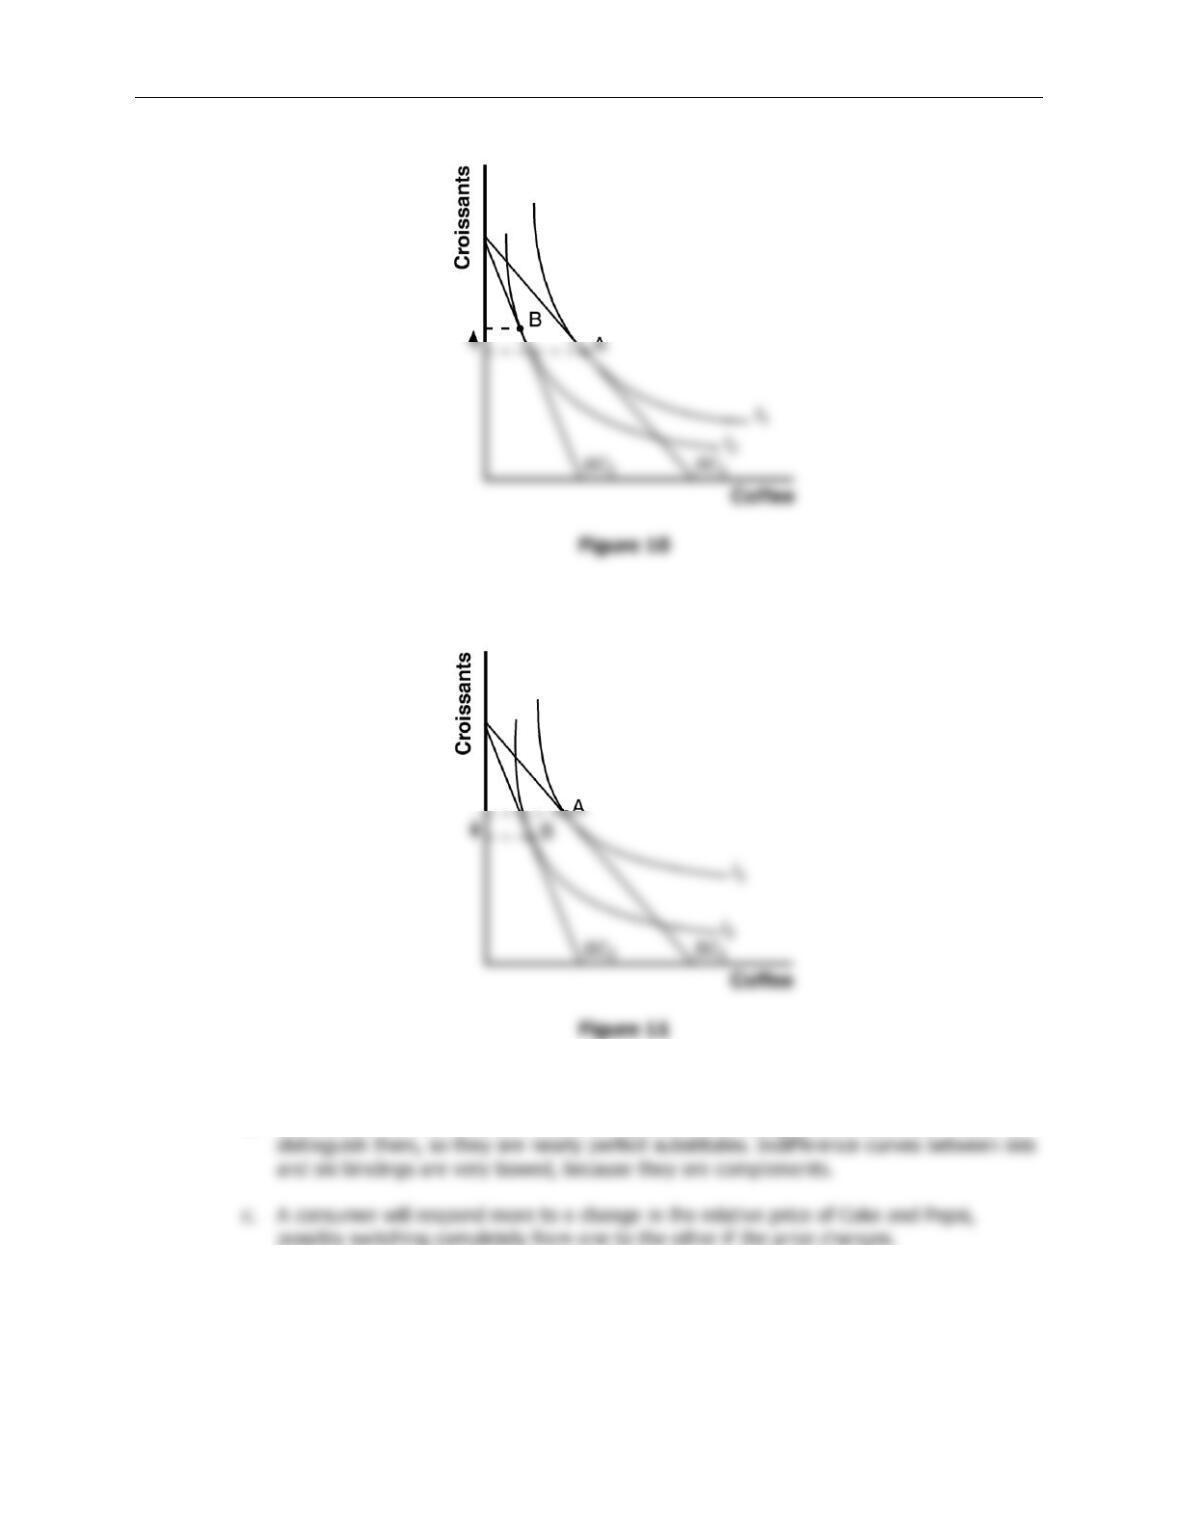
1. a. Figure 10 shows the effect of the frost on Jennifer’s budget constraint. Because the price
of coffee rises, her budget constraint swivels from
BC
1 to
BC
2.
Chapter 21/The Theory of Consumer Choice ❖ 383
c. If the income effect outweighs the substitution effect for croissants, Jennifer buys fewer
croissants and less coffee, moving from point A to point B in Figure 11.
2. a. Skis and ski bindings are complements. Coke and Pepsi are substitutes.
b. Indifference curves between Coke and Pepsi are fairly straight, because there is little to
384 ❖ Chapter 21/The Theory of Consumer Choice
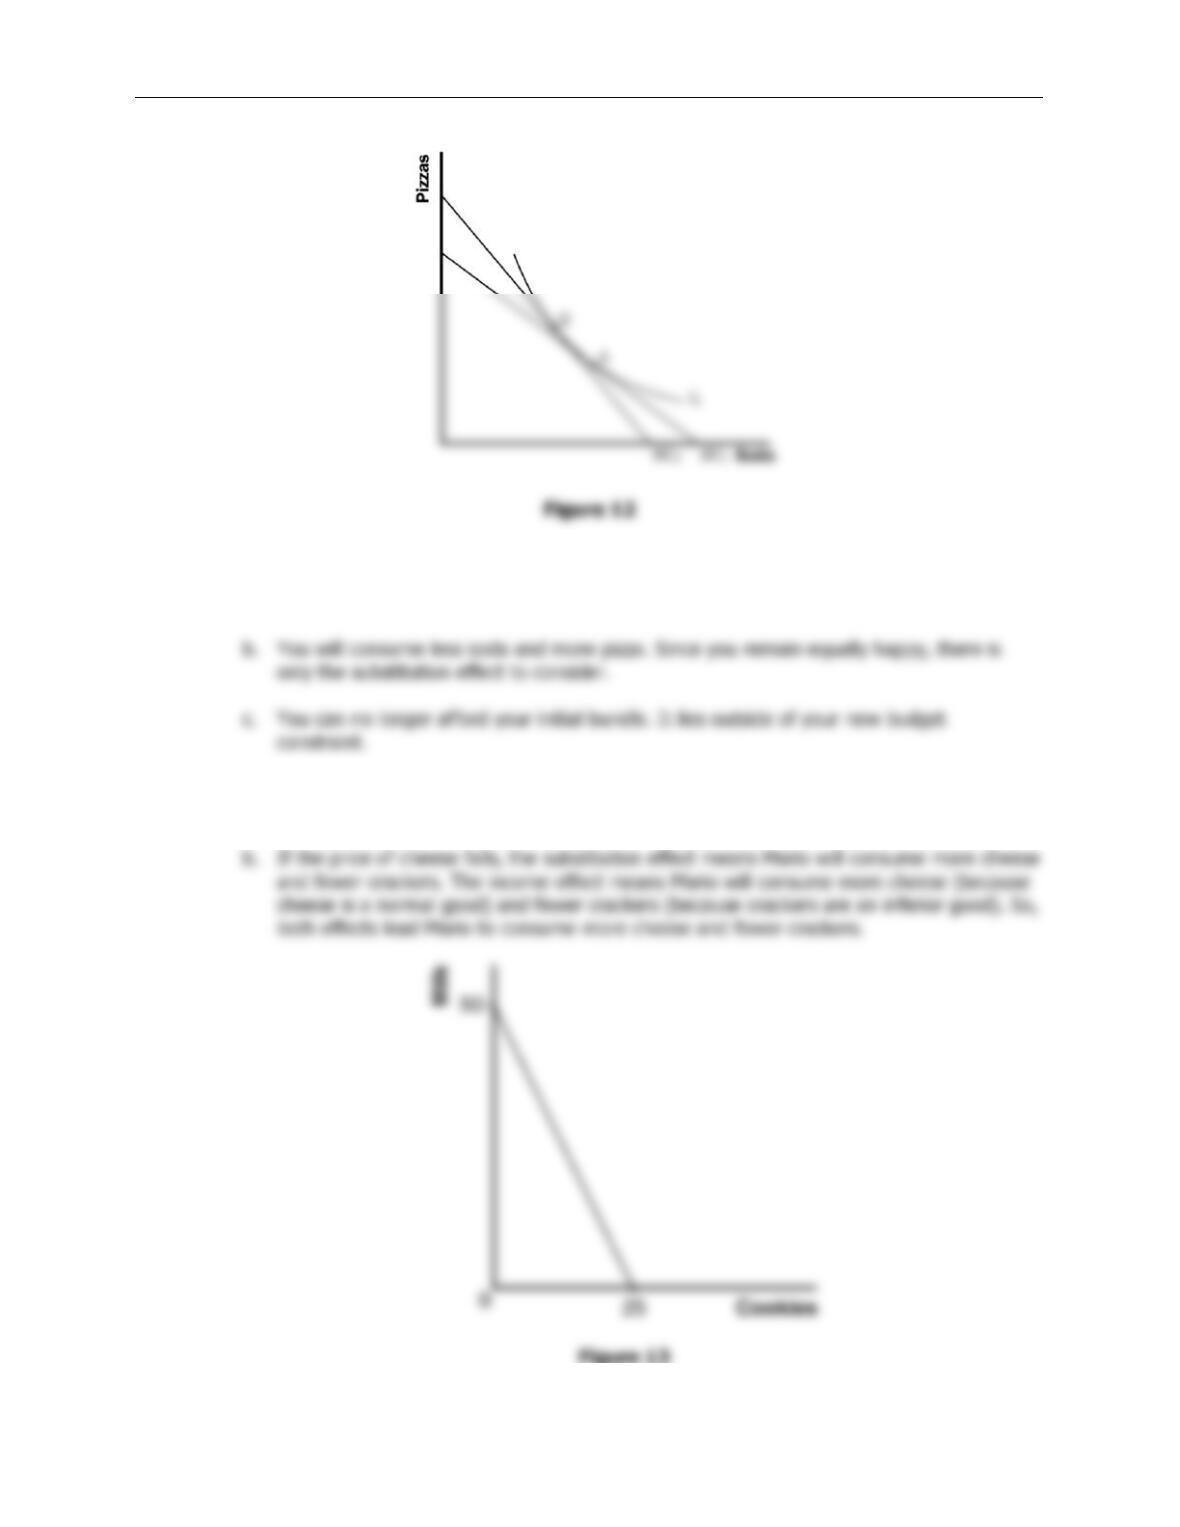
3. a. Figure 12 shows the effects of these price changes. If you are equally happy, you will
remain on the same indifference curve. However, both the increase in the price of soda
and the decline in the price of pizza make the budget constraint steeper.
4. a. Cheese and crackers cannot both be inferior goods, because if Mario’s income rises he
must consume more of something.
Chapter 21/The Theory of Consumer Choice ❖ 385
5. a. Figure 13 shows Jim’s budget constraint. The vertical intercept is 50 quarts of milk,
because if Jim spent all his money on milk he would buy $100/$2 = 50 quarts of it. The
horizontal intercept is 25 dozen cookies, because if Jim spent all his money on cookies he
6. a. This statement is true. All Giffen goods are inferior goods.
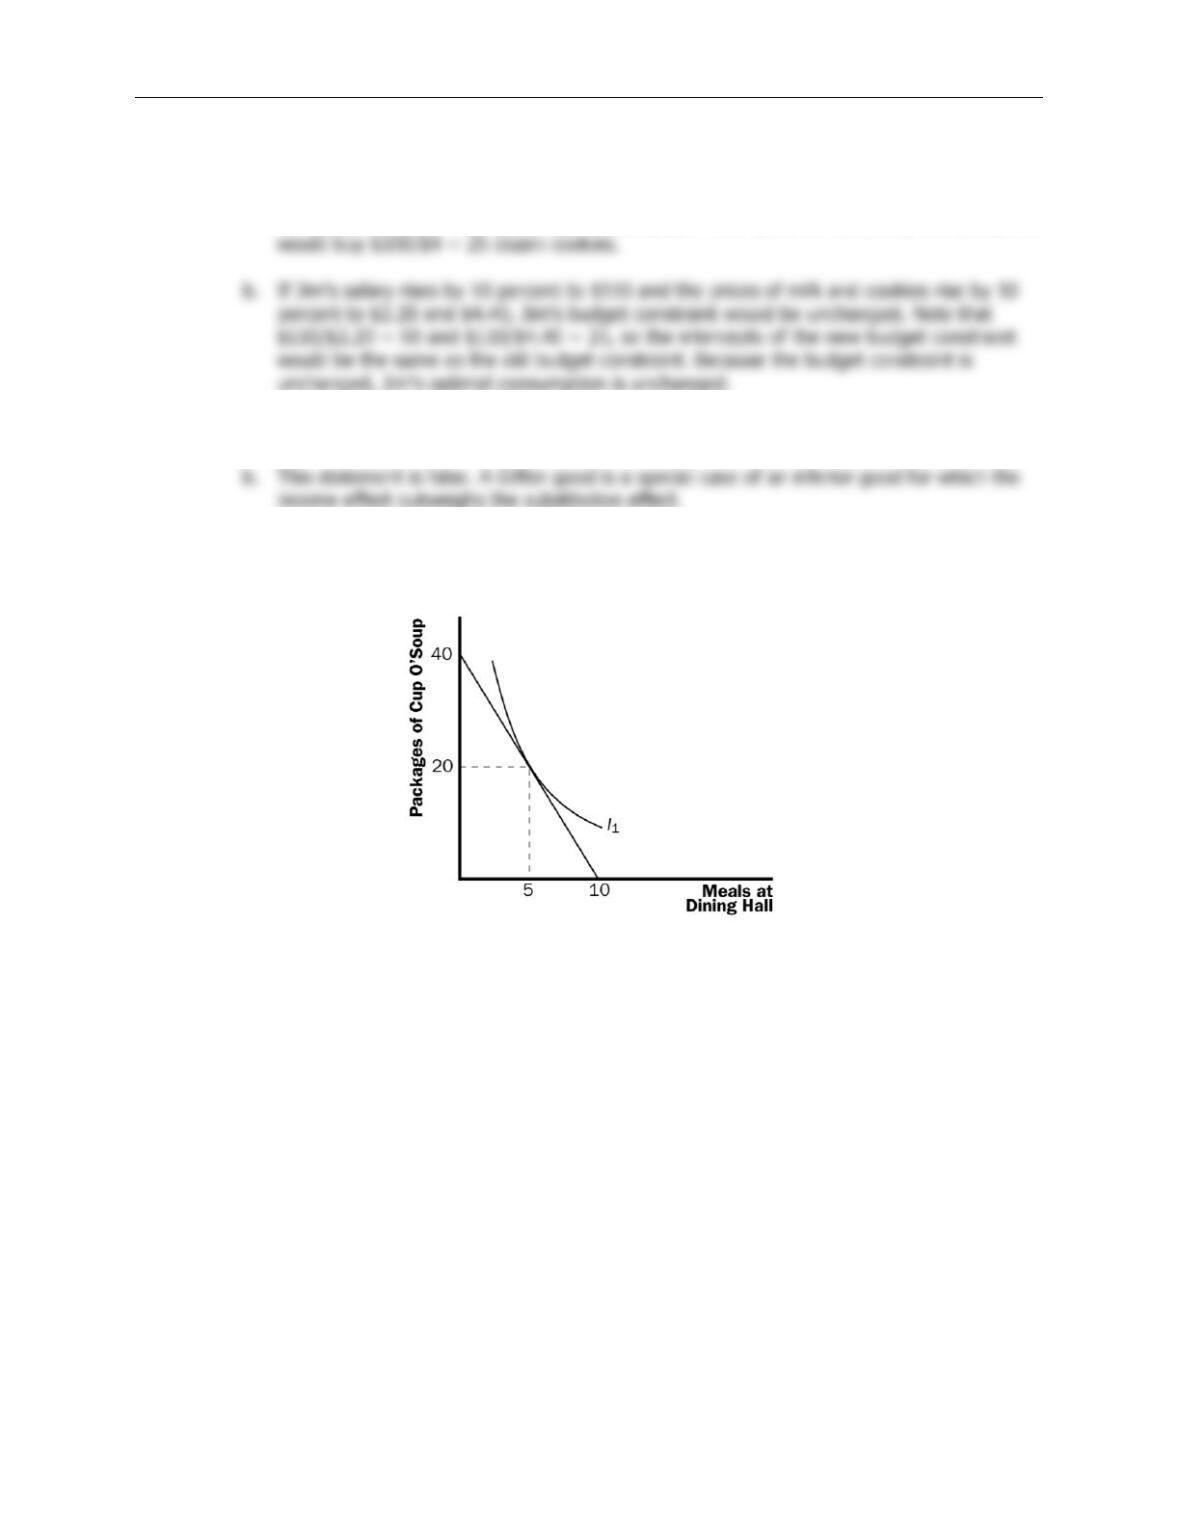
7. a. Figure 14 shows the student’s budget constraint. If he spends equal amounts on both
goods, he will purchase 5 meals in the dining hall and 20 packages of Cup O’ Soup.
Figure 14
386 ❖ Chapter 21/The Theory of Consumer Choice
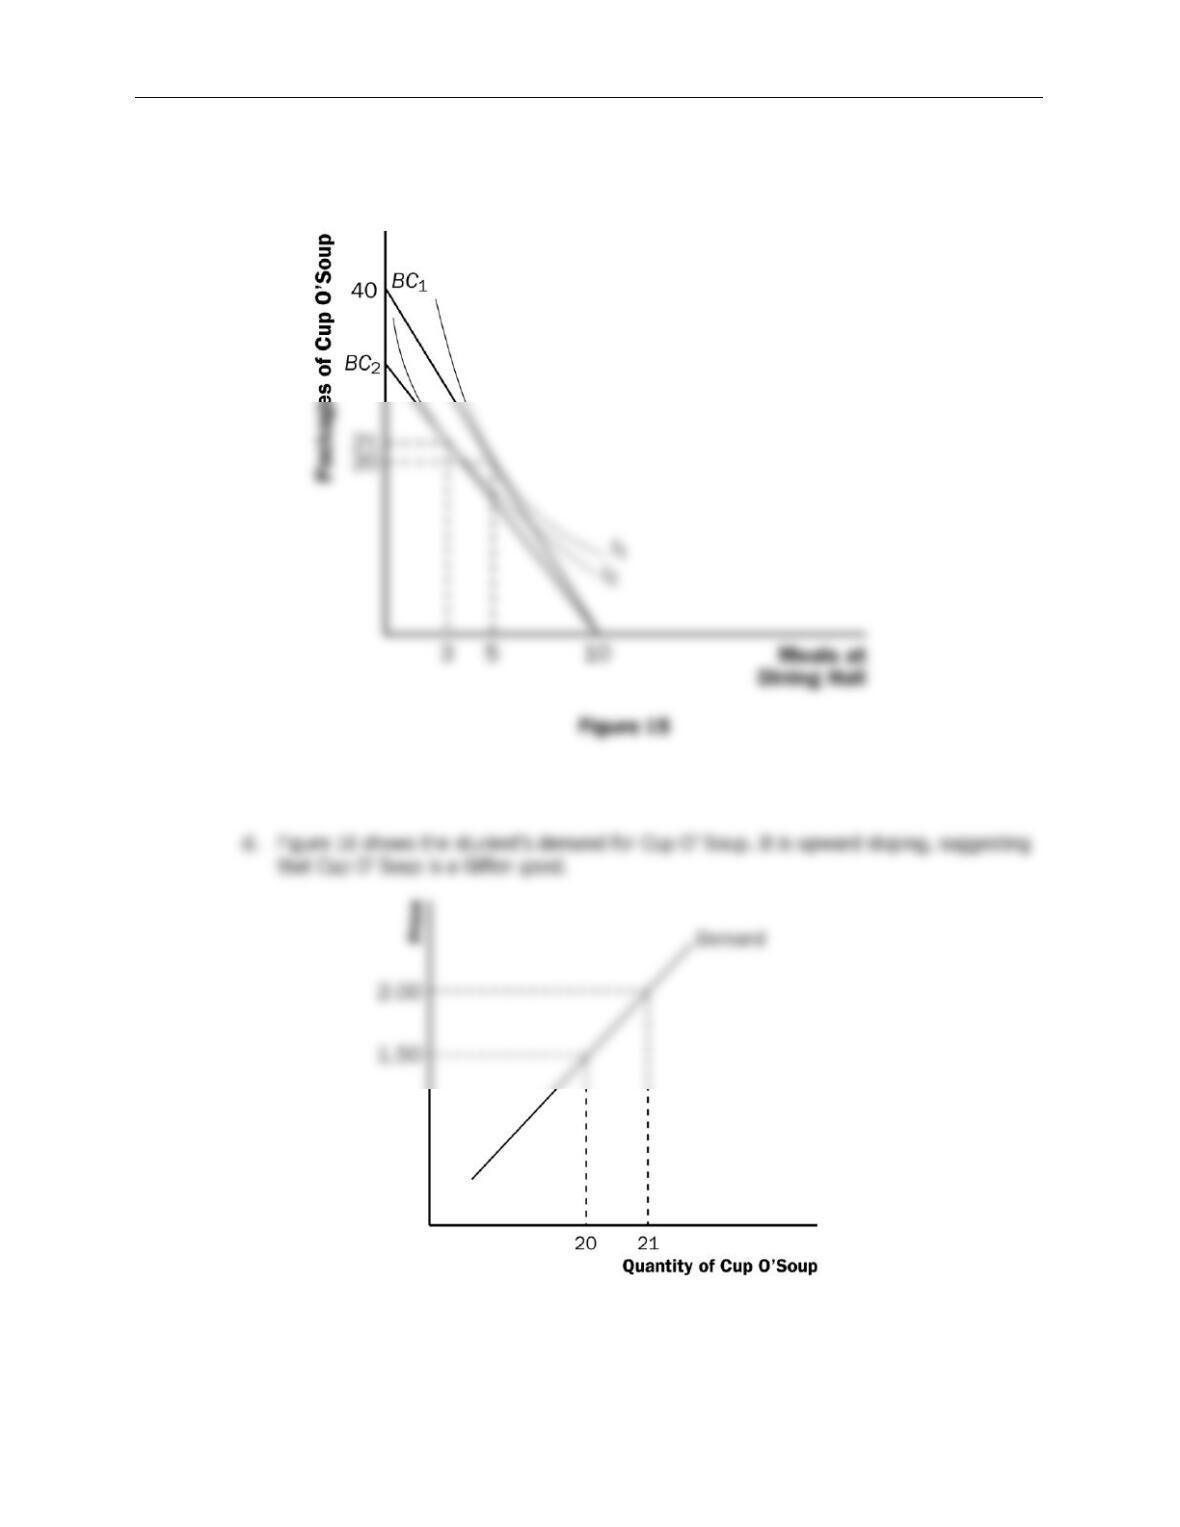
b. If the price of Cup O’ Soup rises to $2, the student’s budget constraint will get flatter
(see Figure 15). He will now spend $18 on dining hall meals (purchasing 3) and $42 on
Cup O’ Soup (purchasing 21 packages).
c. As the price of Cup O’ Soup rises, the student purchased more. This means that Cup O’
Soup is an inferior good for which the income effect outweighs the substitution effect.
Figure 16
Chapter 21/The Theory of Consumer Choice ❖ 387
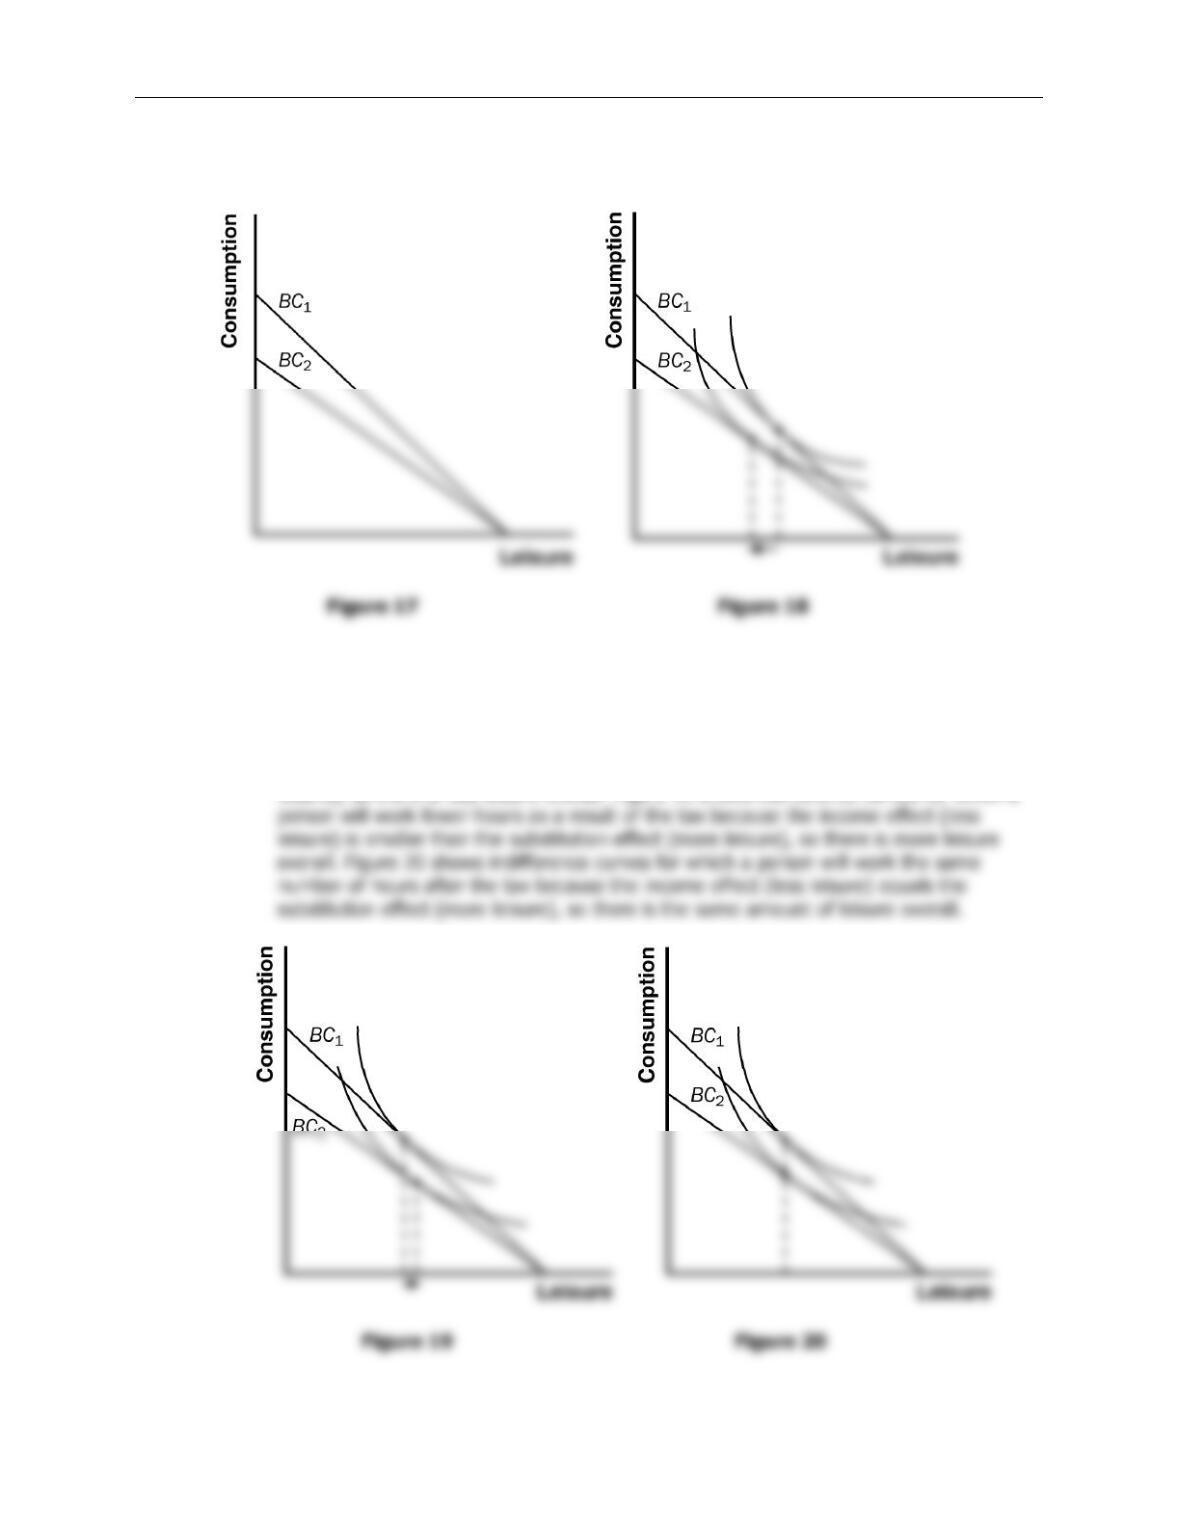
8. a. Budget constraint
BC
1 in Figure 17 shows the budget constraint if you pay no taxes.
Budget constraint
BC
2 shows the budget constraint with a 15 percent tax.
b. Figure 18 shows indifference curves for which a person will work more as a result of the
tax because the income effect (less leisure) outweighs the substitution effect (more
leisure), so there is less leisure overall. Figure 19 shows indifference curves for which a
388 ❖ Chapter 21/The Theory of Consumer Choice
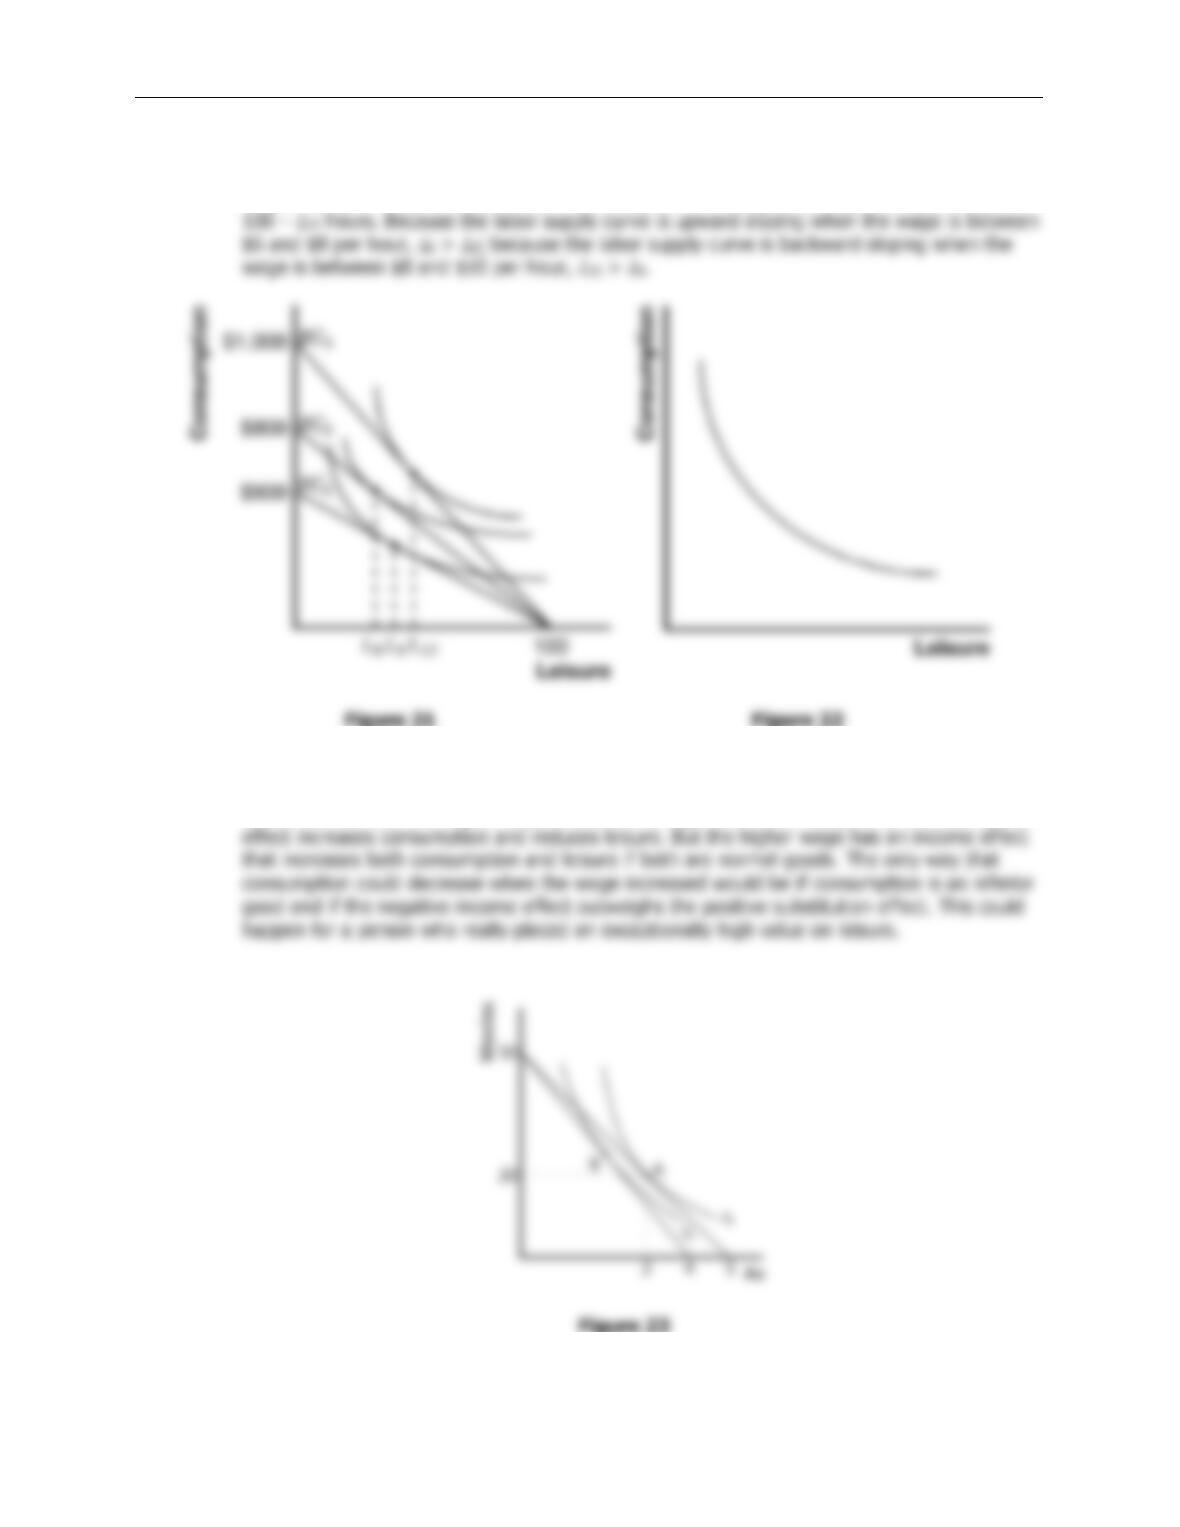
9. Figure 21 shows Sarah’s budget constraints and indifference curves if she earns $6 (
BC
1), $8
(
BC
2), and $10 (
BC
3) per hour. At a wage of $6 per hour, she works 100 –
L
6 hours; at a
wage of $8 per hour, she works 100 –
L
8 hours; and at a wage of $10 per hour, she works
10. Figure 22 shows the indifference curve between leisure and consumption that determines
how much a person works. An increase in the wage leads to both an income effect and a
substitution effect. The higher wage makes the budget constraint steeper, so the substitution
Chapter 21/The Theory of Consumer Choice ❖ 389
11. a. Figure 23 shows Daniel’s budget constraint. If he maximizes his utility at earning 3 A’s,
he will watch 20 movies.
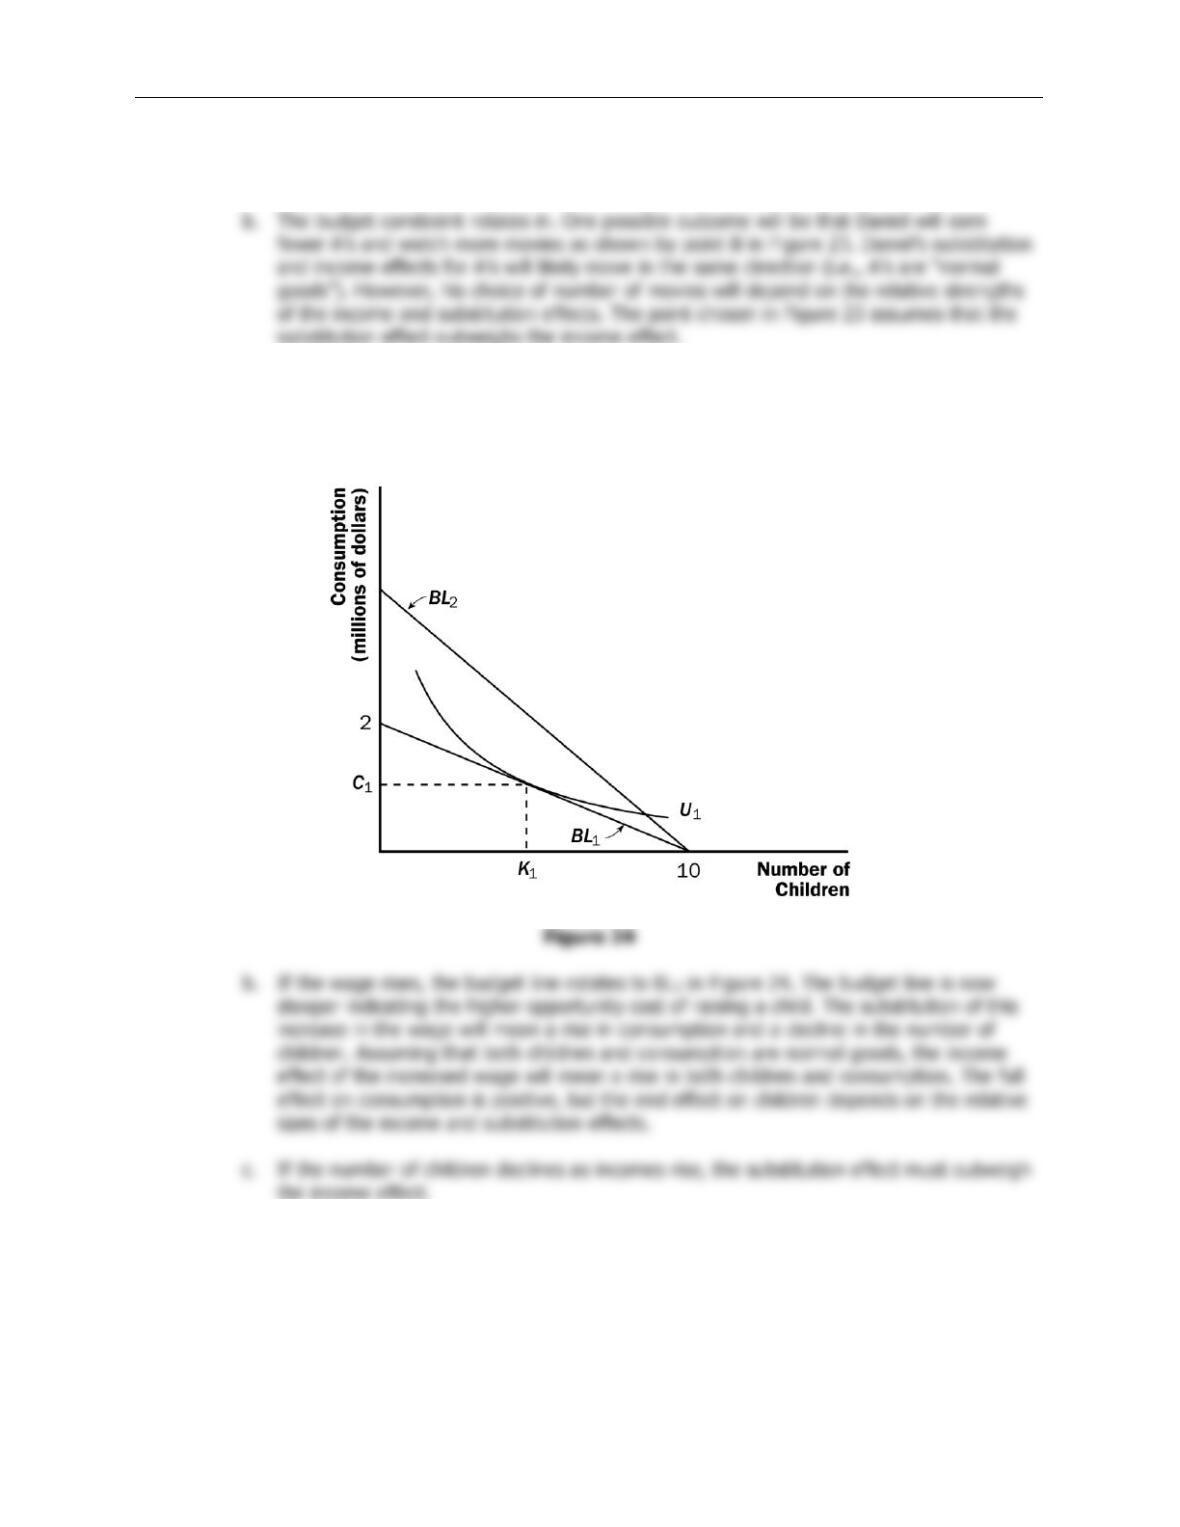
12. a. Figure 24 shows the budget constraint. The initial budget line is shown as BL1. If all
hours are spent raising children, 10 children can be raised. If all hours are spent working,
$2,000,000 can be earned for consumption. The individual maximizes utility by choosing
K1 children and a consumption level of C1.
13. If consumers do not buy less of a good when their incomes rise, the good in question must
be a normal good. For a normal good, the income and substitution effects both imply that
the consumer will buy less if the price rises.
390 ❖ Chapter 21/The Theory of Consumer Choice
Figure 25
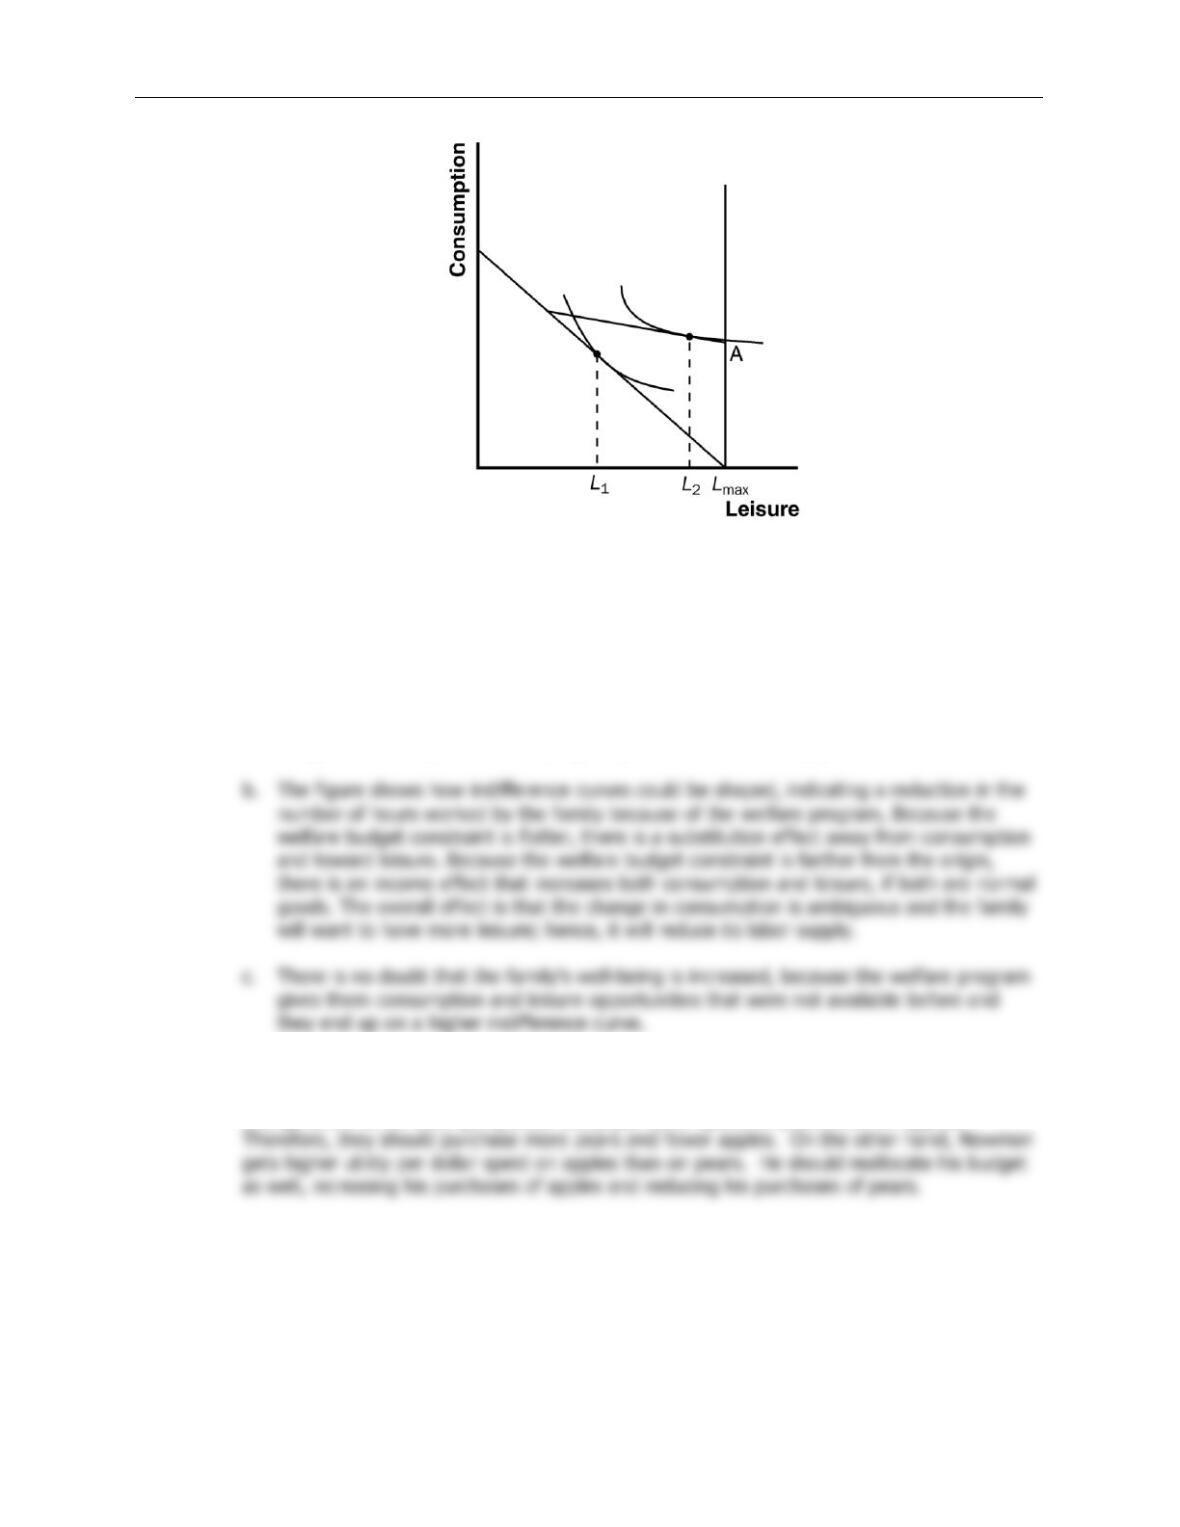
14. a. Figure 25 shows the effects of the welfare program. Without the program, the budget
constraint would begin on the horizontal axis at point
L
max when the family earns no labor
income and would have a slope equal to the wage rate. The program provides income of
a certain amount if the family earns no labor income, shown as the point A on the figure.
Then, if income is earned, the welfare payment is reduced, so the slope of the budget
line is less than the slope of the budget line without welfare. At the point where the two
budget lines meet, the welfare program provides no further support.
15. Utility is maximized when the marginal utility per dollar spent is equal across goods. Jerry
and Elaine are both purchasing the utility-maximizing combination of apples and pears.
George and Kramer each get greater utility per dollar spent on pears than on apples.