Problems (Group A)
P20-33A Calculating cost-volume-profit elements
Learning Objectives 1, 2
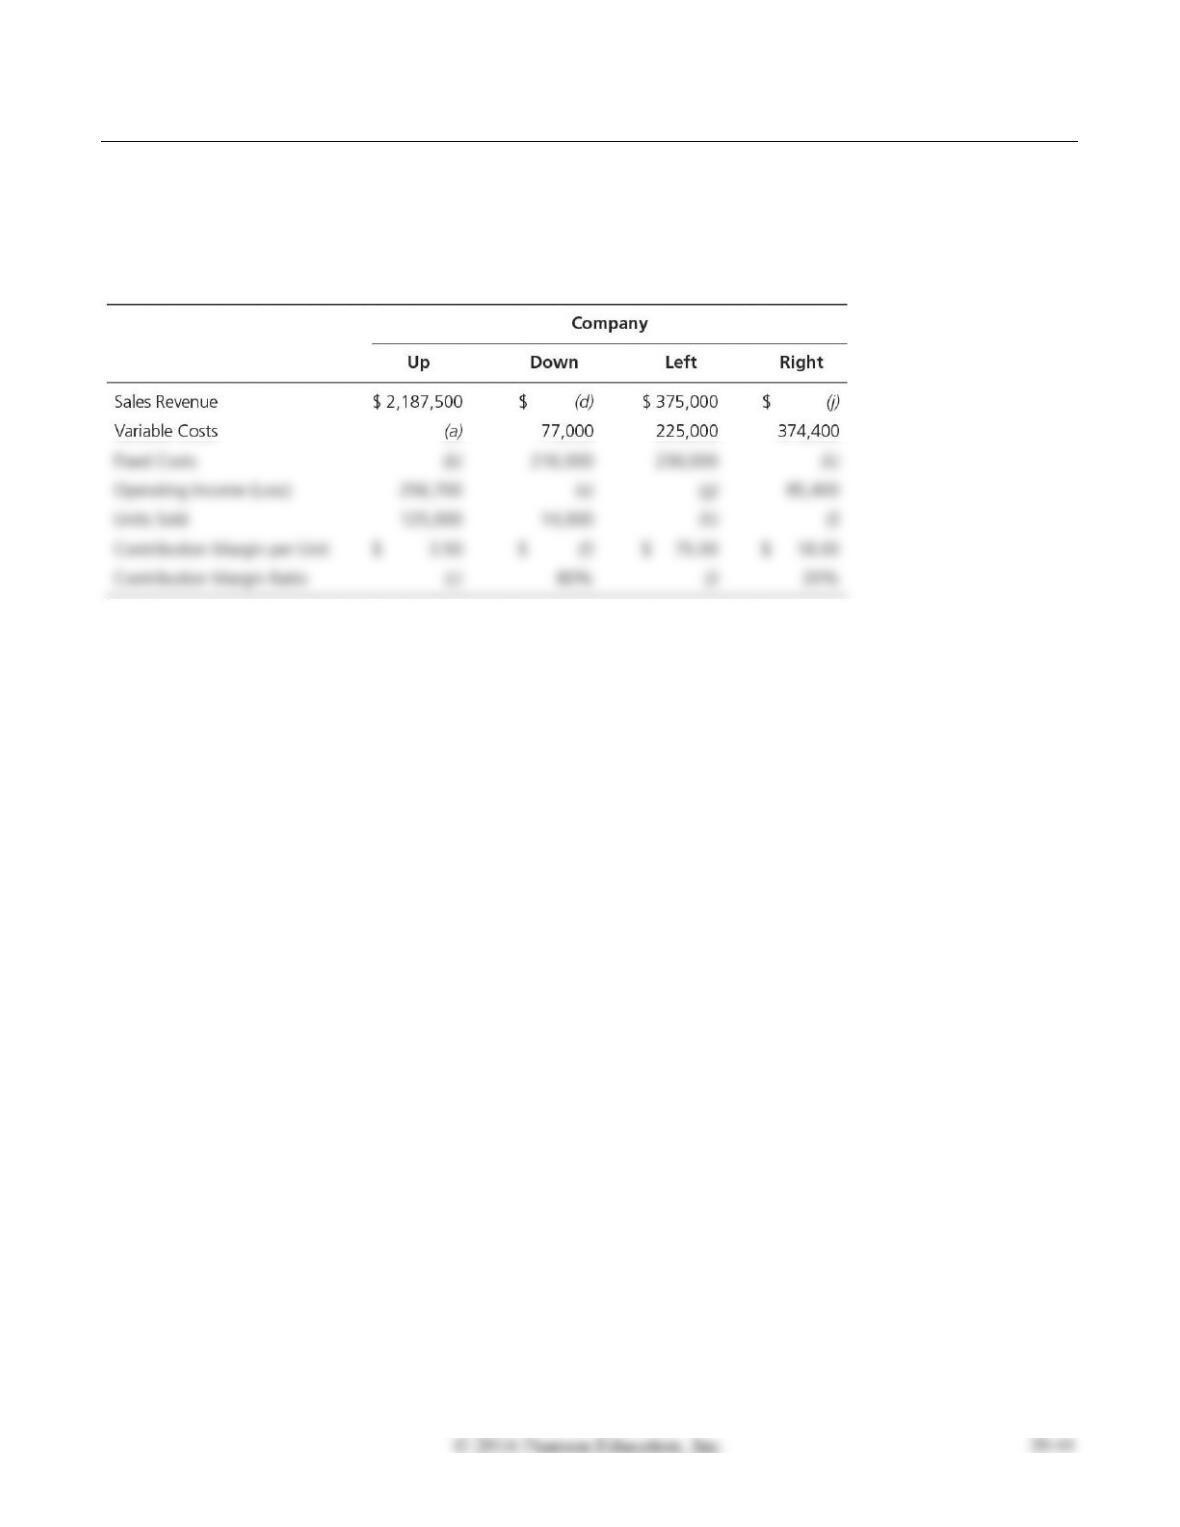
The budgets of four companies yield the following information:
Requirements
1. Fill in the blanks for each missing value. (Round the contribution margin per unit to the nearest
cent.)
2. Which company has the lowest breakeven point in sales dollars?
3. What causes the low breakeven point?
SOLUTION
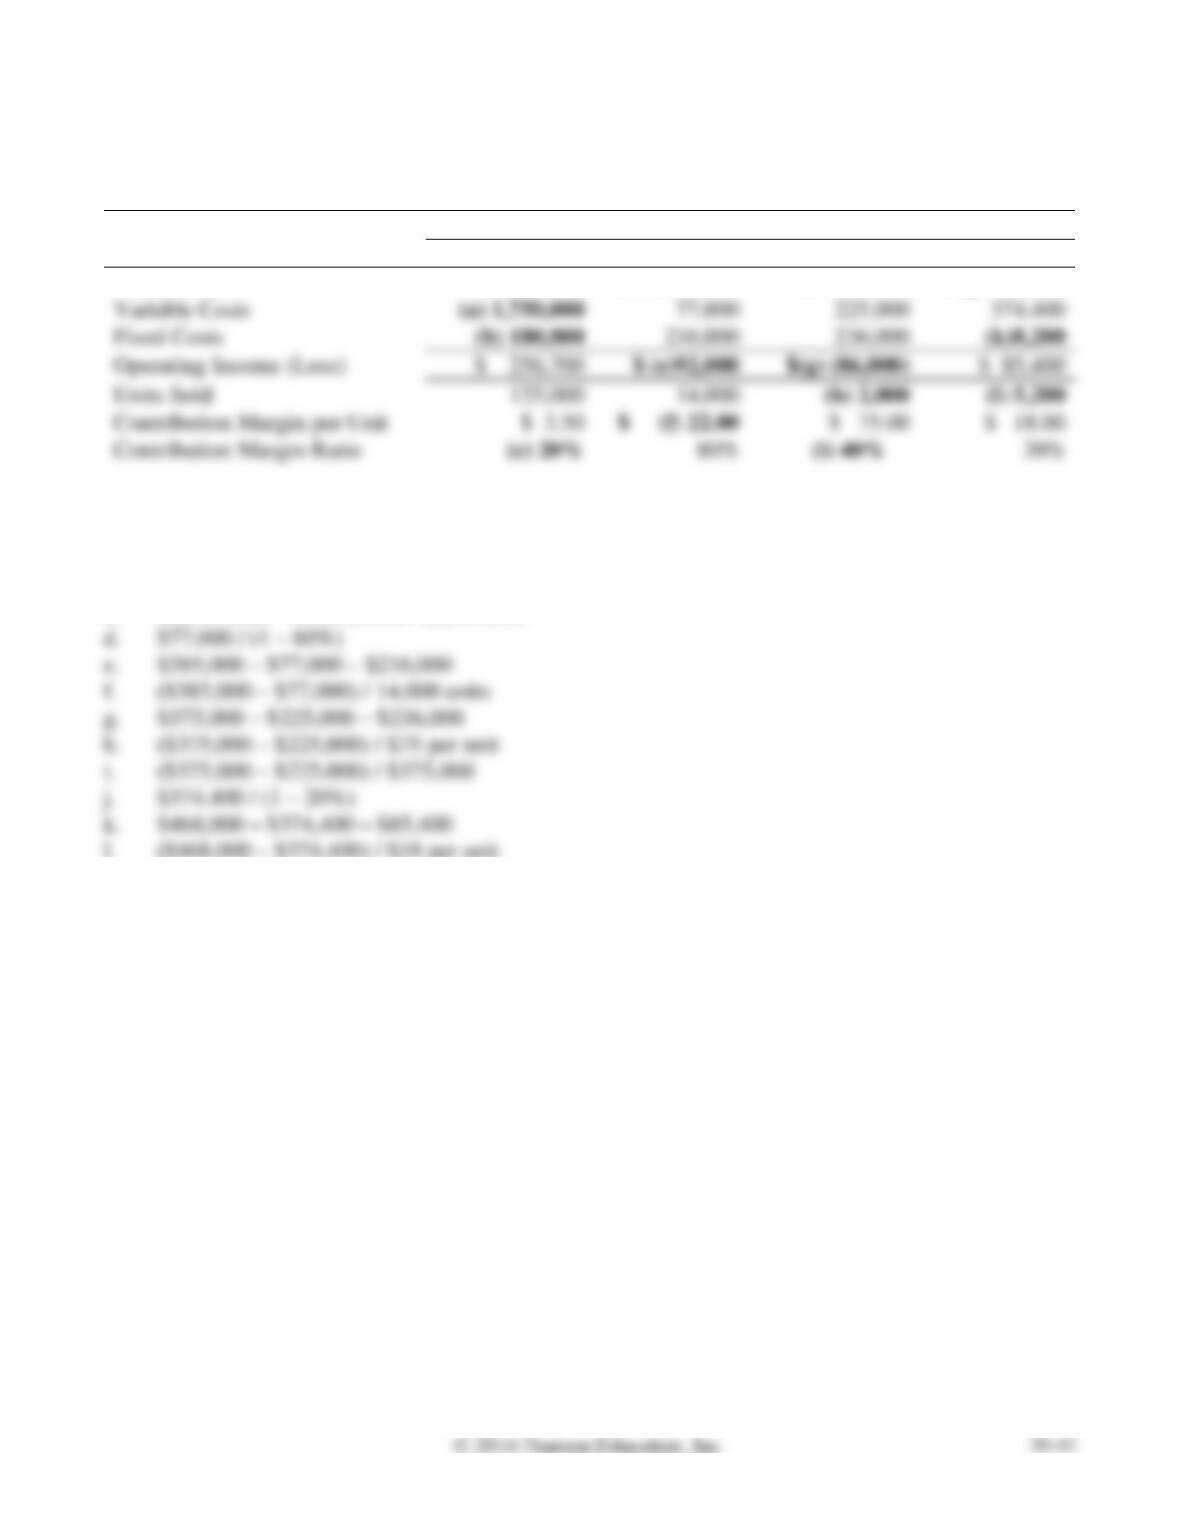
Requirement 1
Company
Up
Down
Left
Right
Sales Revenue
$ 2,187,500
$(d) 385,000
$ 375,000
$(j) 468,000
Fixed Costs
(b) 180,800
(k)8,200
Operating Income (Loss)
Units Sold
(l) 5,200
Contribution Margin Ratio
Calculations:
a.
$2,187,500 – (125,000 units × $3.50 per unit)
b.
$2,187,500 – $1,750,000 – $256,700
c.
($2,187,500 – $1,750,000) / $2,187,500
d.
$77,000 / (1 – 80%)
e.
$385,000 – $77,000 – $216,000
f.
($385,000 – $77,000) / 14,000 units
g.
$375,000 – $225,000 – $236,000
h.
($375,000 – $225,000) / $75 per unit
i.
($375,000 – $225,000) / $375,000
k.
$468,000 – $374,400 – $85,400
l.
($468,000 – $374,400) / $18 per unit
P20–33A, cont.
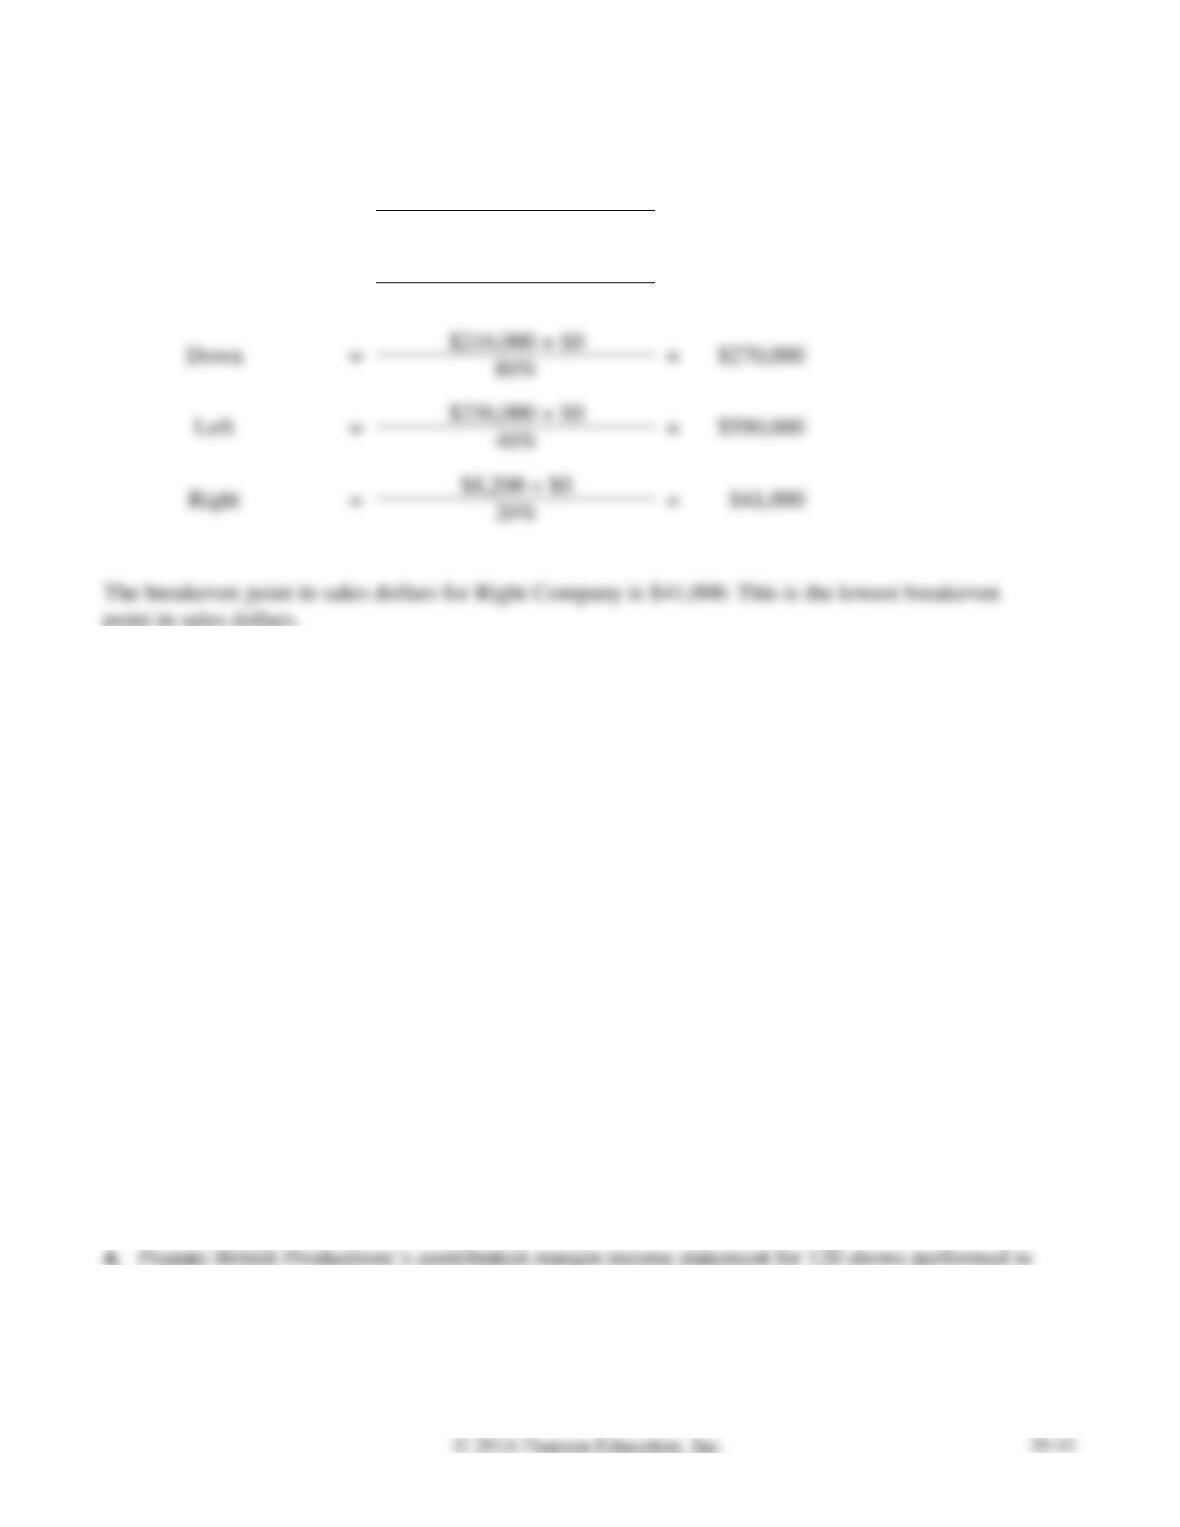
Requirement 2
Required sales in
dollars
=
Fixed costs + Target profit
Contribution margin ratio
Up
=
$180,800 + $0
=
$904,000
20%
=
$216,000 + $0
=
$270,000
80%
=
$236,000 + $0
=
$590,000
40%
=
20%
point in sales dollars.
Requirement 3
The low breakeven point for Right Company is primarily caused by its low fixed costs.
P20-34A Calculating break even sales and sales to earn a target profit; preparing a contribution
margin income statement
Learning Objectives 1, 2, 3
4. CM $3,936,000
British Productions performs London shows. The average show sells 1,000 tickets at $60 per ticket.
There are 120 shows per year. No additional shows can be held as the theater is also used by other
production companies. The average show has a cast of 60, each earning a net average of $320 per show.
The cast is paid after each show. The other variable cost is a program-printing cost of $8 per guest.
Annual fixed costs total $459,200.
Requirements
1. Compute revenue and variable costs for each show.
2. Use the equation approach to compute the number of shows British Productions must perform each
year to break even.
3. Use the contribution margin ratio approach to compute the number of shows needed each year to
earn a profit of $4,264,000. Is this profit goal realistic? Give your reasoning.
2016. Report only two categories of costs: variable and fixed.
SOLUTION
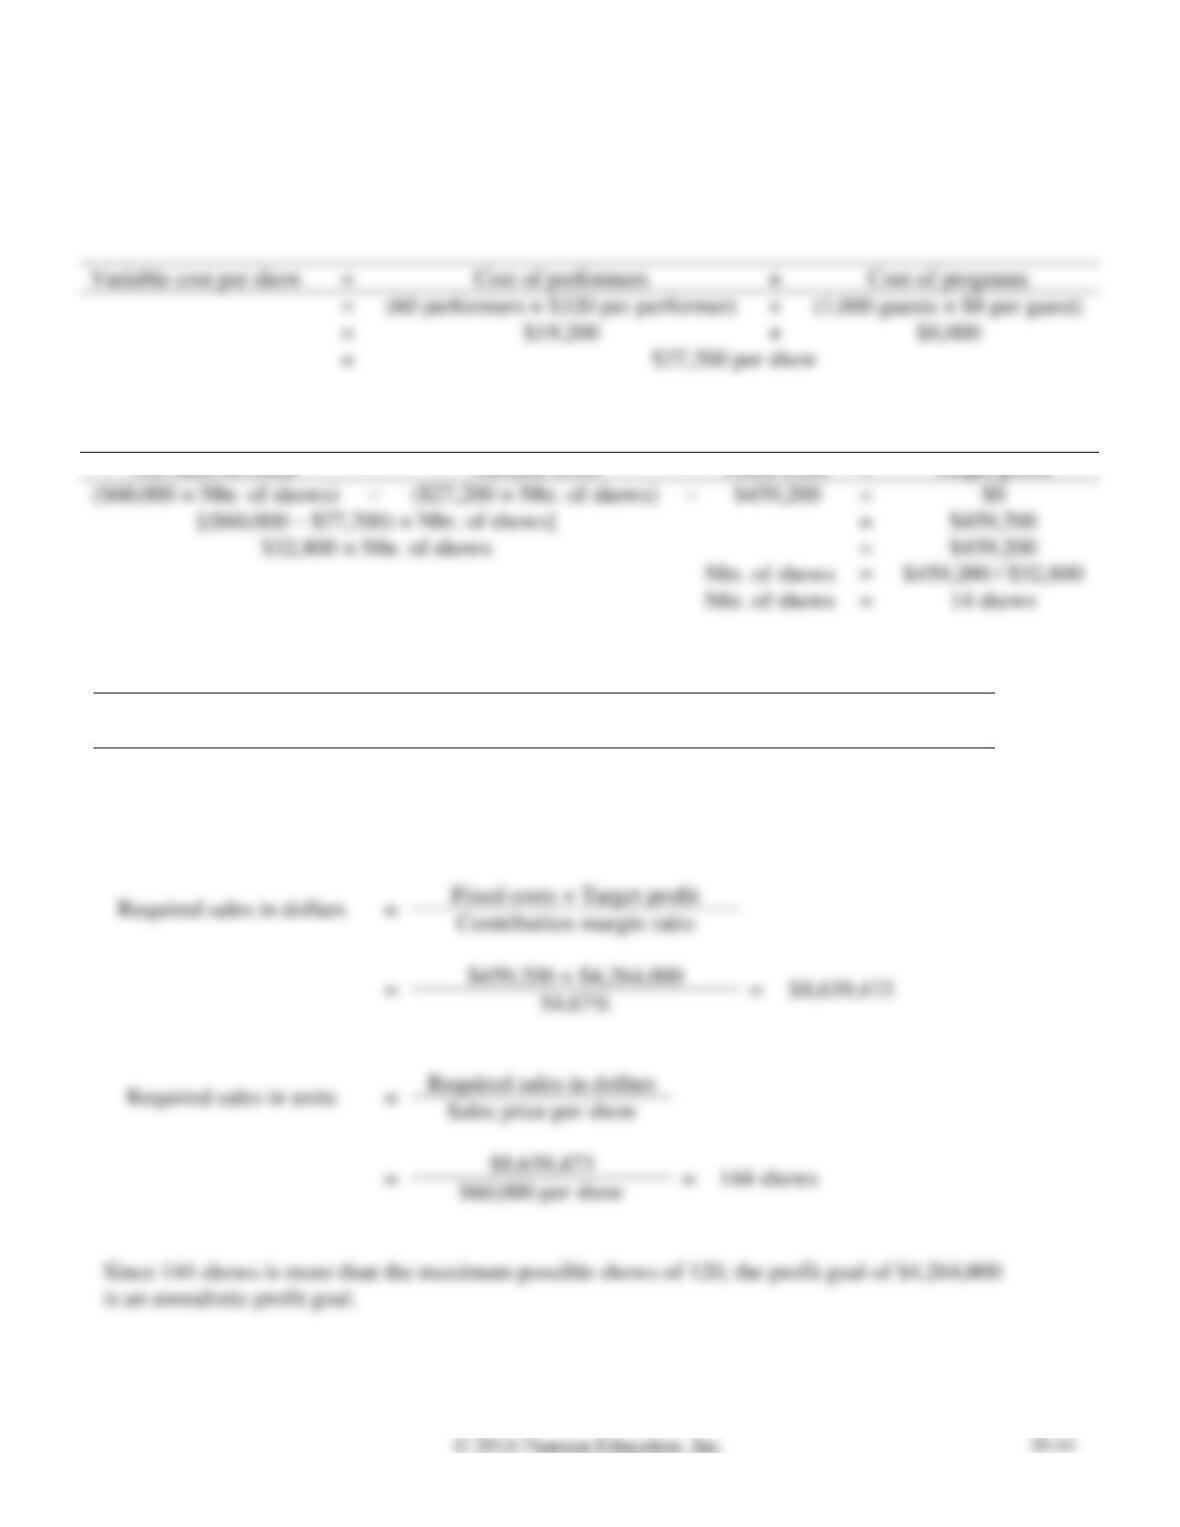
Requirement 1
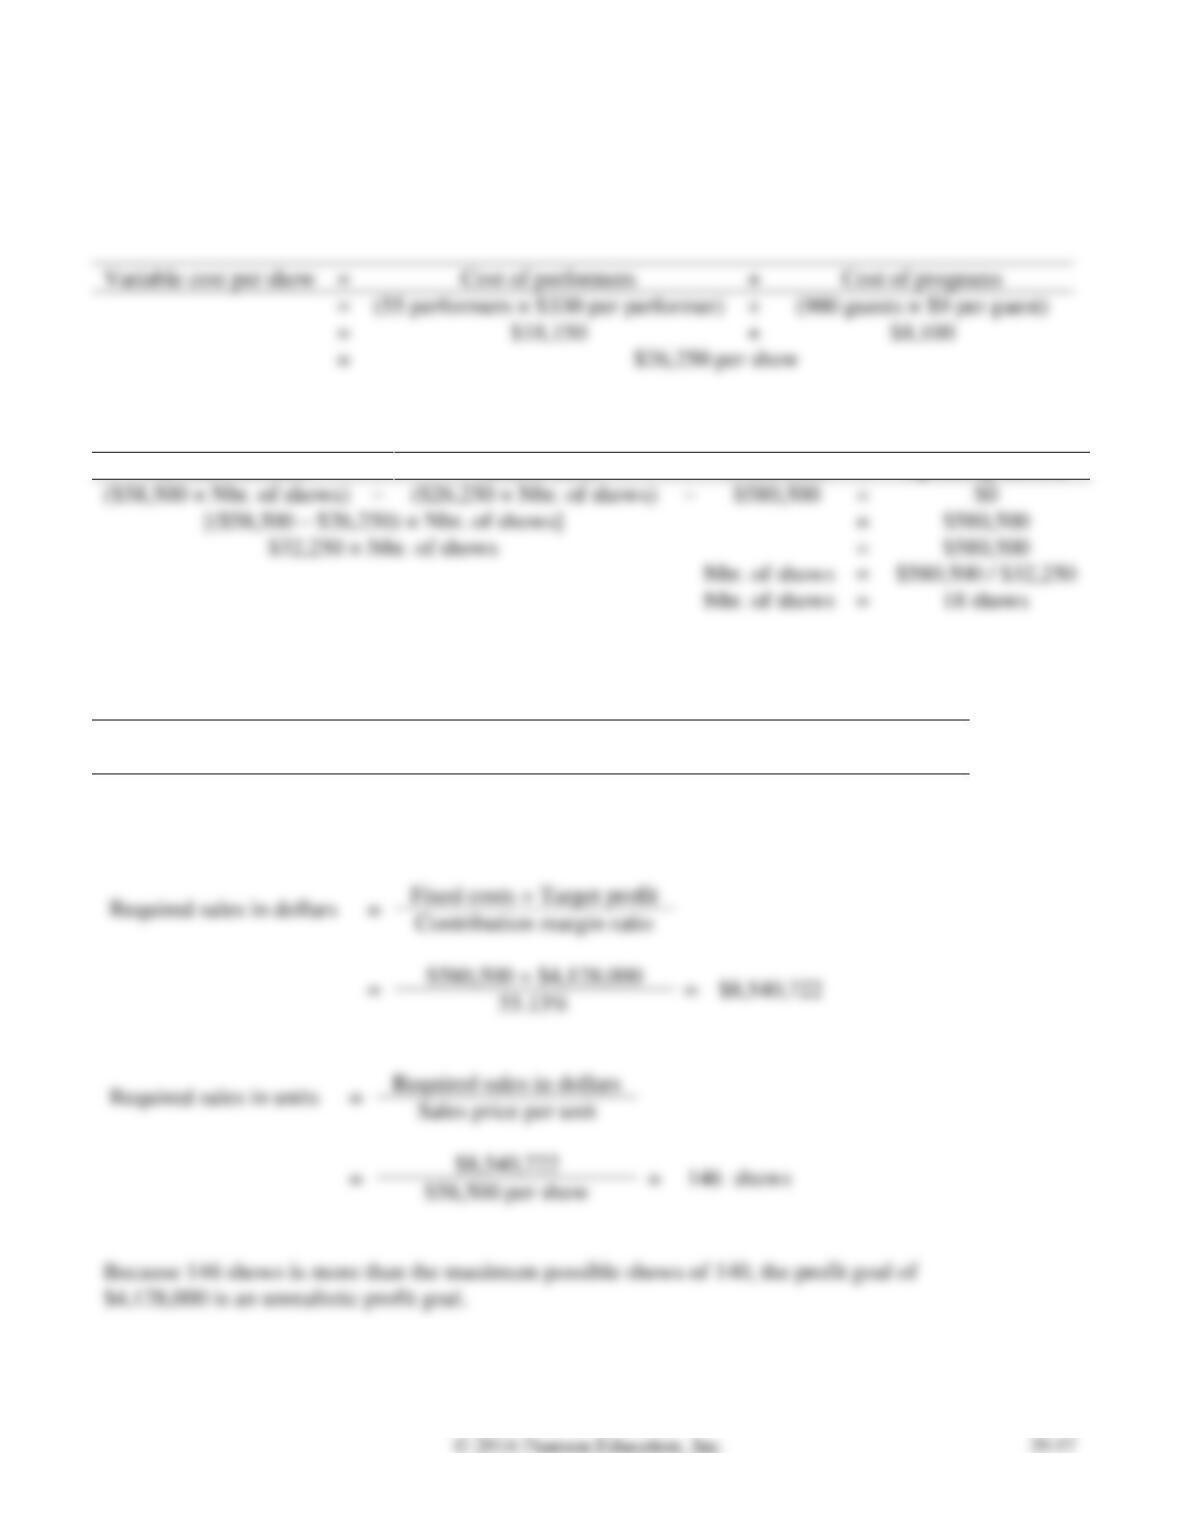
Sales revenue per show = 1,000 tickets × $60 per ticket = $60,000
Variable cost per show
=
+
=
(60 performers × $320 per performer)
(1,000 guests × $8 per guest)
=
=
Requirement 2
Net sales revenue
–
Variable costs
–
Fixed costs
=
Target profit
–
–
=
=
$459,200
=
$459,200
=
$459,200 / $32,800
=
14 shows
Requirement 3
Contribution margin ratio
=
Contribution margin
/
Net sales revenue
=
(Net sales revenue – Variable costs)
/
Net sales revenue
=
($60,000 – $27,200)
/
$60,000
=
$32,800
/
$60,000
=
54.67%
Required sales in dollars
$60,000 per show
is an unrealistic profit goal.
P20-34A, cont.
Requirement 4
BRITISH PRODUCTIONS
Variable Costs
Fixed Costs
Contribution Margin Income Statement
P20-35A Analyzing CVP relationships
Learning Objectives 2, 3, 4
2. 65.00%
Kincaid Company sells flags with team logos. Kincaid has fixed costs of $639,600 per year plus variable
costs of $4.20 per flag. Each flag sells for $12.00.
Requirements
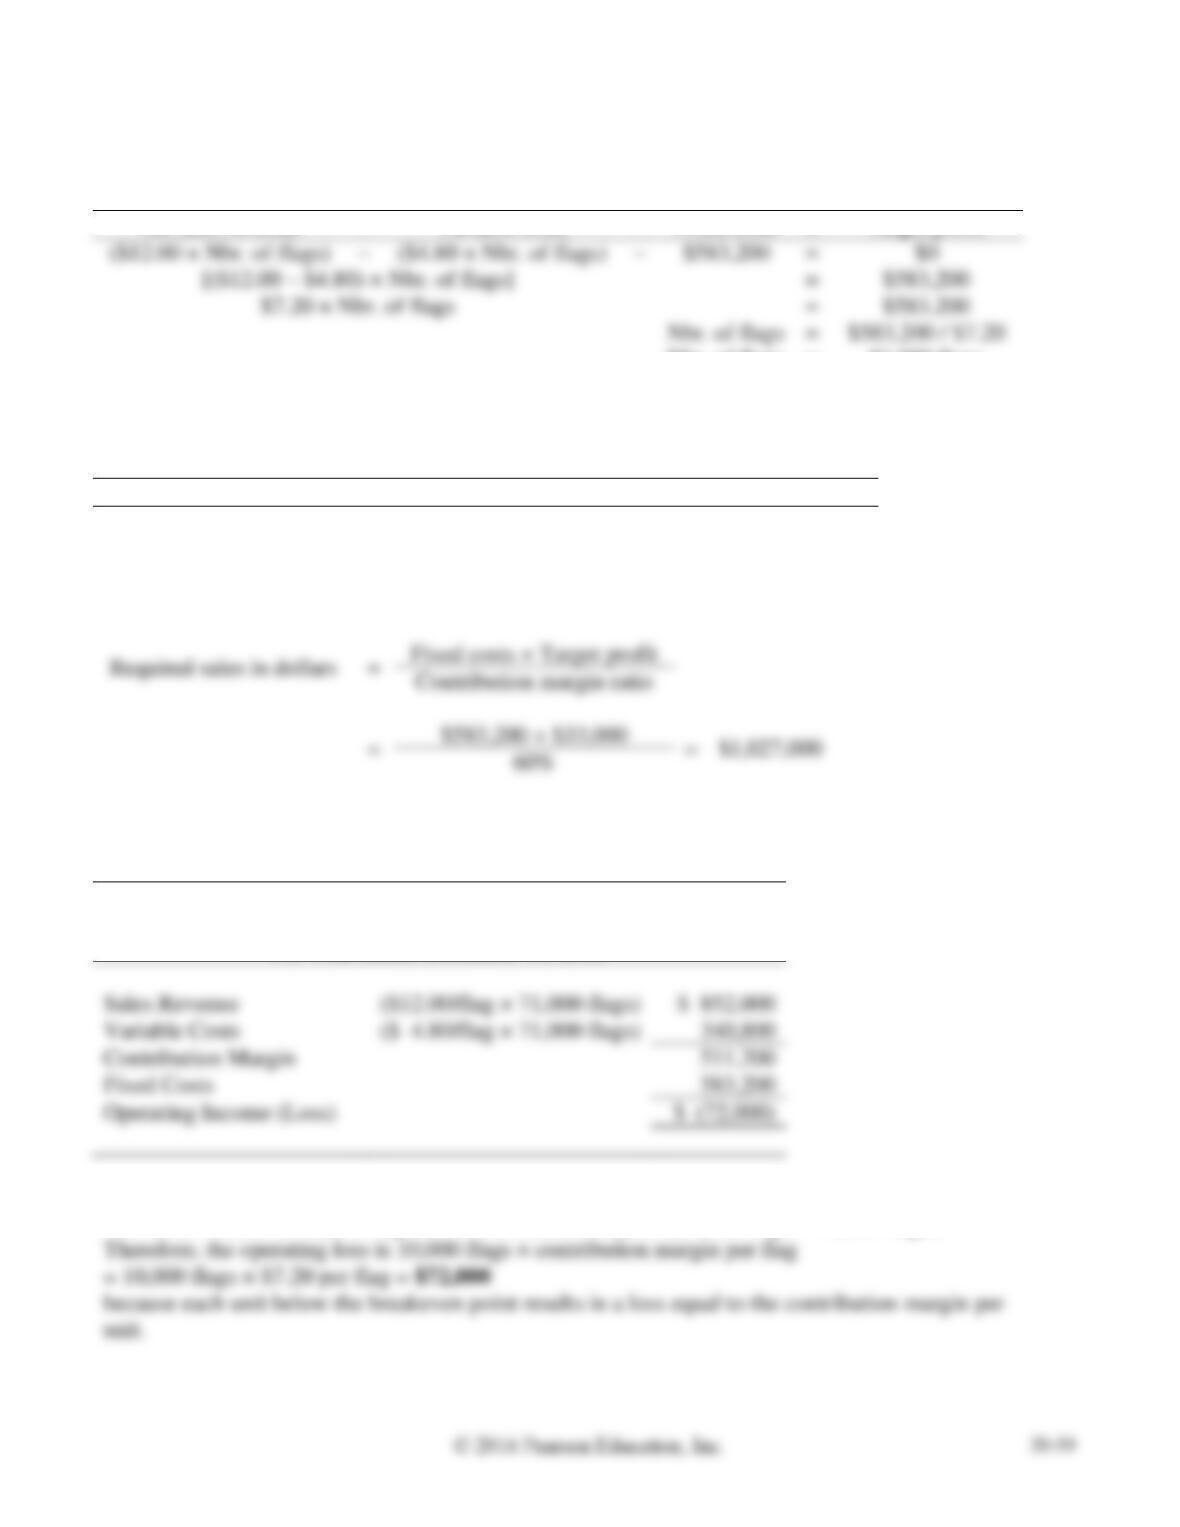
1. Use the equation approach to compute the number of flags Kincaid must sell each year to break
even.
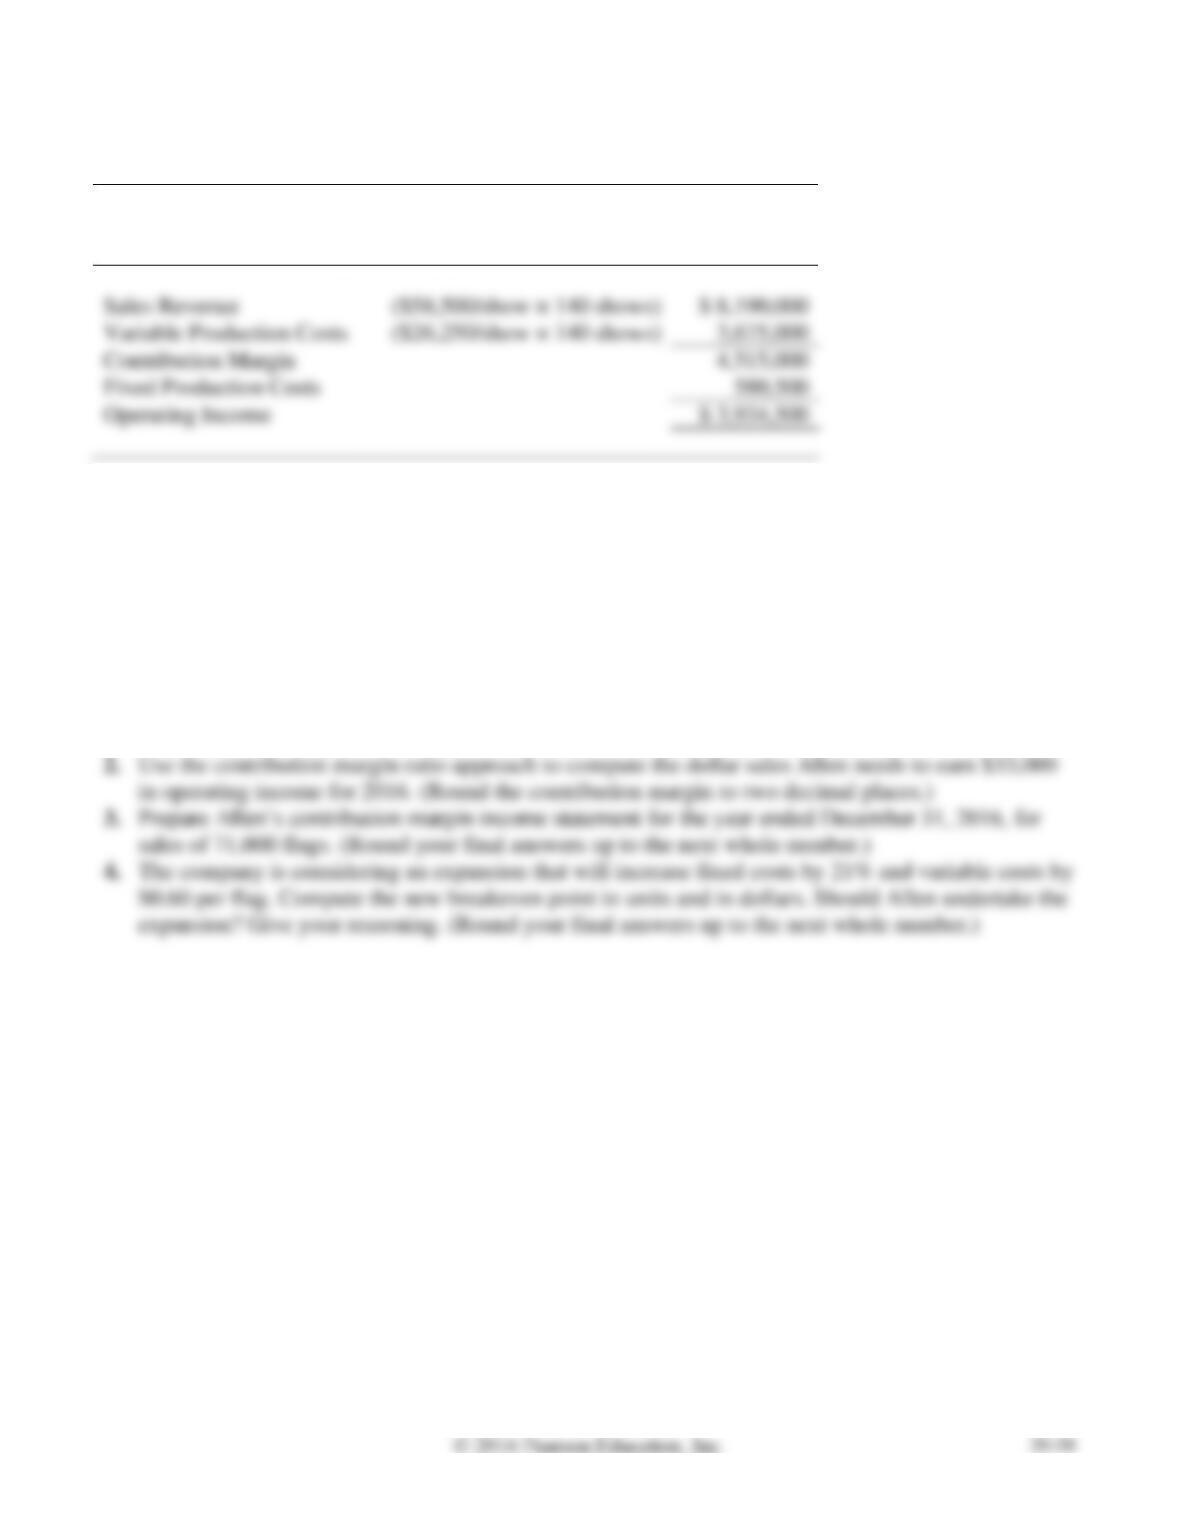
2. Use the contribution margin ratio approach to compute the dollar sales Kincaid needs to earn
$32,500 in operating income for 2016. (Round the contribution margin ratio to two decimal places.)
3. Prepare Kincaid’s contribution margin income statement for the year ended December 31, 2016, for
sales of 78,000 flags. (Round your final answers up to the next whole number.)
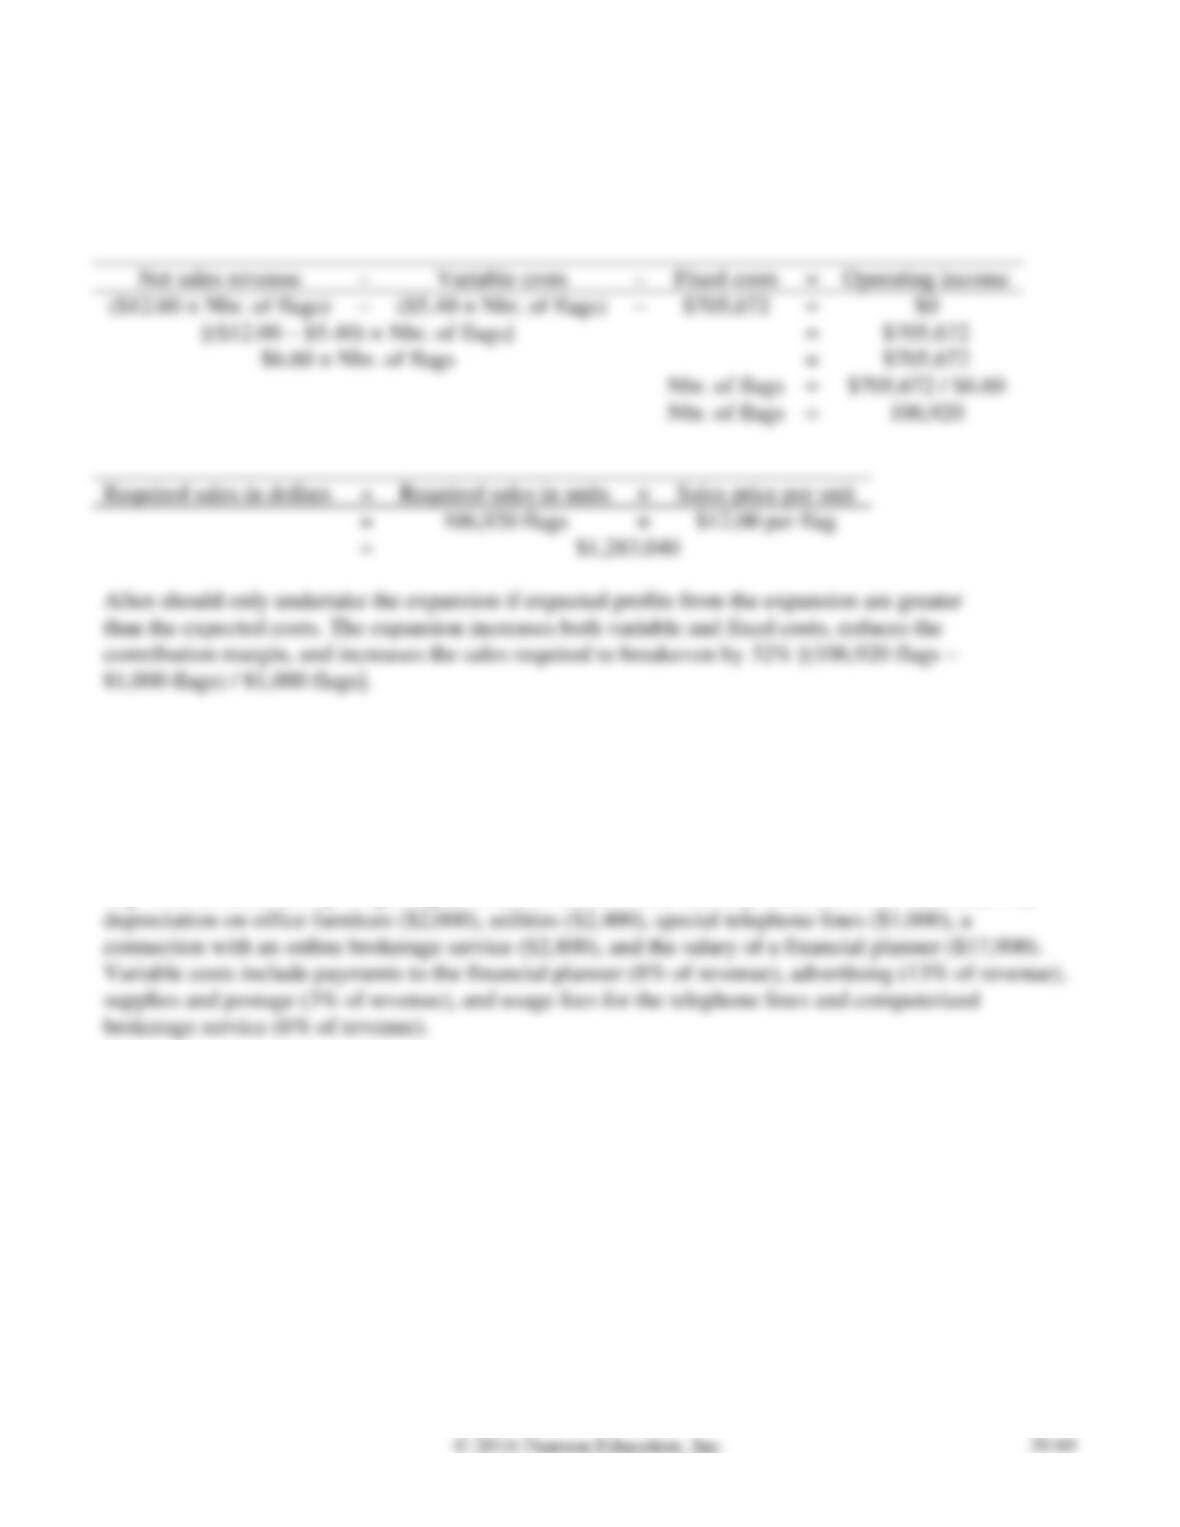
4. The company is considering an expansion that will increase fixed costs by 17% and variable costs by
$0.60 per flag. Compute the new breakeven point in units and in dollars. Should Kincaid undertake
the expansion? Give your reasoning. (Round your final answers up to the next whole number.)
SOLUTION
Requirement 1
Net sales revenue
–
Variable costs
–
Fixed costs
=
Target profit
($12 × Nbr. of flags)
–
($4.20 × Nbr. of flags)
–
=
$0
=
$639,600
=
$639,600
Nbr. of flags
=
$639,600 / $7.80
Nbr. of flags
=
82,000 flags
Requirement 2
Contribution margin ratio
=
Contribution margin
/
Net sales revenue
=
$12.00 – $4.20
/
$12
=
$7.80
/
$12
=
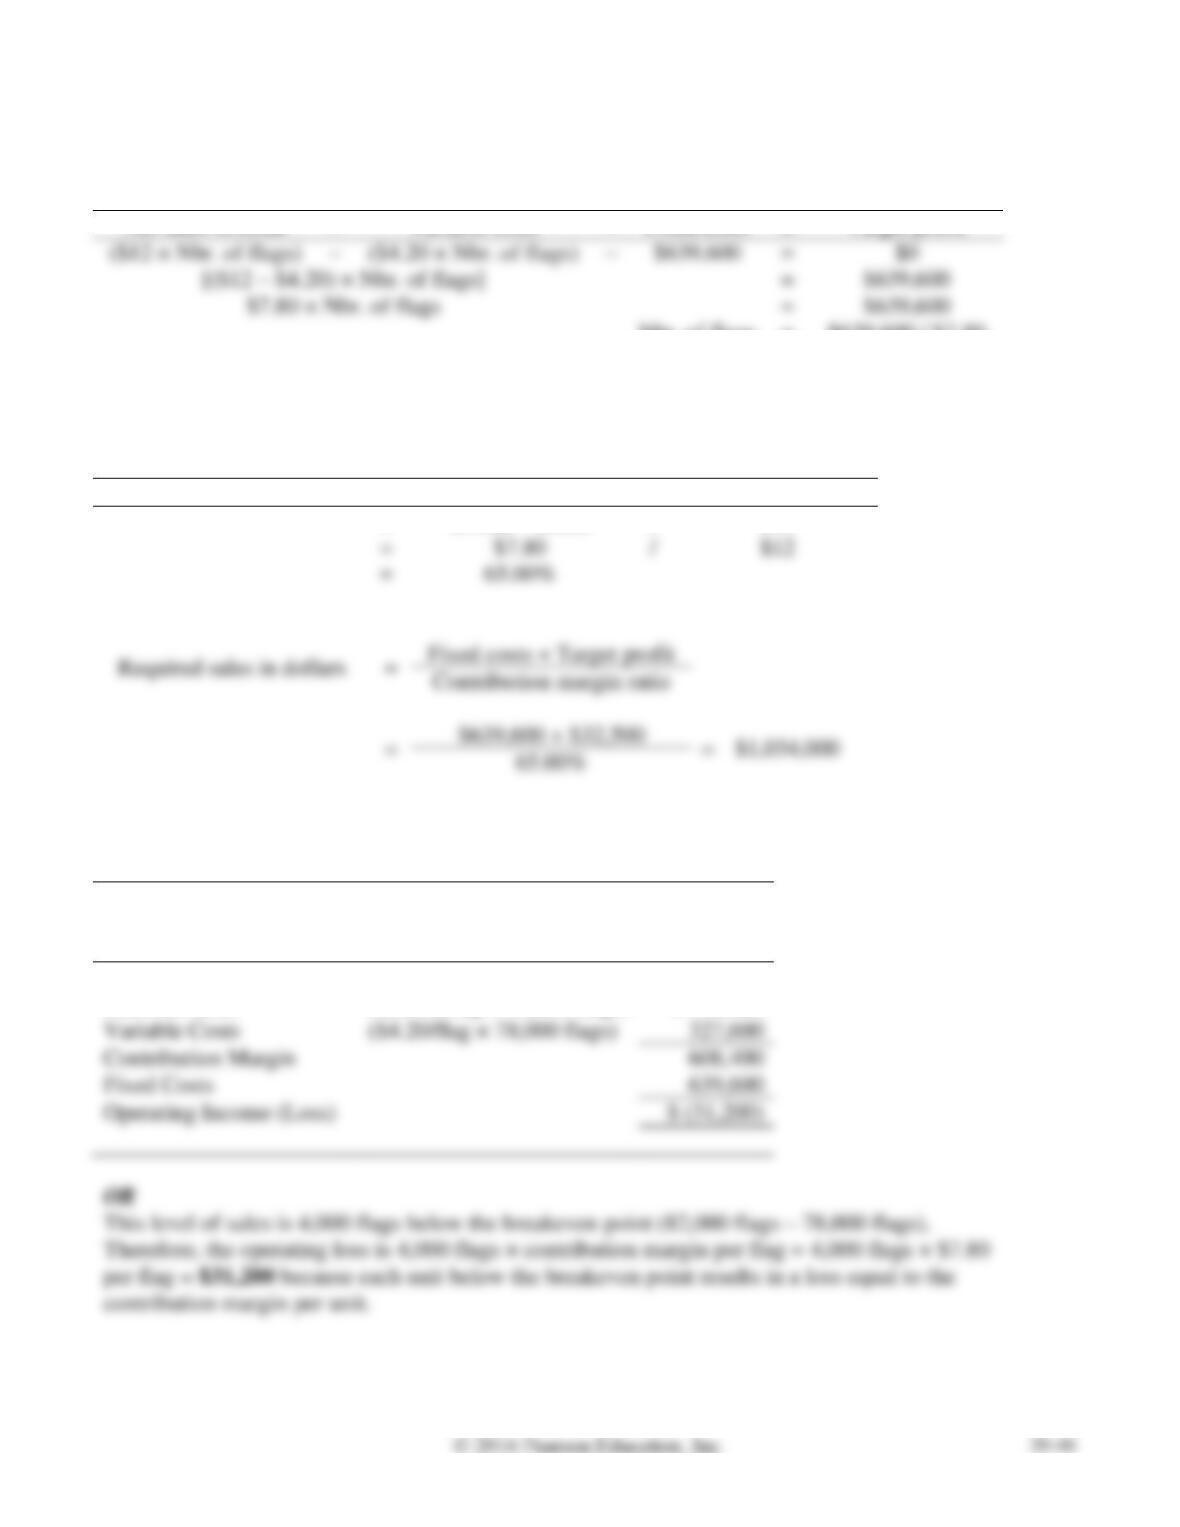
Fixed costs + Target profit
Contribution margin ratio
Requirement 3
KINCAID COMPANY
Contribution Margin Income Statement
For Year Ended December 31, 2016
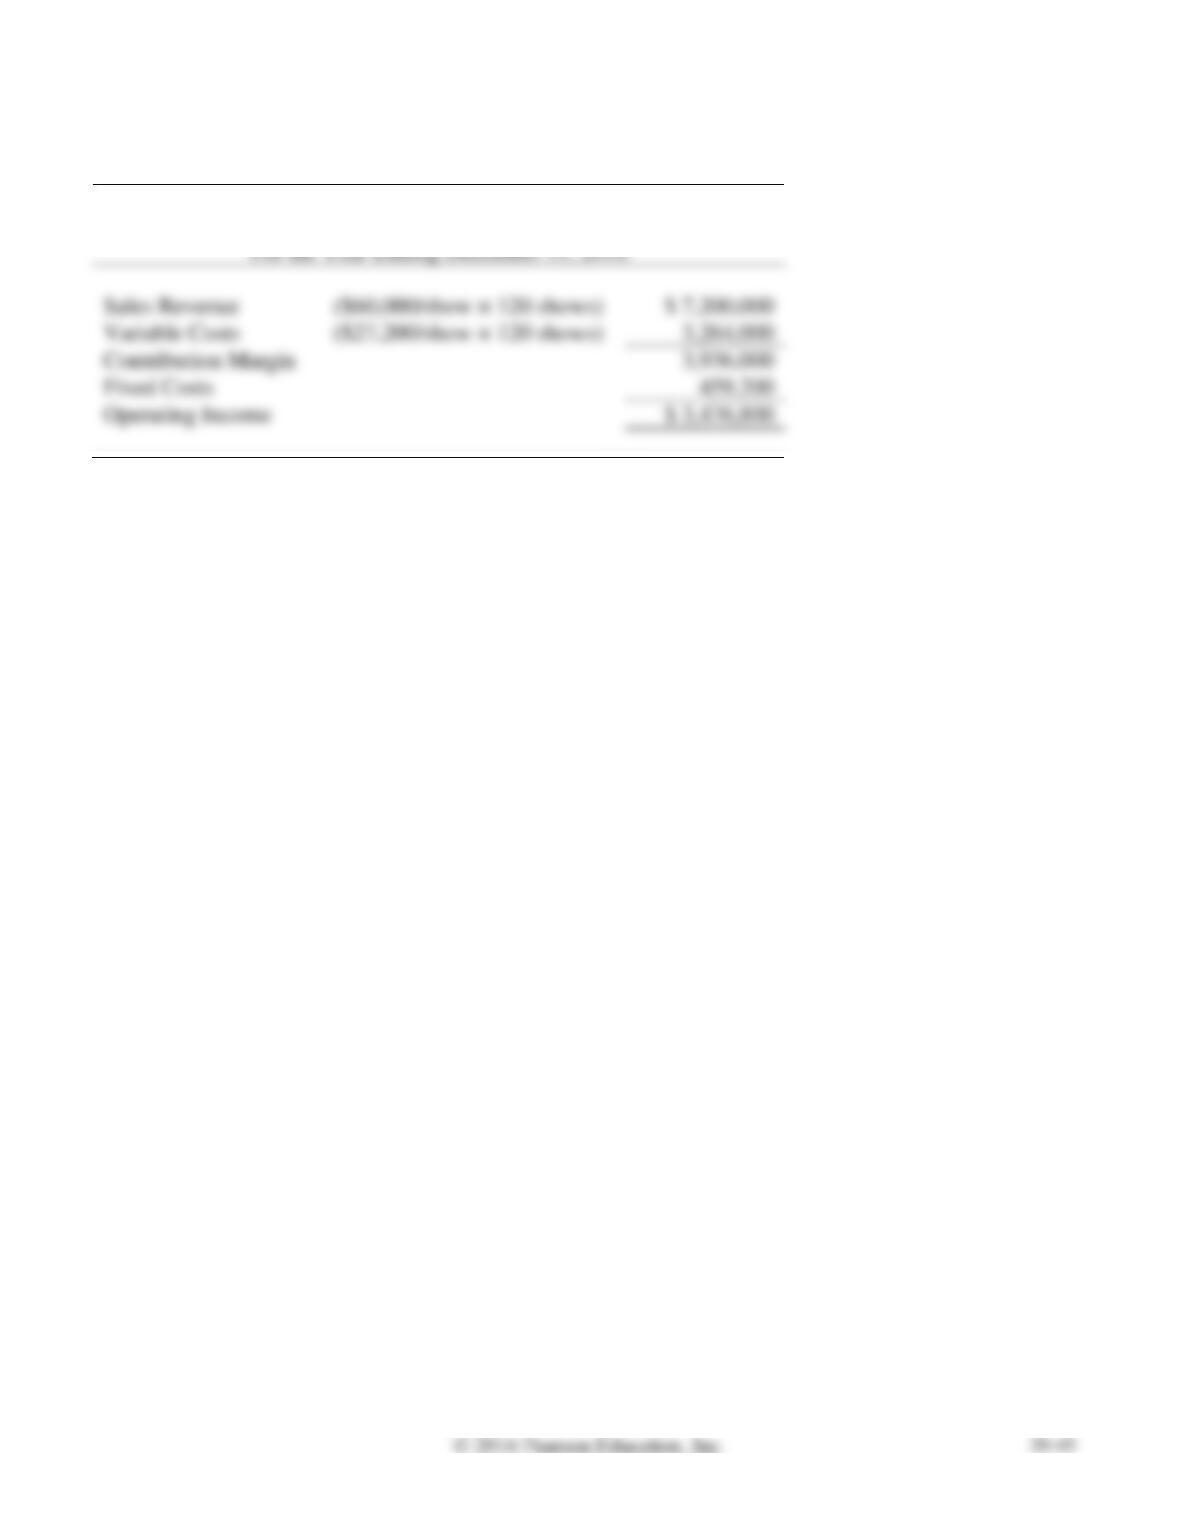
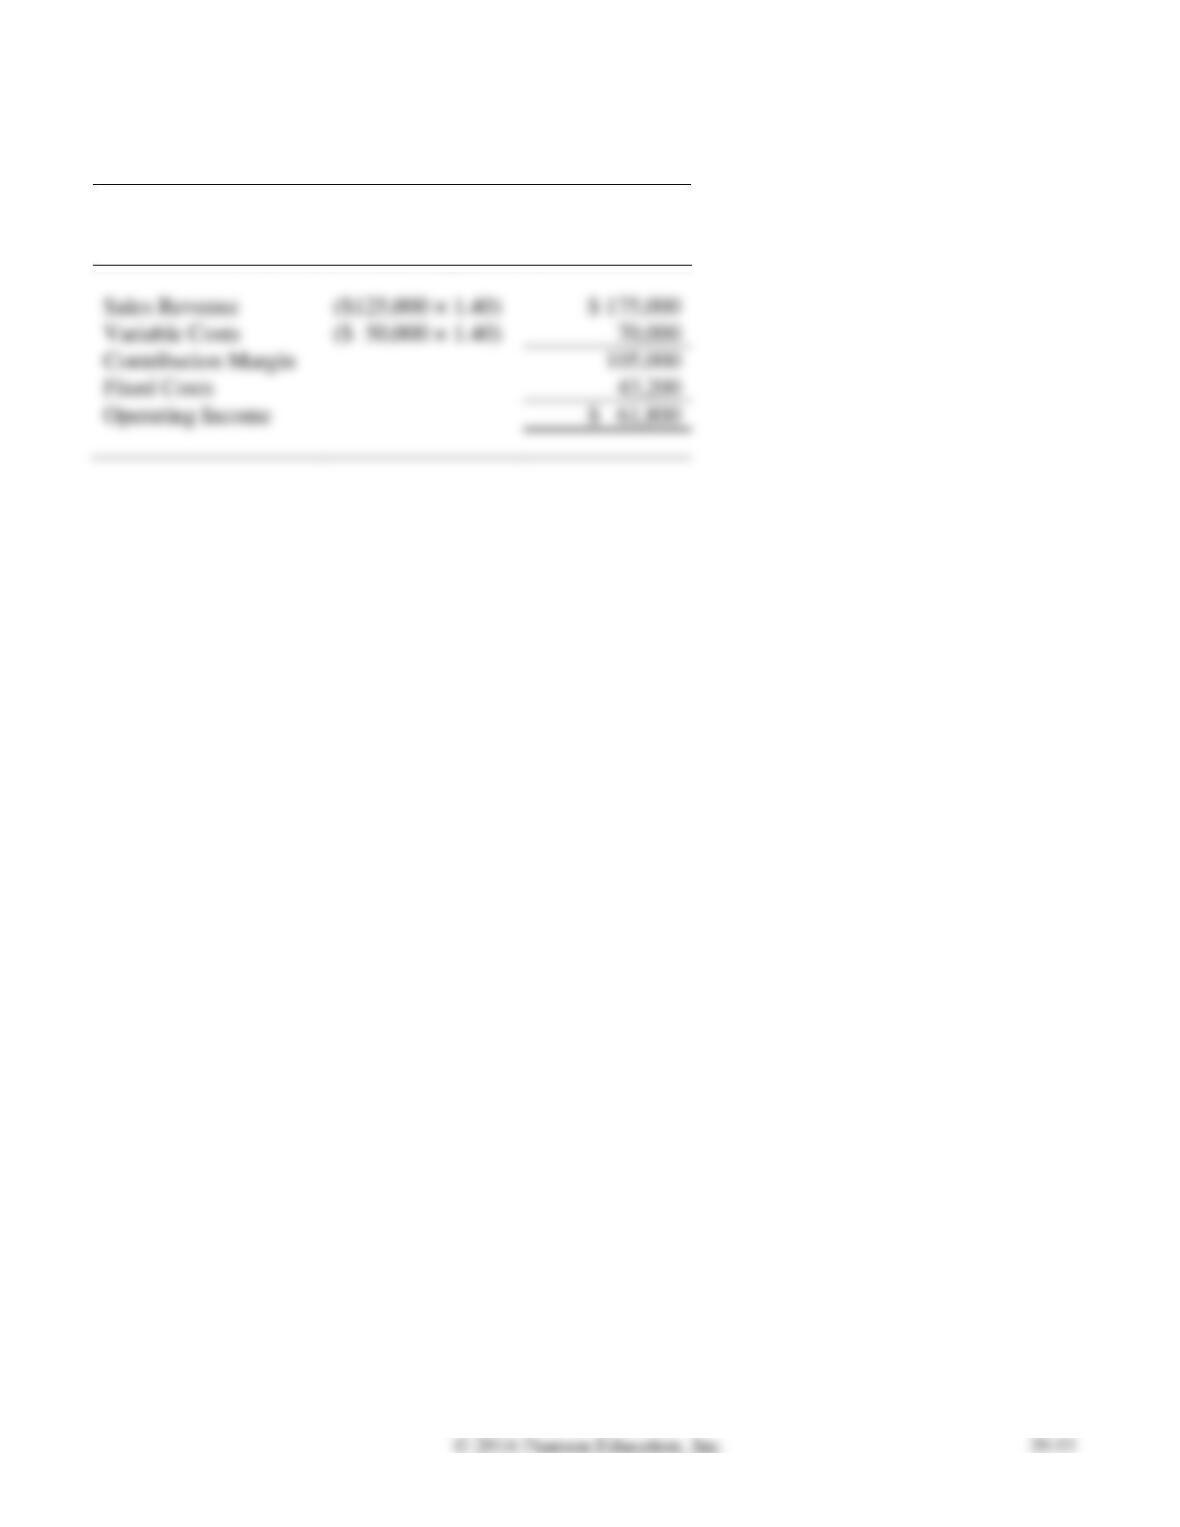
Sales Revenue
($12.00/flag × 78,000 flags)
$ 936,000
Variable Costs
($4.20/flag × 78,000 flags)
Contribution Margin
Fixed Costs
Operating Income (Loss)
contribution margin per unit.
P20-35A, cont.
Requirement 4
Revised variable cost
=
$4.20 per flag + $0.60 per flag = $4.80 per flag
Revised fixed cost
=
$639,600 × 1.17 = $748,332
Net sales revenue
–
Variable costs
–
Fixed costs
=
Target profit
–
=
=
=
$748,332
=
$748,332
=
=
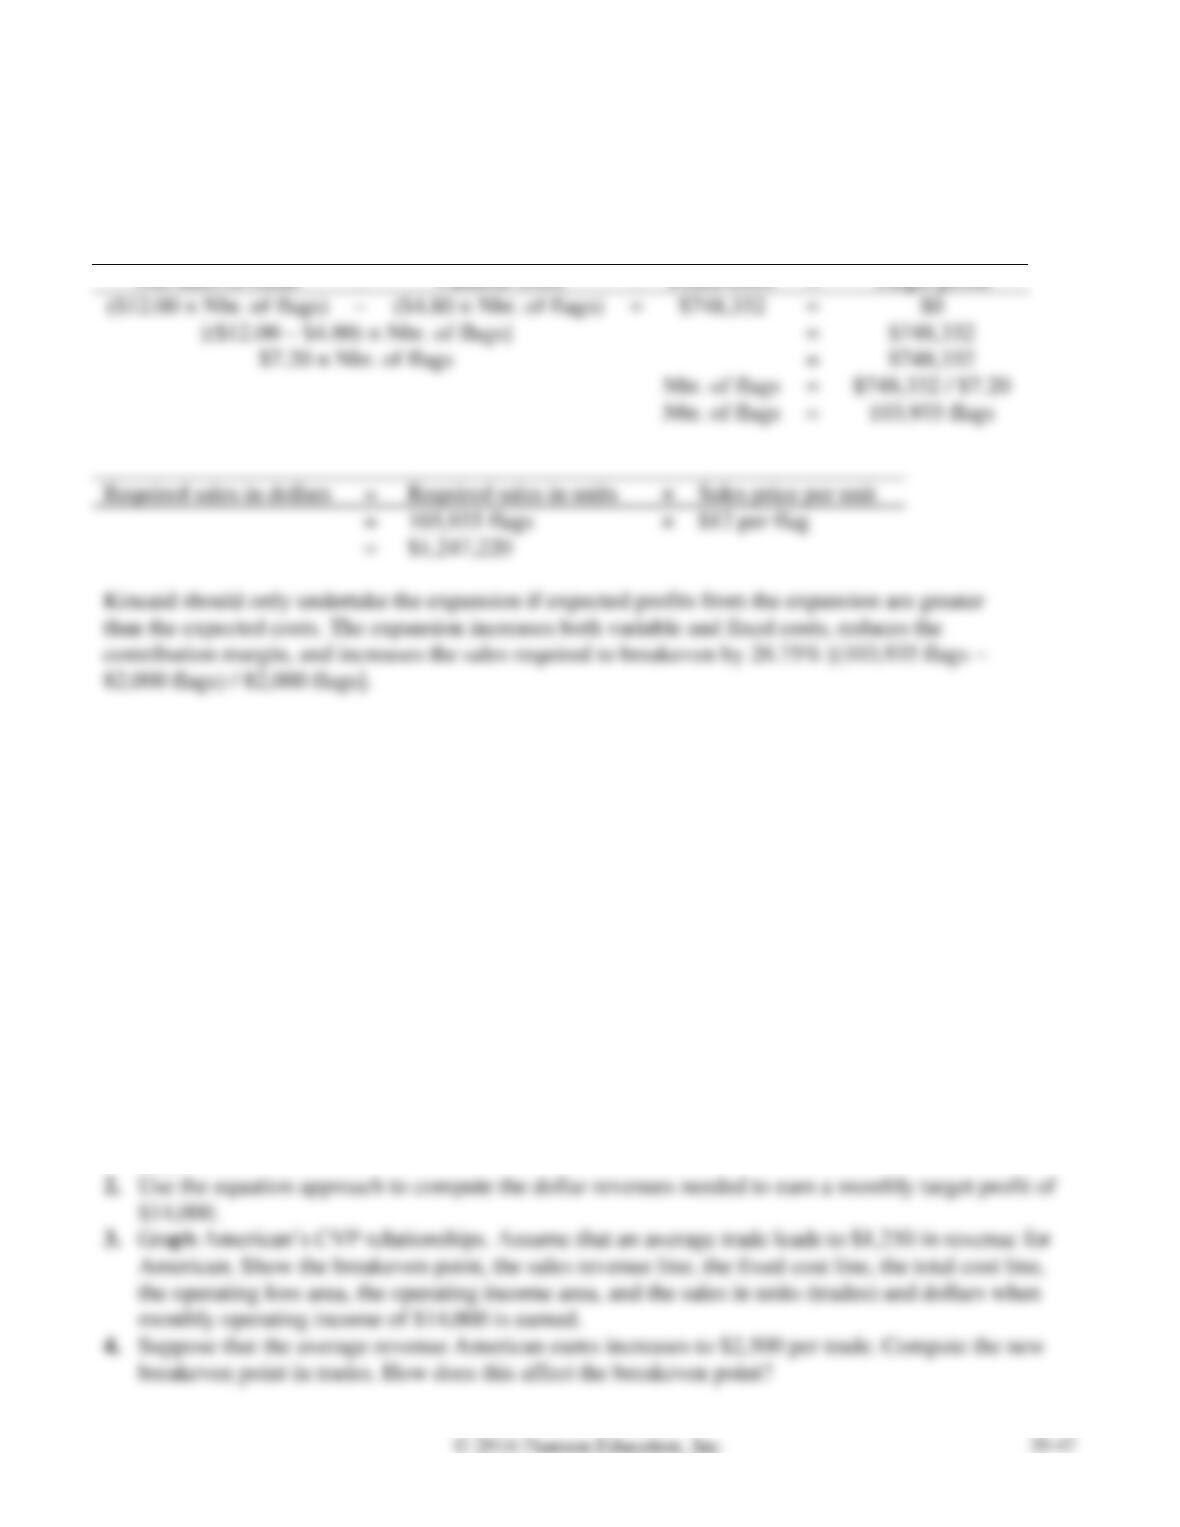
Required sales in dollars
=
Required sales in units
×
Sales price per unit
=
103,935 flags
×
$12 per flag
=
$1,247,220
82,000 flags) / 82,000 flags].
P20-36A Computing breakeven sales and sales needed to earn a target profit; graphing CVP
relationships; performing sensitivity analysis
Learning Objectives 2, 3, 4
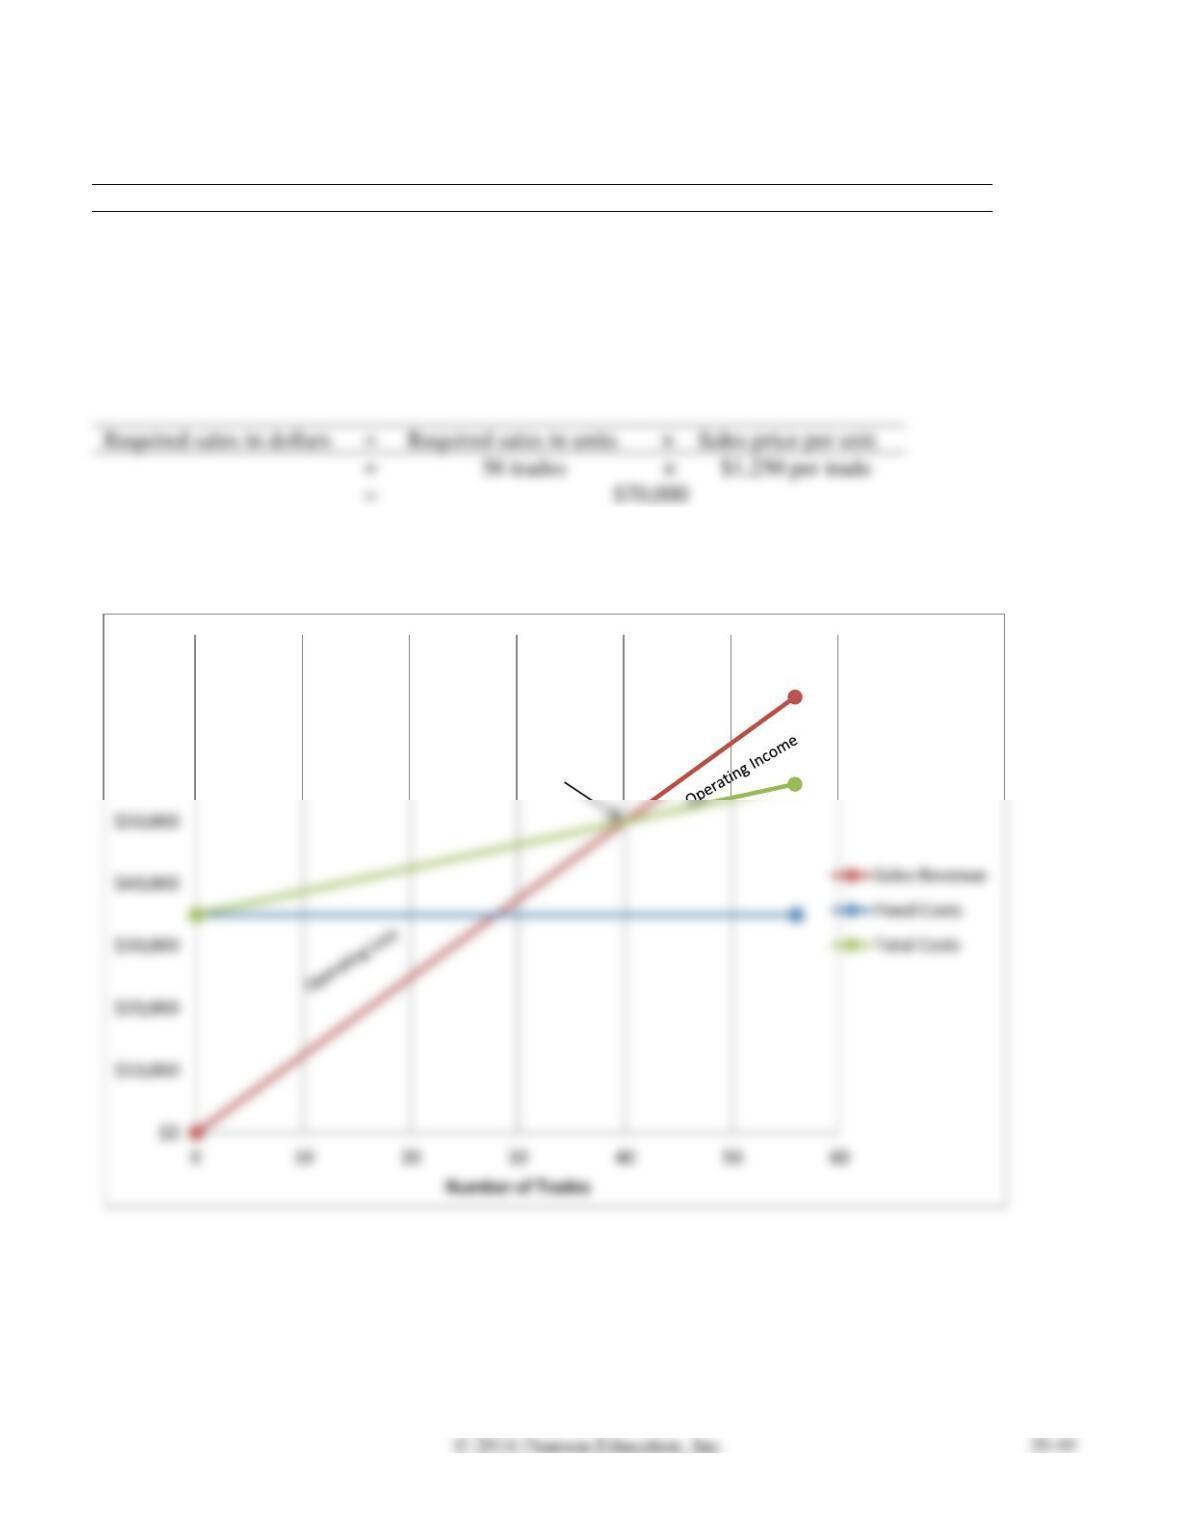
1. 40 trades
American Investor Group is opening an office in Portland, Oregon. Fixed monthly costs are office rent
($8,000), depreciation on office furniture ($1,800), utilities ($2,200), special telephone lines ($1,100), a
connection with an online brokerage service ($2,700), and the salary of a financial planner ($19,200).
Variable costs include payments to the financial planner (9% of revenue), advertising (11% of revenue),
supplies and postage (4% of revenue), and usage fees for the telephone lines and computerized
brokerage service (6% of revenue).
Requirements
1. Use the contribution margin ratio approach to compute American’s breakeven revenue in dollars. If
the average trade leads to $1,250 in revenue for American, how many trades must be made to break
even?
SOLUTION
Requirement 1
Variable Cost
Percent of Revenue
Financial planner
9%
Advertising
11%
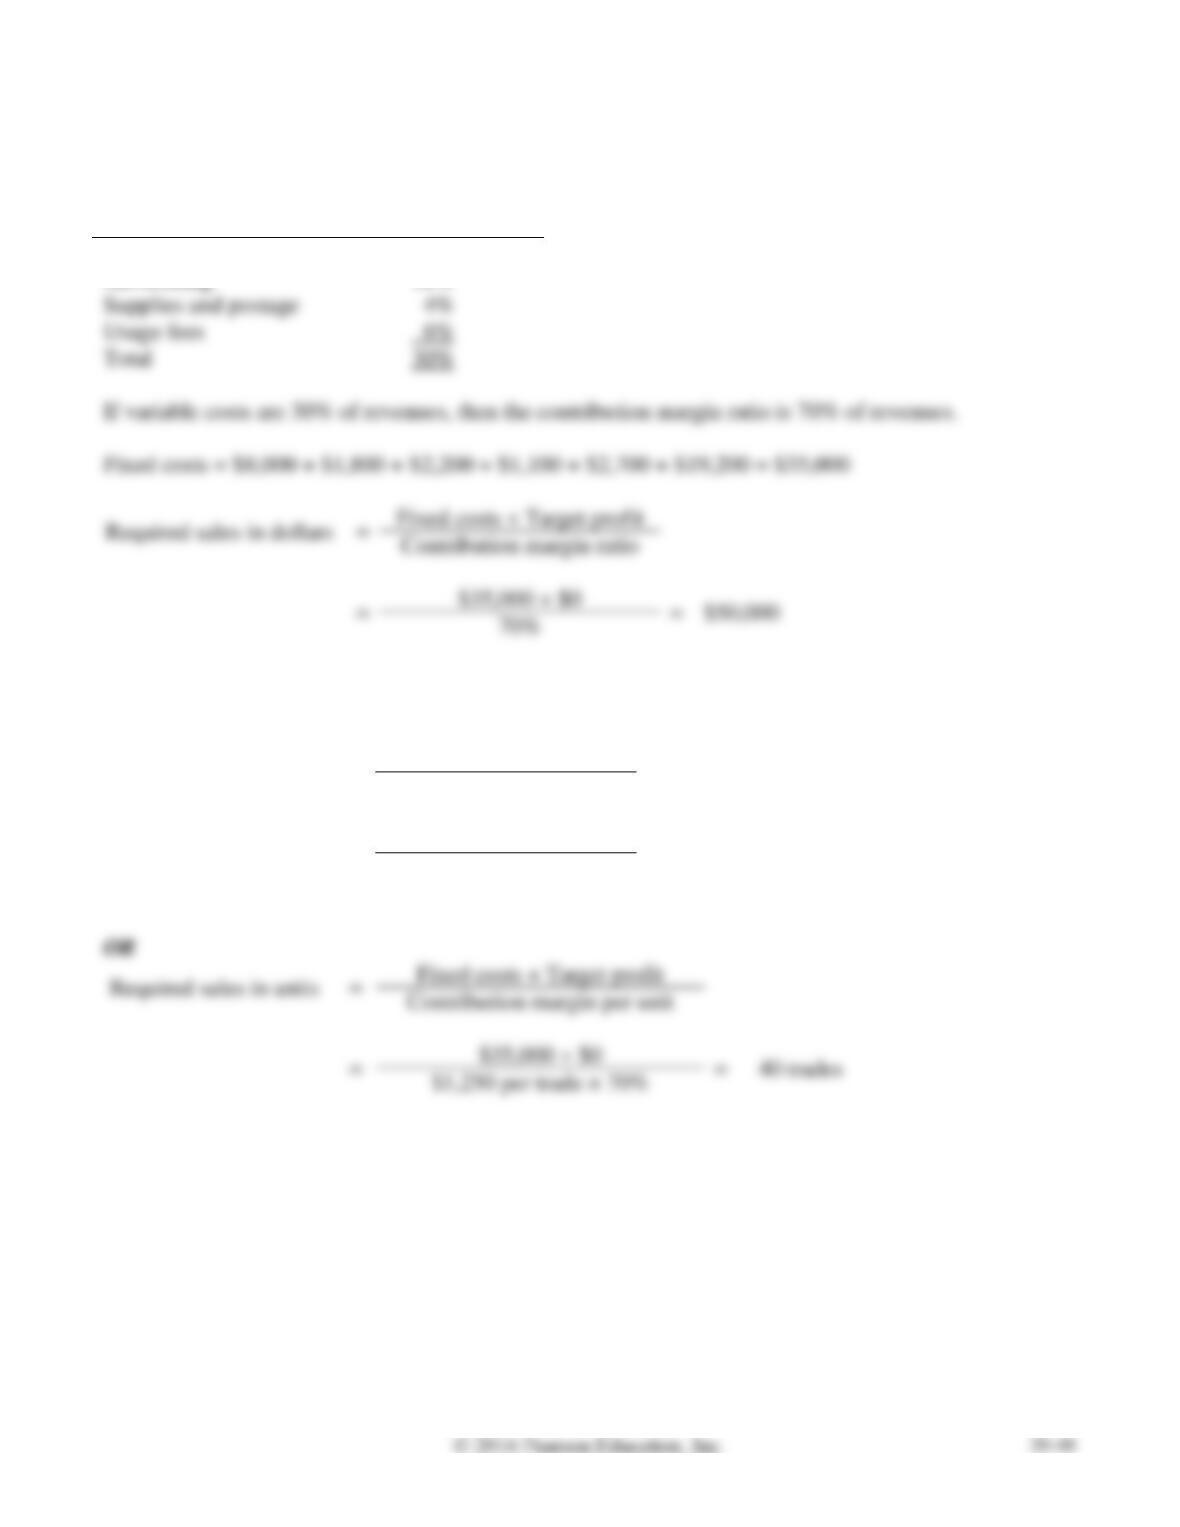
Supplies and postage
4%
Usage fees
6%
Total
30%
If variable costs are 30% of revenues, then the contribution margin ratio is 70% of revenues.
Fixed costs = $8,000 + $1,800 + $2,200 + $1,100 + $2,700 + $19,200 = $35,000
Fixed costs + Target profit
Requirement 1, cont.
Required sales in units
=
Required sales in dollars
Sales price per unit
=
$50,000
=
40 trades
$1,250 per trade
=
=
=
$1,250 per trade × 70%
P20-36A, cont.
Requirement 2
Net sales revenue
–
Variable costs
–
Fixed costs
=
Operating income
($1,250 × Nbr. of trades)
–
($1,250 × 30%
× Nbr. of trades)
–
$35,000
=
$14,000
[($1,250 – $375) × Nbr. of trades]
=
$49,000
$875 × Nbr. of trades
=
$49,000
Nbr. of trades
=
$49,000 / $875
Nbr. of trades
=
56 trades
Required sales in dollars
=
Required sales in units
×
Sales price per unit
=
56 trades
=
Requirement 3
$60,000
$70,000
$80,000
Breakeven
Point
P20-36A, cont.
Requirement 4
Required sales in units
=
Required sales in dollars
Sales price per unit
=
OR
Required sales in units
=
Fixed costs + Target profit
Contribution margin per unit
The increased revenue per average trade reduces the breakeven point by 50% [(40 trades – 20
trades) / 40 trades].
P20-37A Calculating breakeven point for two products, margin of safety, and operating leverage
Learning Objectives 2, 4, 5
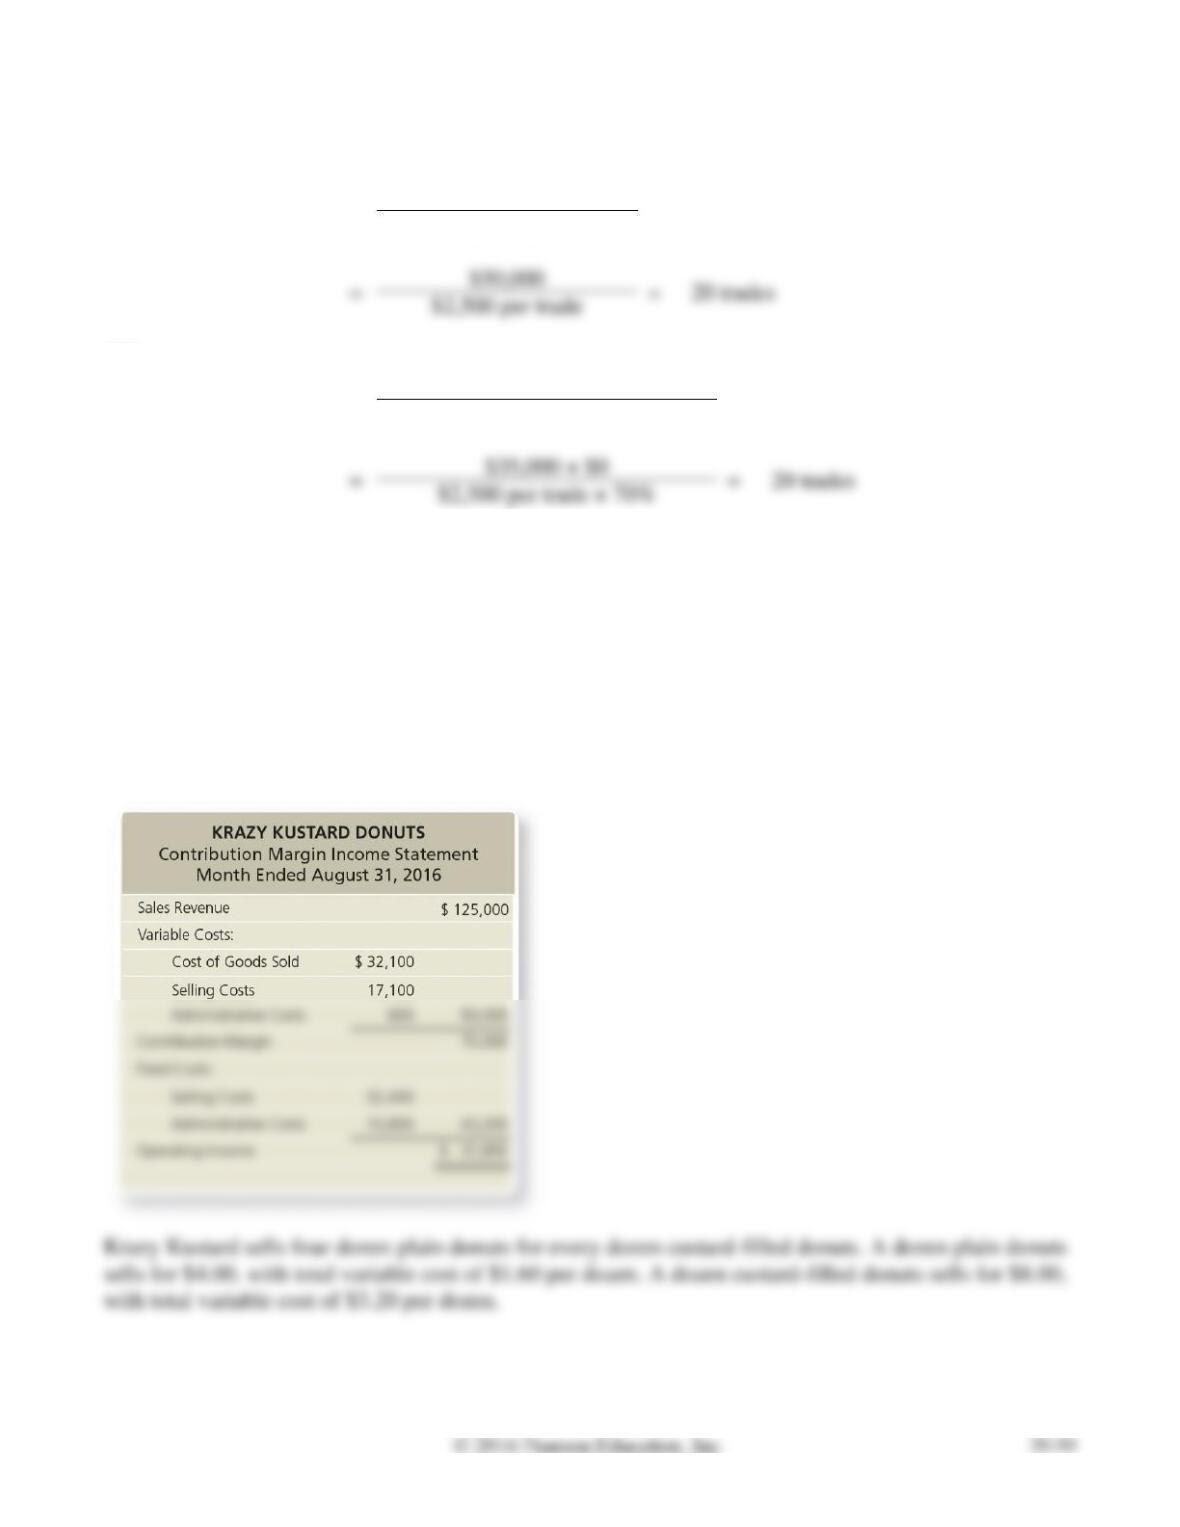
2. 12,000 dz. & 3,000 dz.
The contribution margin income statement of Krazy Kustard Donuts for August 2016 follows:
Requirements
1. Calculate the weighted-average contribution margin.
2. Determine Krazy Kustard’s monthly breakeven point in dozens of plain donuts and custard-filled
donuts. Prove your answer by preparing a summary contribution margin income statement at the
breakeven level of sales. Show only two categories of costs: variable and fixed.
3. Compute Krazy Kustard’s margin of safety in dollars for August 2016.
4. Compute the degree of operating leverage for Krazy Kustard Donuts. Estimate the new operating
income if total sales increase by 40%. (Round the degree of operating leverage to four decimal
places and the final answer to the nearest dollar. Assume the sales mix remains unchanged.)
5. Prove your answer to Requirement 4 by preparing a contribution margin income statement with a
40% increase in total sales. (The sales mix remains unchanged.)
SOLUTION
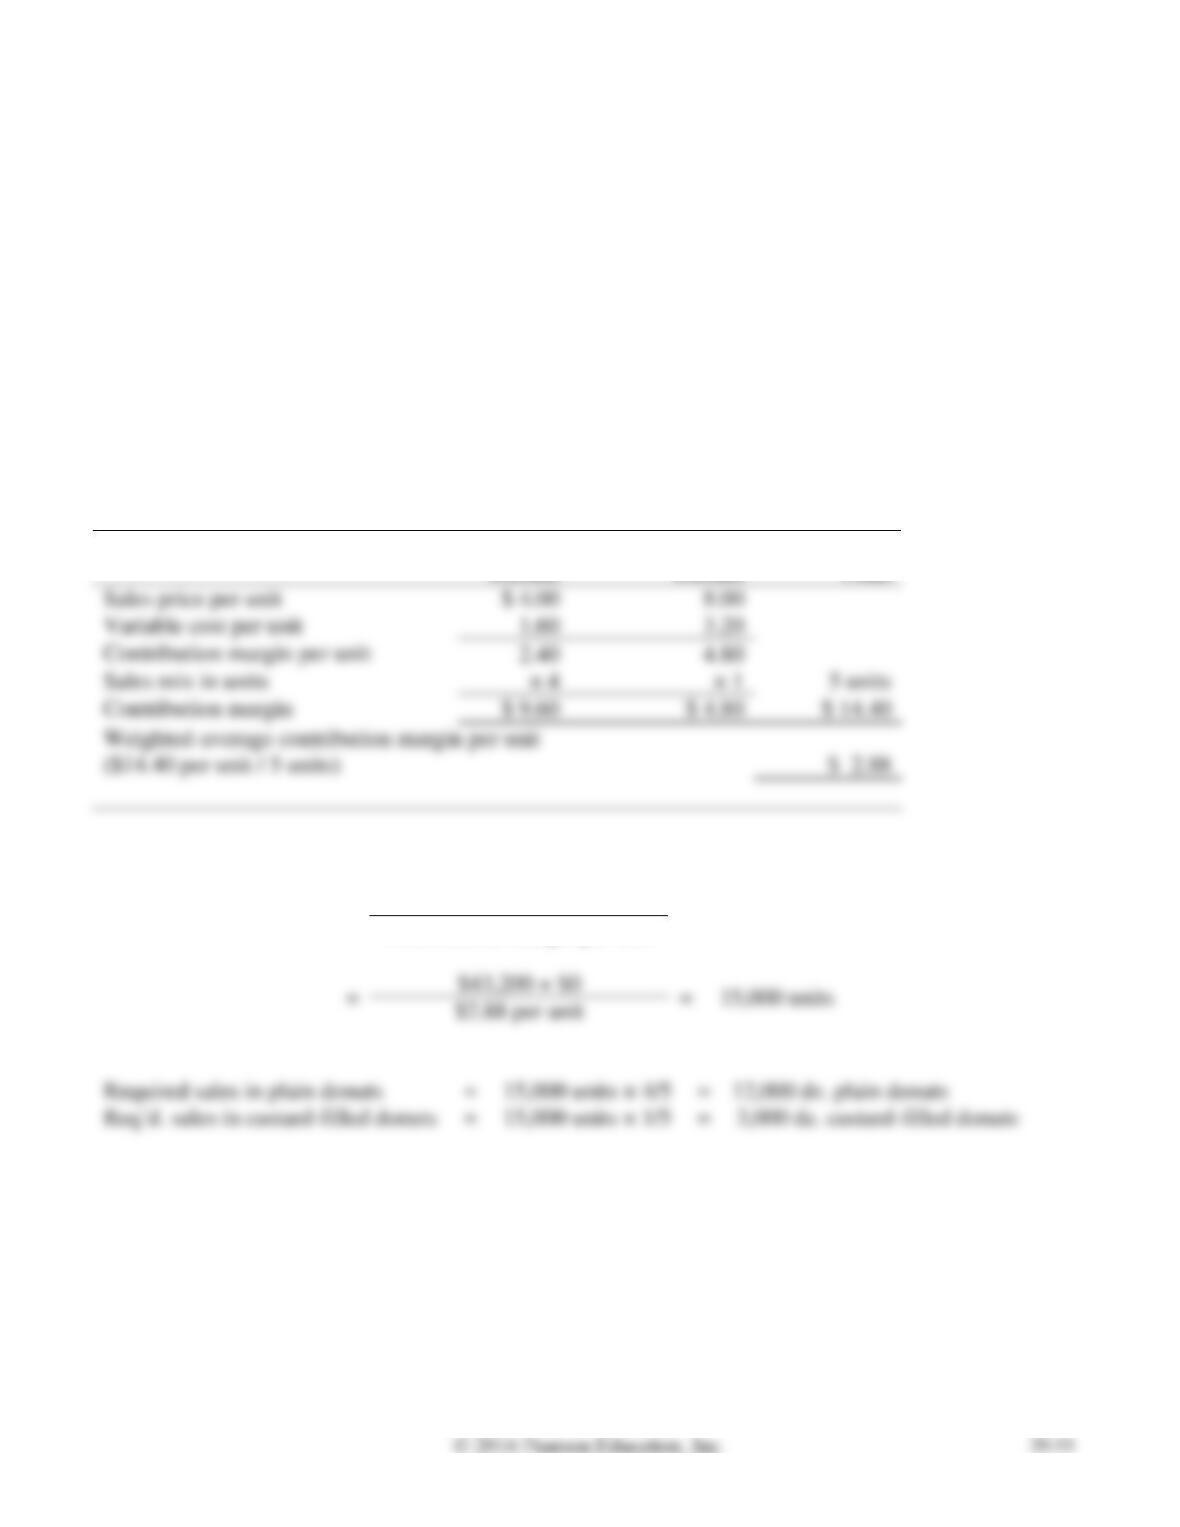
Requirement 1
Plain
Donuts
Custard-Filled
Donuts
Total
Variable cost per unit
Sales mix in units
Weighted-average contribution margin per unit
Requirement 2
Required sales in units
=
Fixed costs + Target profit
Contribution margin per unit
=
=
15,000 units
Required sales in plain donuts
=
15,000 units × 4/5
=
12,000 dz. plain donuts
P20-37A, cont.
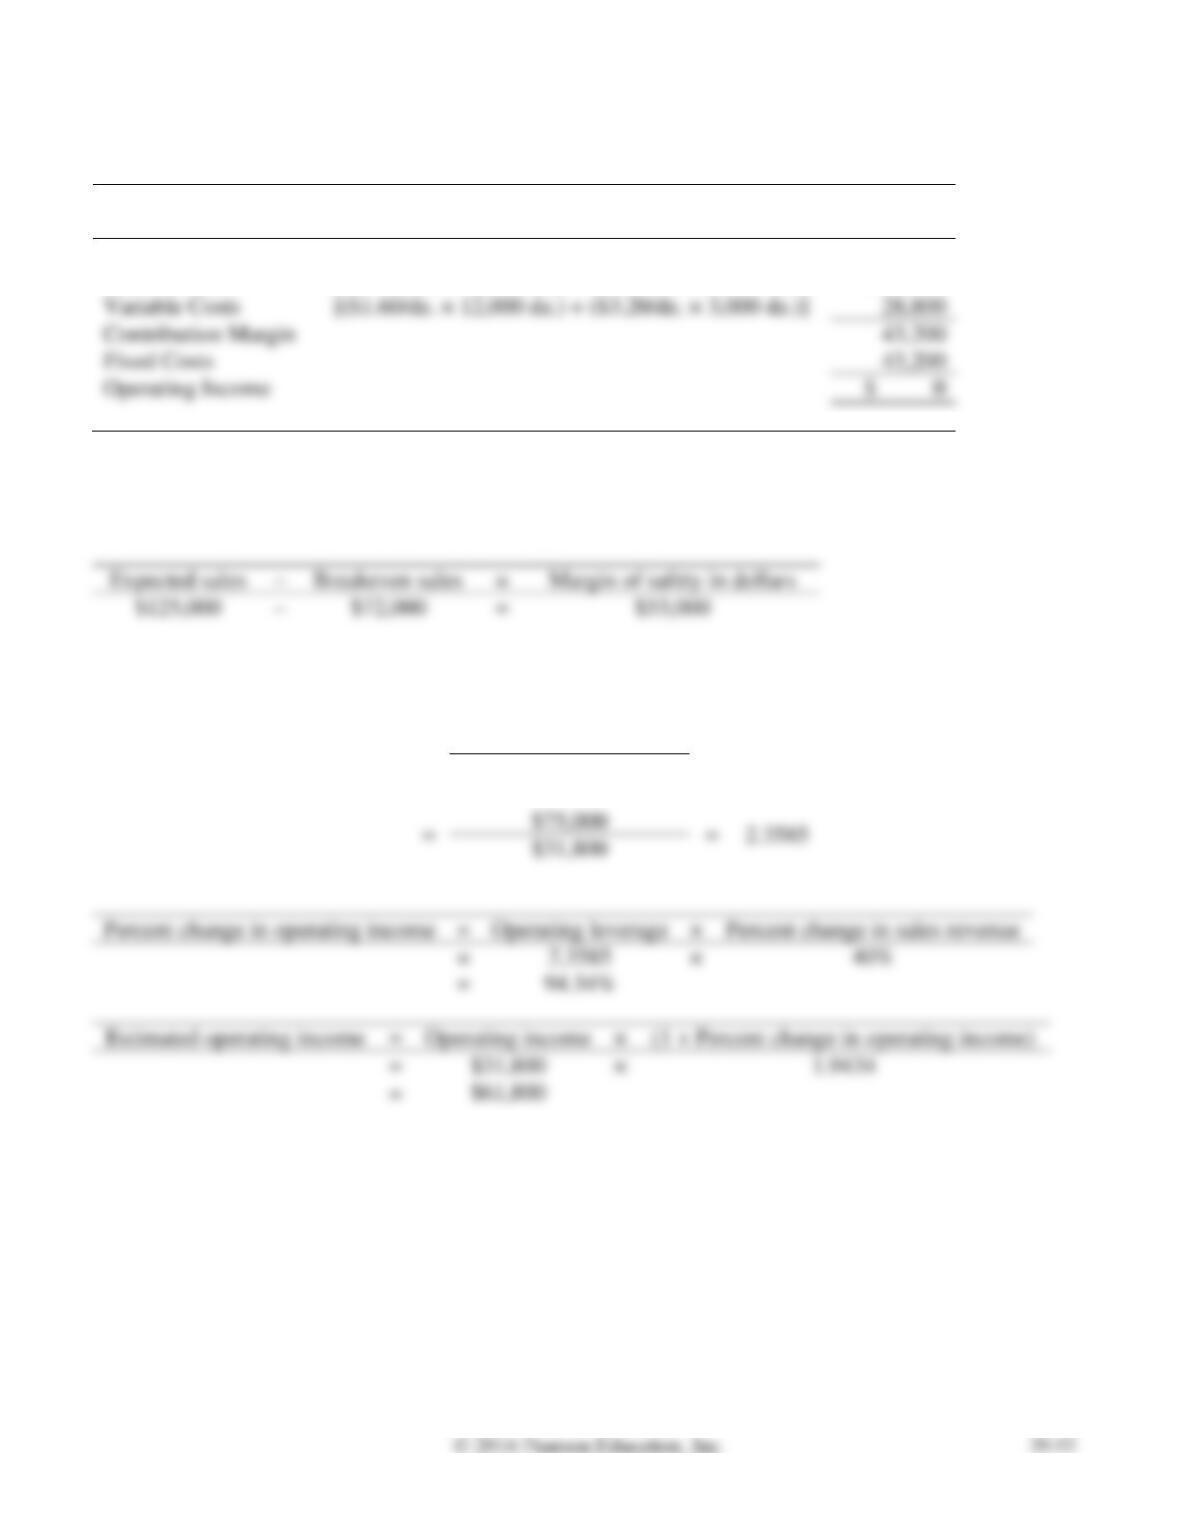
Requirement 2, cont.
KRAZY KUSTARD DONUTS
Contribution Margin Income Statement
Sales Revenue
[($4.00/dz. × 12,000 dz.) + ($8.00/dz. × 3,000 dz.)]
$ 72,000
Variable Costs
[($1.60/dz. × 12,000 dz.) + ($3.20/dz. × 3,000 dz.)]
Contribution Margin
Fixed Costs
Operating Income
$ 0
Requirement 3
Breakeven sales in dollars = $72,000 (from Requirement 2):
$125,000
Requirement 4
Degree of operating leverage
=
Contribution margin
Operating income
=
Percent change in operating income
=
Operating leverage
×
=
×
=
=
×
=
×
=
P20-37A, cont.
Requirement 5
KRAZY KUSTARD DONUTS
Contribution Margin Income Statement
For the Month Ended August 31, 2016
Problems (Group B)
P20-38B Calculating cost-volume-profit elements
Learning Objectives 1, 2
The budgets of four companies yield the following information:
Requirements
1. Fill in the blanks for each missing value. (Round the contribution margin to the nearest cent.)
2. Which company has the lowest breakeven point in sales dollars?
3. What causes the low breakeven point?
SOLUTION
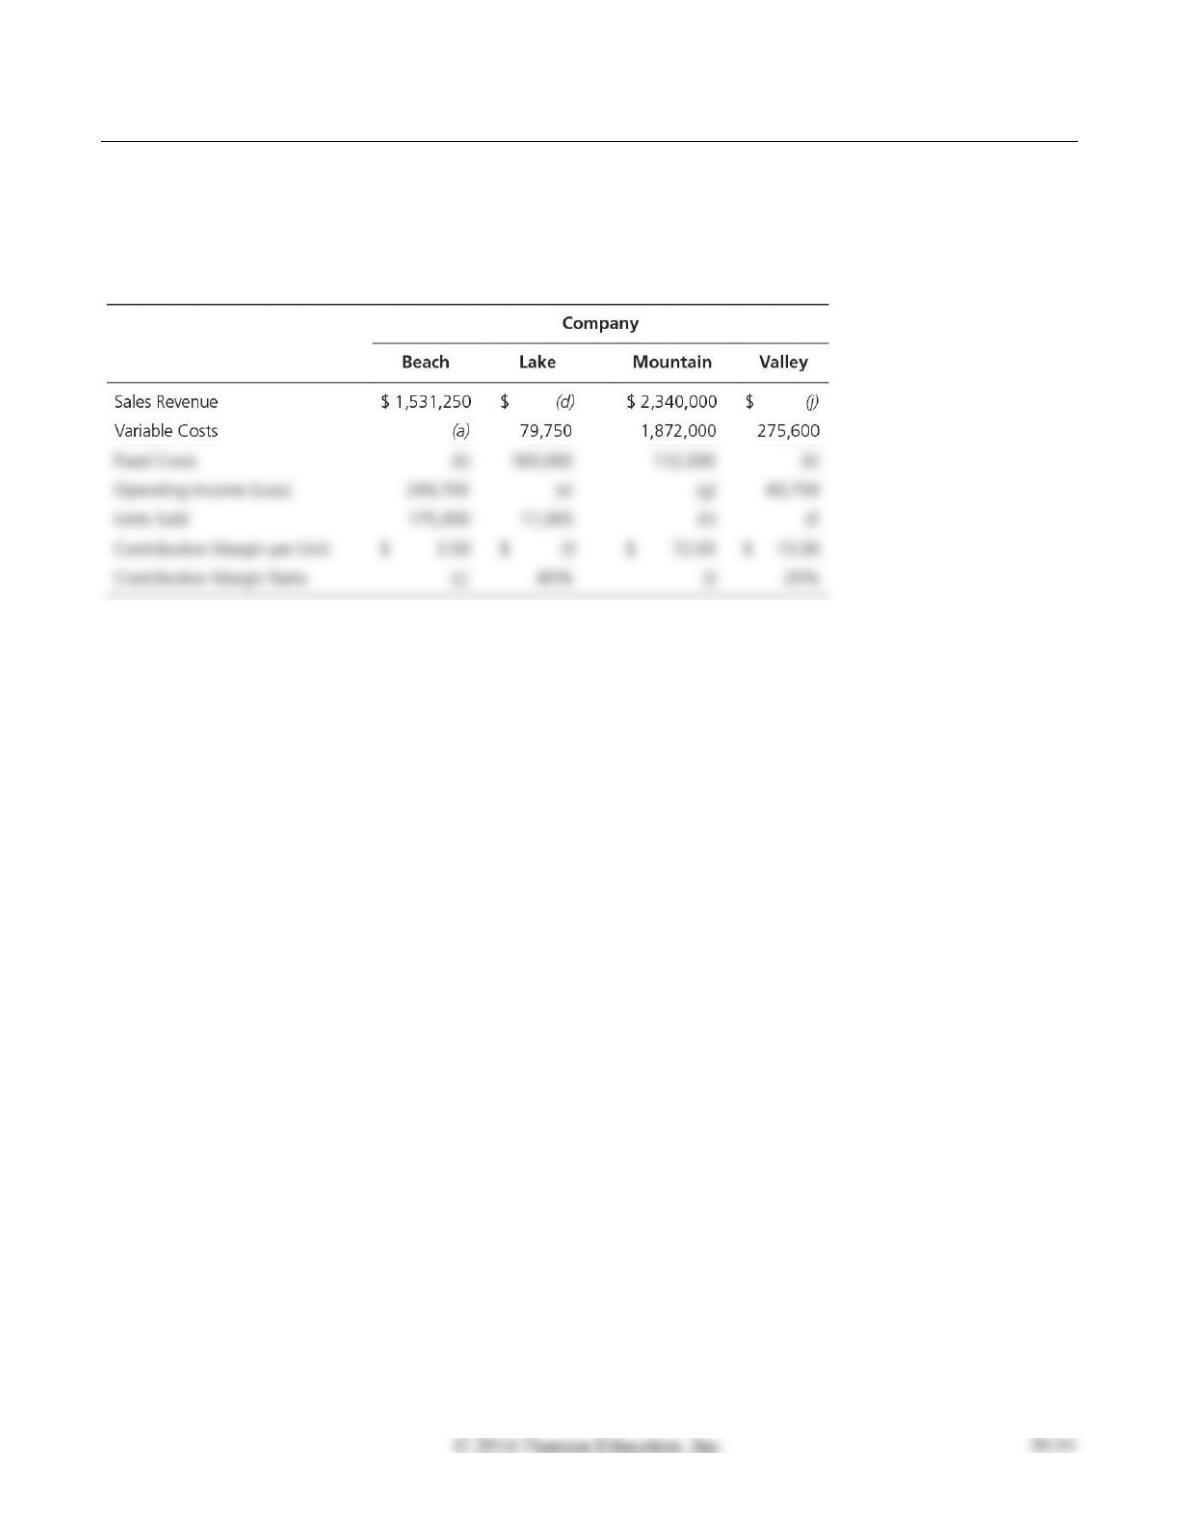
Requirement 1
Company
Beach
Lake
Mountain
Valley
Sales Revenue
$ 1,531,250
$(d) 398,750
$ 2,340,000
$(j) 344,500
Variable Costs
(a) 918,750
79,750
1,872,000
275,600
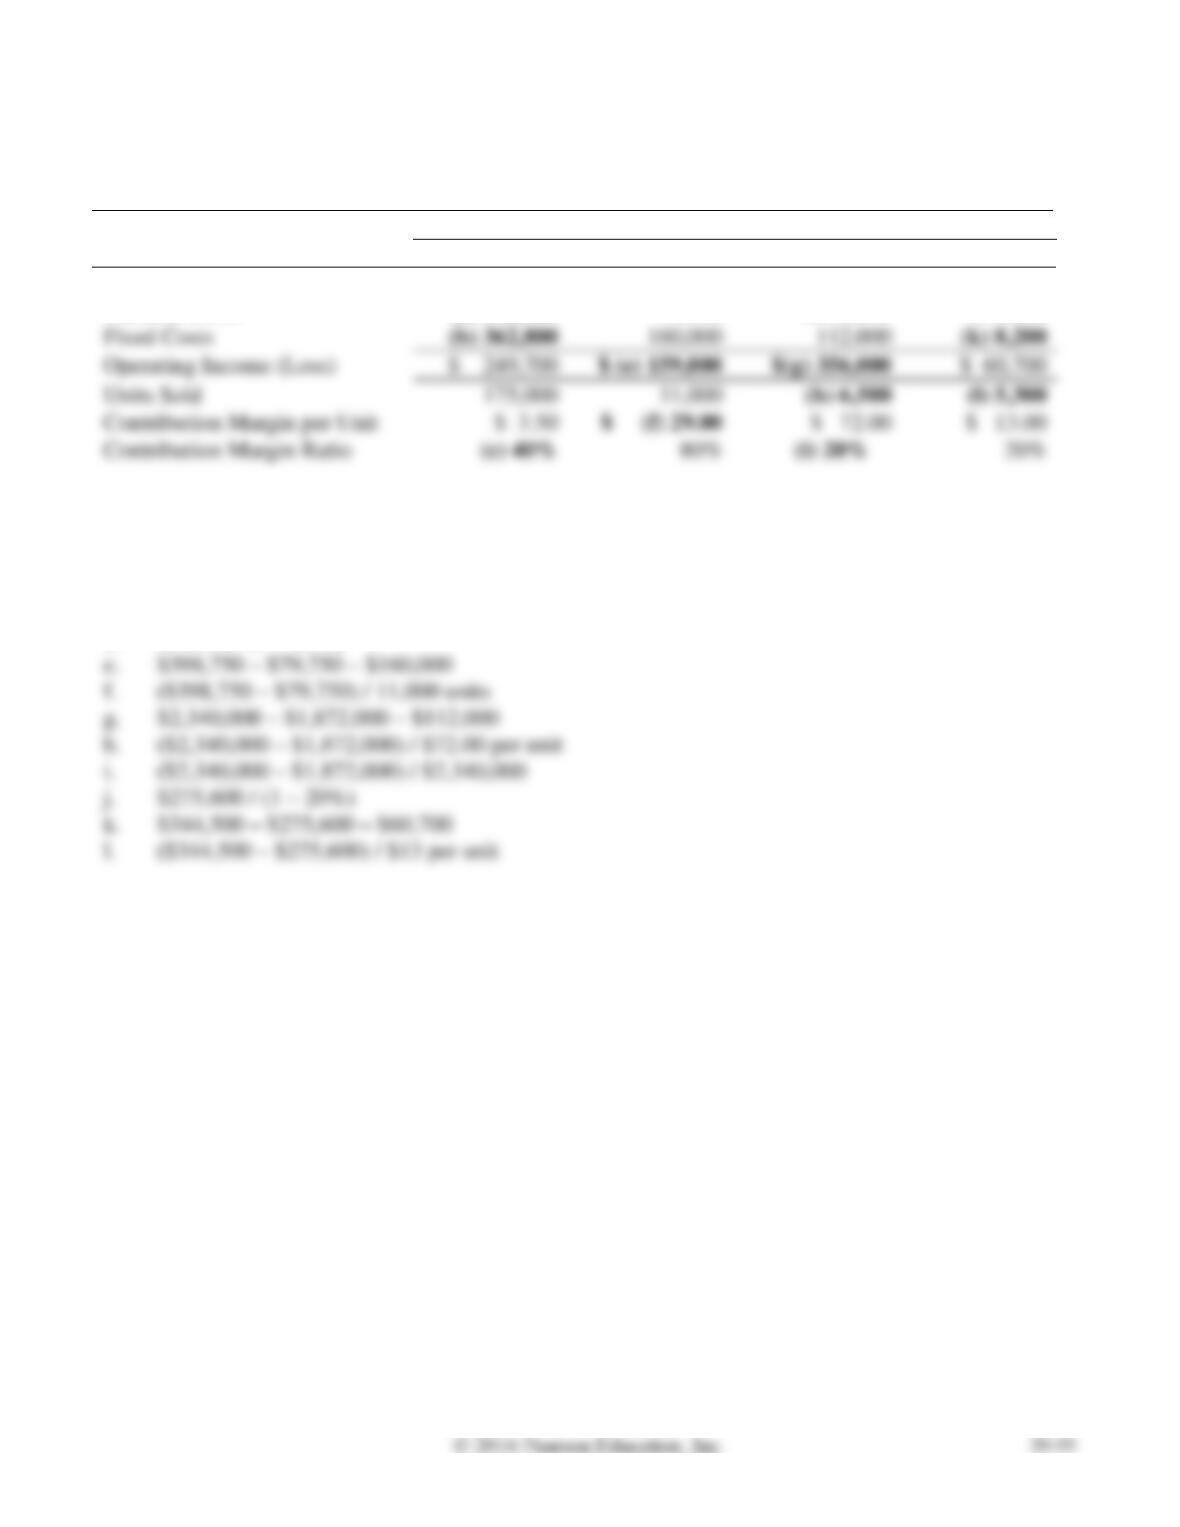
Fixed Costs
Operating Income (Loss)
Units Sold
Contribution Margin per Unit
Contribution Margin Ratio
Calculations:
a.
$1,531,250 – (175,000 units × $3.50 per unit)
b.
$1,531,250 – $918,750 – $249,700
c.
($1,531,250 – $918,750) / $1,531,250
d.
$79,750 / (1 – 80%)
e.
$398,750 – $79,750 – $160,000
f.
($398,750 – $79,750) / 11,000 units
g.
$2,340,000 – $1,872,000 – $112,000
h.
($2,340,000 – $1,872,000) / $72.00 per unit
($2,340,000 – $1,872,000) / $2,340,000
k.
$344,500 – $275,600 – $60,700
($344,500 – $275,600) / $13 per unit
P20-38B, cont.
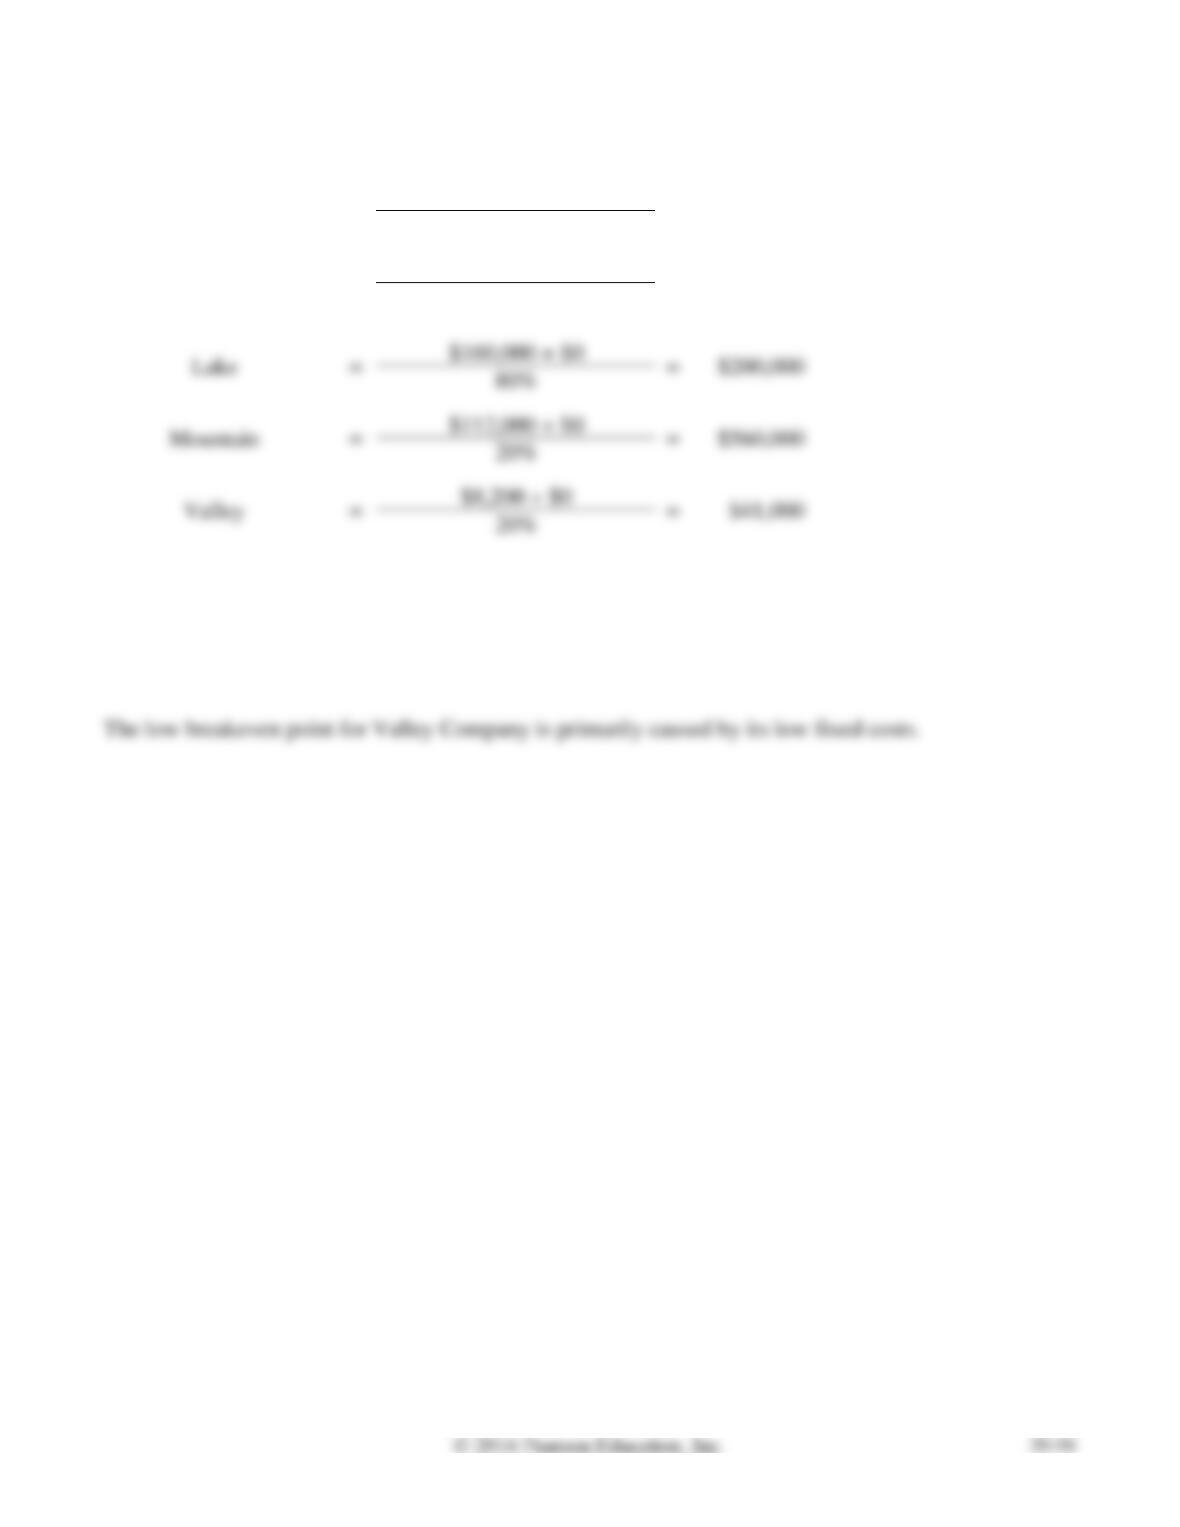
Requirement 2
Required sales in
dollars
=
Fixed costs + Target profit
Contribution margin ratio
Beach
=
$362,800 + $0
=
$907,000
40%
=
$160,000 + $0
=
$112,000 + $0
The breakeven point in sales dollars for Valley Company is $41,000. This is the lowest
breakeven point in sales dollars.
Requirement 3
The low breakeven point for Valley Company is primarily caused by its low fixed costs.
P20-39B Calculating breakeven sales and sales to earn a target profit; preparing a contribution
margin income statement
Learning Objectives 1, 2, 3
3. CMR 55.13%
City Productions performs London shows. The average show sells 900 tickets at $65 per ticket. There
are 140 shows a year. No additional shows can be held as the theater is also used by other production
companies. The average show has a cast of 55, each earning a net average of $330 per show. The cast is
paid after each show. The other variable cost is a program-printing cost of $9 per guest. Annual fixed
costs total $580,500.
Requirements
1. Compute revenue and variable costs for each show.
2. Use the equation approach to compute the number of shows City Productions must perform each
year to break even.
3. Use the contribution margin ratio approach to compute the number of shows needed each year to
earn a profit of $4,128,000. Is this profit goal realistic? Give your reasoning.
4. Prepare City Productions’s contribution margin income statement for 140 shows performed in 2016.
Report only two categories of costs: variable and fixed.
SOLUTION
Requirement 1
Sales revenue per show = 900 tickets × $65 per ticket = $58,500
Variable cost per show
=
+
=
(55 performers × $330 per performer)
=
=
Requirement 2
Net sales revenue
–
Variable costs
–
Fixed costs
=
Operating income
–
–
=
=
=
=
$580,500 / $32,250
=
Requirement 3
Contribution margin ratio
=
Contribution margin
/
Net sales revenue
=
(Net sales revenue –Variable costs)
/
Net sales revenue
$58,500 – $26,250
/
$58,500
=
$32,250
/
$58,500
=
55.13%
Fixed costs + Target profit
Required sales in dollars
$4,128,000 is an unrealistic profit goal.
P20-39B, cont.
Requirement 4
CITY PRODUCTIONS
Contribution Margin Income Statement
For the year ending December 31, 2016
P20-40B Analyzing CVP relationships
Learning Objectives 2, 3, 4
3. Op. Inc. $(72,000)
Allen Company sells flags with team logos. Allen has fixed costs of $583,200 per year plus variable
costs of $4.80 per flag. Each flag sells for $12.00.
Requirements
1. Use the equation approach to compute the number of flags Allen must sell each year to break even.
SOLUTION
Requirement 1
Net sales revenue
–
Variable costs
–
Fixed costs
=
Target profit
($12.00 × Nbr. of flags)
–
–
=
$0
=
$583,200
=
$583,200
Nbr. of flags
=
Nbr. of flags
=
81,000 flags
Requirement 2
Contribution margin ratio
=
Contribution margin
/
Net sales revenue
=
($12.00 – $4.80)
/
$12.00
=
$7.20
/
$12.00
=
60%
Fixed costs + Target profit
Requirement 3
ALLEN COMPANY
Contribution Margin Income Statement
For Year Ended December 31, 2016
Variable Costs
Fixed Costs
OR
This level of sales is 10,000 flags below the breakeven point (81,000 flags – 71,000 flags).
P20-40B, cont.
Requirement 4
Revised variable cost
=
$4.80 per flag + $0.60 per flag = $5.40 per flag
Revised fixed cost
=
$583,200 × 1.21 = $705,672
=
=
=
=
=
=
Required sales in dollars
=
×
=
=
81,000 flags) / 81,000 flags].
P20-41B Computing breakeven sales and sales needed to earn a target profit; graphing CVP
relationships; performing sensitivity analysis
Learning Objectives 2, 3, 4
4. 25 trades
Big Time Investor Group is opening an office in Boise. Fixed monthly costs are office rent ($8,900),
Requirements
1. Use the contribution margin ratio approach to compute Big Time’s breakeven revenue in dollars. If
the average trade leads to $1,000 in revenue for Big Time, how many trades must be made to break
even?
2. Use the equation approach to compute the dollar revenues needed to earn a monthly target profit of
$12,600.
3. Graph Big Time’s CVP relationships. Assume that an average trade leads to $1,000 in revenue for
Big Time. Show the breakeven point, the sales revenue line, the fixed cost line, the total cost line,
the operating loss area, the operating income area, and the sales in units (trades) and dollars when
monthly operating income of $12,600 is earned.
4. Suppose that the average revenue Big Time earns increases to $2,000 per trade. Compute the new
breakeven point in trades. How does this affect the breakeven point?