Index and Classification Properties of Soils Chapter 2
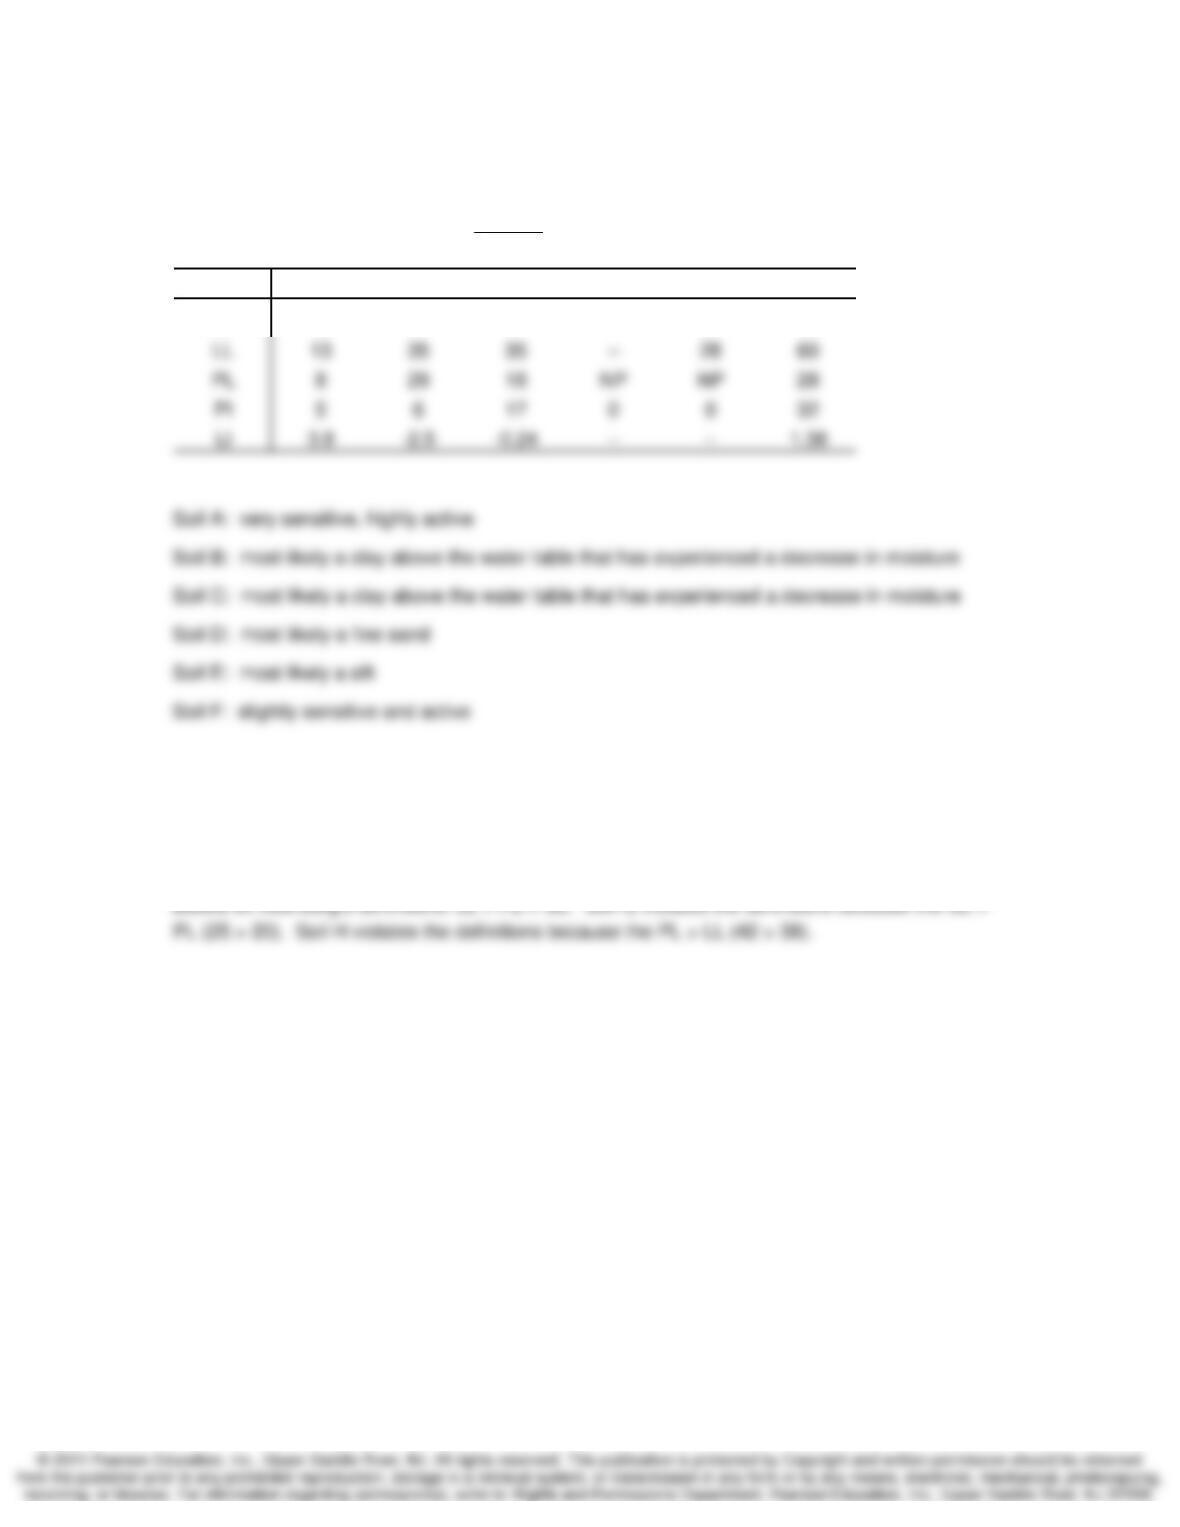
2.58. The soils in Problem 2.56 have the following Atterberg limits and natural water contents.
Determine the PI and LI for each soil and comment on their general activity.
SOLUTION: n
wPL
PI LL PL; LI PI
−
=− =
Property Soil A Soil B Soil C Soil D Soil E Soil F
w
n
(%) 27 14 14 11 8 72
2.59. Comment on the validity of the results of Atterberg limits on soils G and H.
SOLUTION:
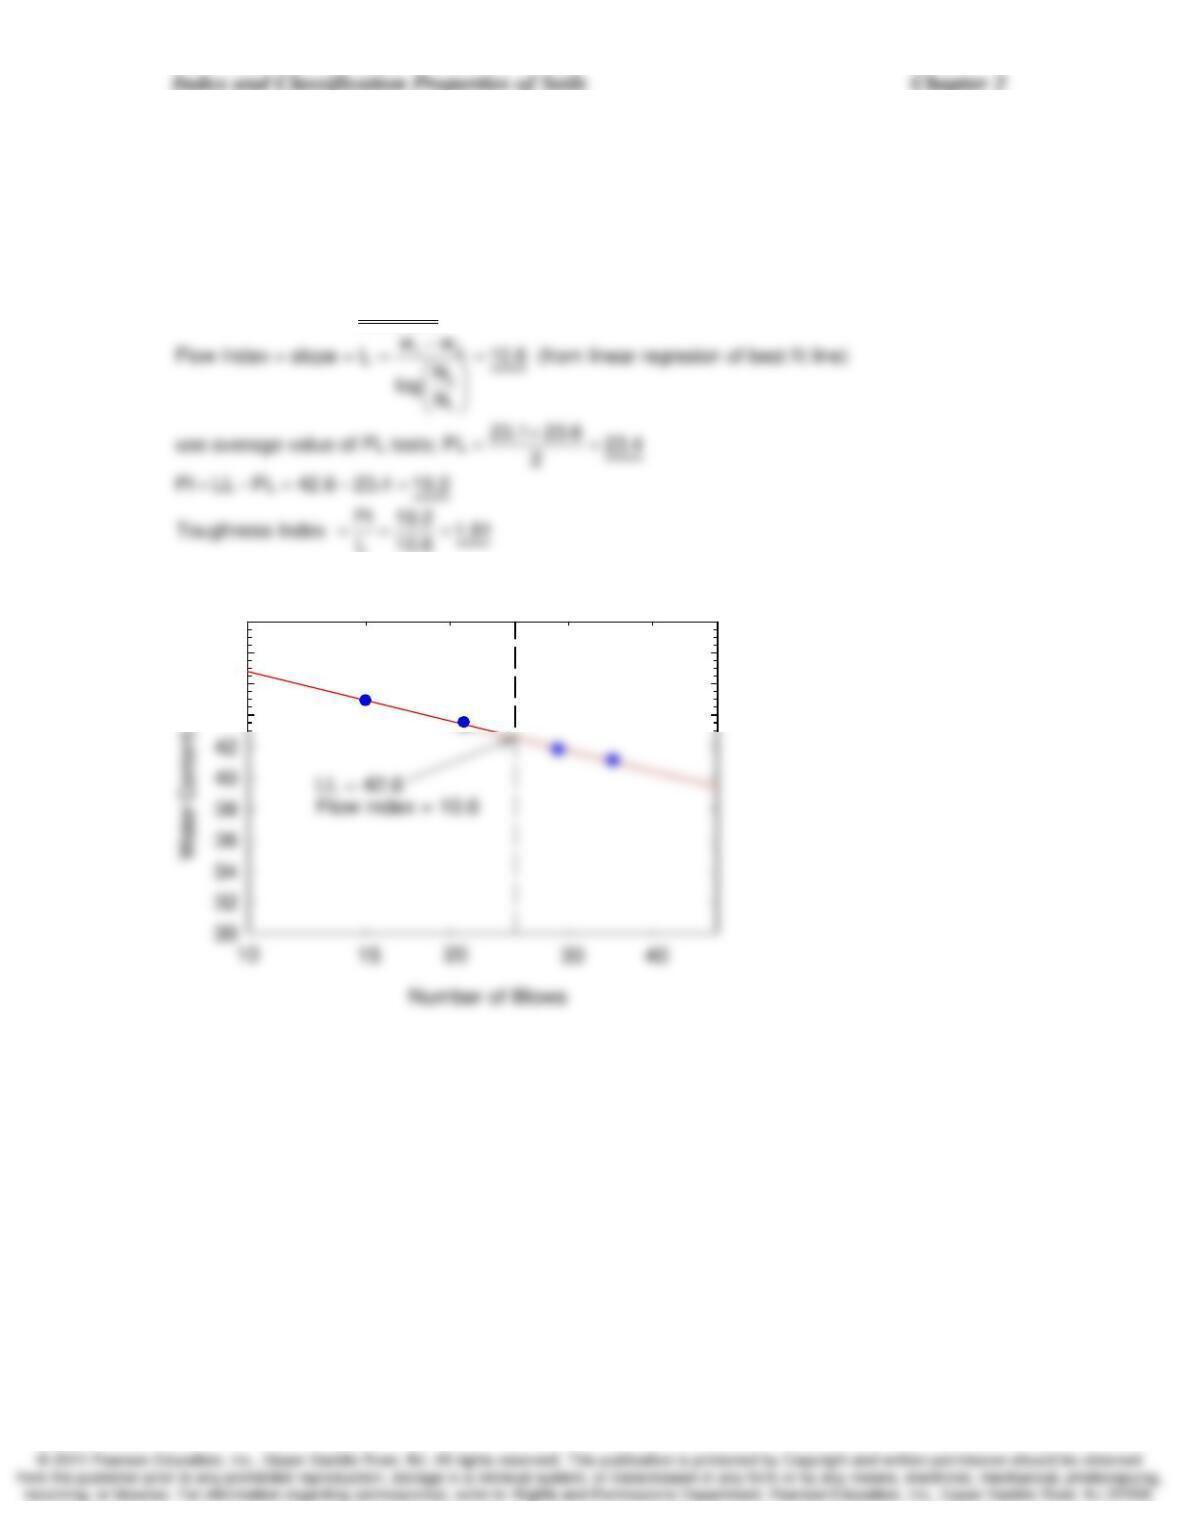
2.60. The following data were obtained from a liquid-limit test on a silty clay. Two plastic-limit
determinations had water contents of 23.1% and 23.6%. Determine the LL, PI, the flow index, and
the toughness index. The flow index is the slope of the water content versus log of number of
blows in the liquid-limit test, and the toughness index is the PI divided by the flow index.
SOLUTION:
From the plot below, LL = 42.6
F
44
46
48
50
Index and Classification Properties of Soils Chapter 2
2.61. Classify the following soils according to the USCS:
(a) A sample of well-graded gravel with sand has 73% fine to coarse subangular gravel, 25% fine
to coarse subangular sand, and 2% fines. The maximum size of the particles is 75 mm. The
coefficient of curvature is 2.7, while the uniformity coefficient is 12.4.
(b) A dark brown, wet, organic-odor soil has 100% passing the No. 200 sieve. The liquid limit is
32% (not dried, and is 21% when oven dried!) and the plastic index is 21% (not dried).
(c) This sand has 61% predominately fine sand, 23% silty fines, and 16% fine subrounded gravel
size. The maximum size is 20 mm. The liquid limit is 33% and the plastic limit is 27%.
(d) This material has 74% fine to coarse subangular reddish sand and 26% organic and silty dark
brown fines. The liquid limit (not dried) is 37% while it is 26% when oven dried. The plastic index
(not dried) is 6.
(e) Although this soil has only 6% nonplastic silty fines, it has everything else! It has gravel
content of 78% fine to coarse subrounded to subangular gravel, and 16% fine to coarse
subrounded to subangular sand. The maximum size of the subrounded boulders is 500 mm. The
uniformity coefficient is 40, while the coefficient of curvature is only 0.8. (After U.S. Dept. of the
Interior, 1990.)
SOLUTION: Refer to Table 2.7 and corresponding footnotes
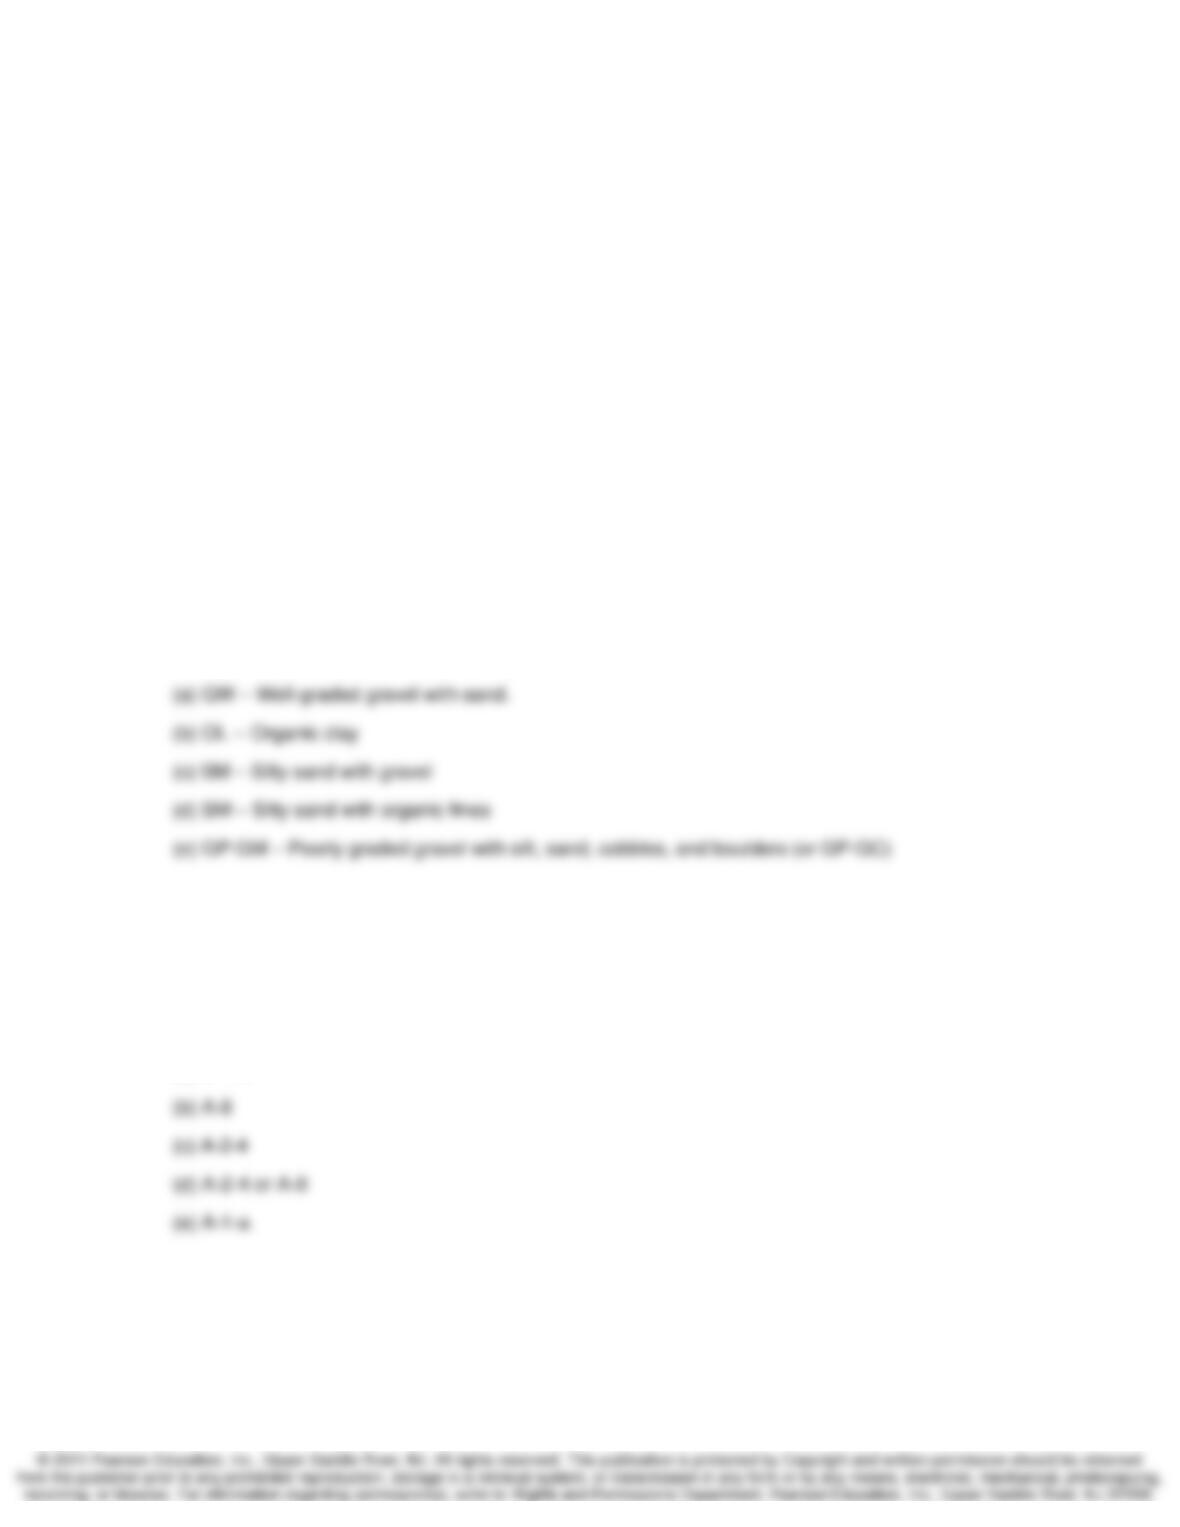
2.62. Classify the five soils in the preceding question according to the AASHTO method of soil
classification.
SOLUTION:
(a) A-1-a
Index and Classification Properties of Soils Chapter 2
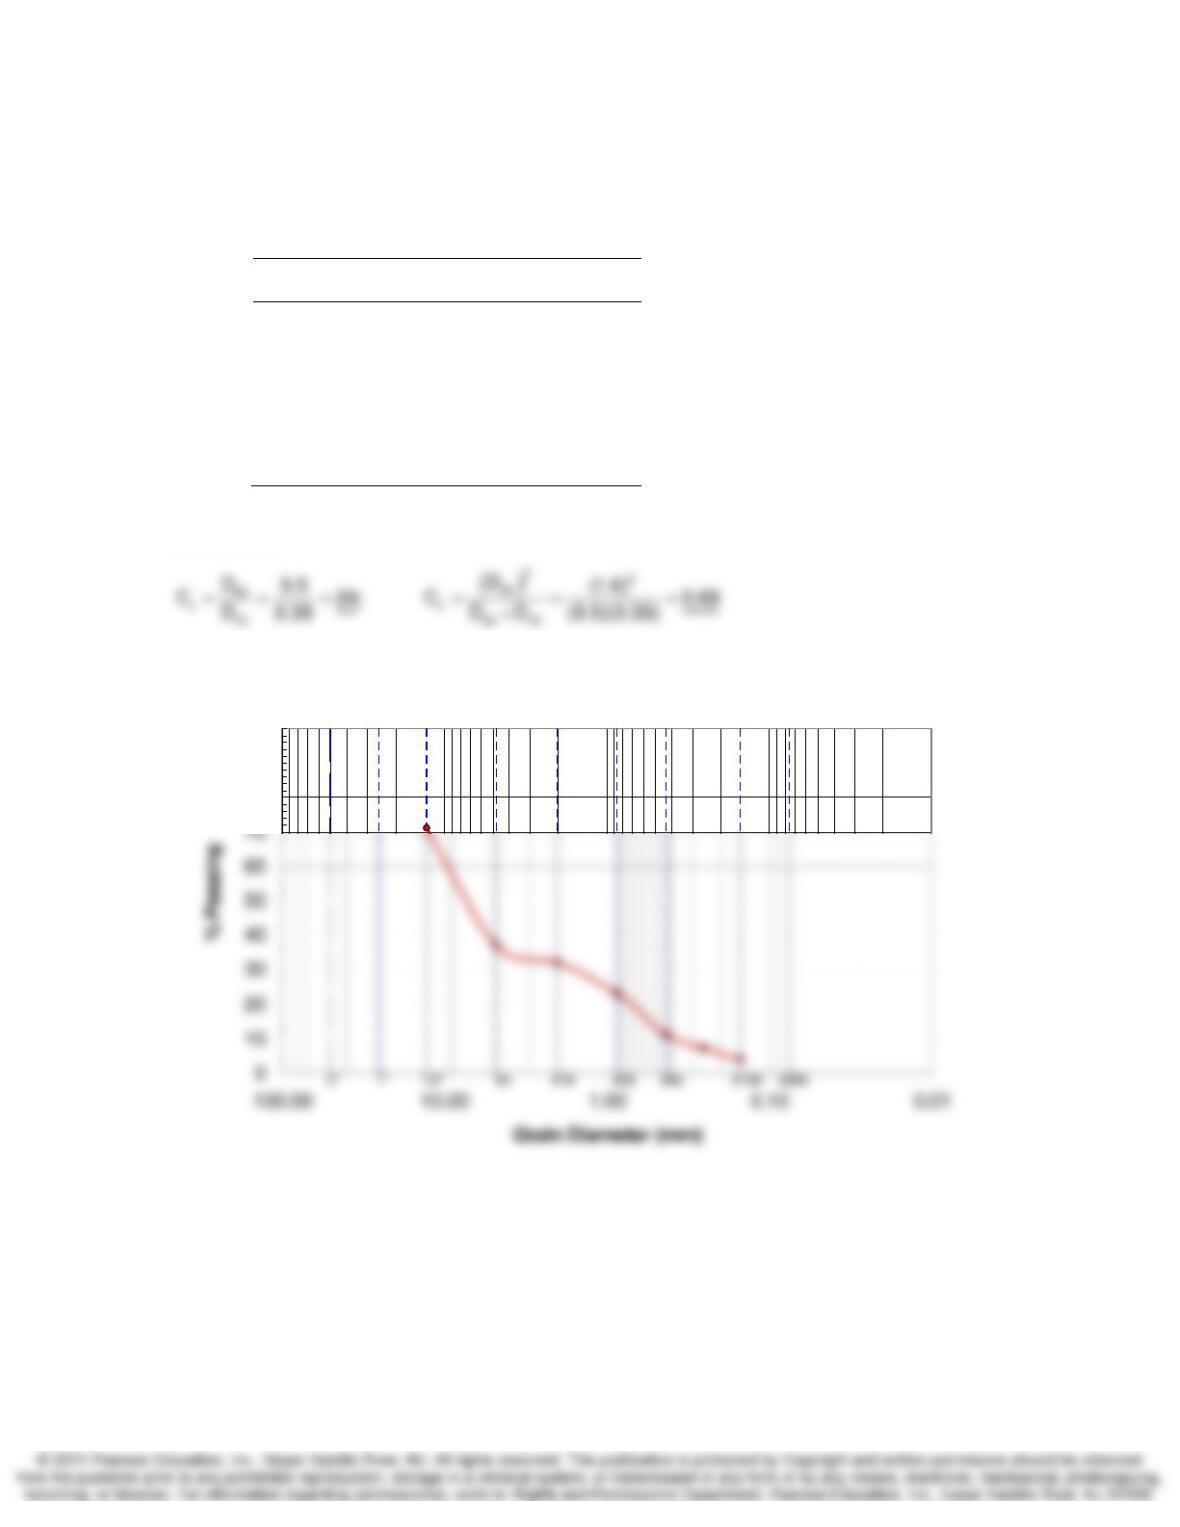
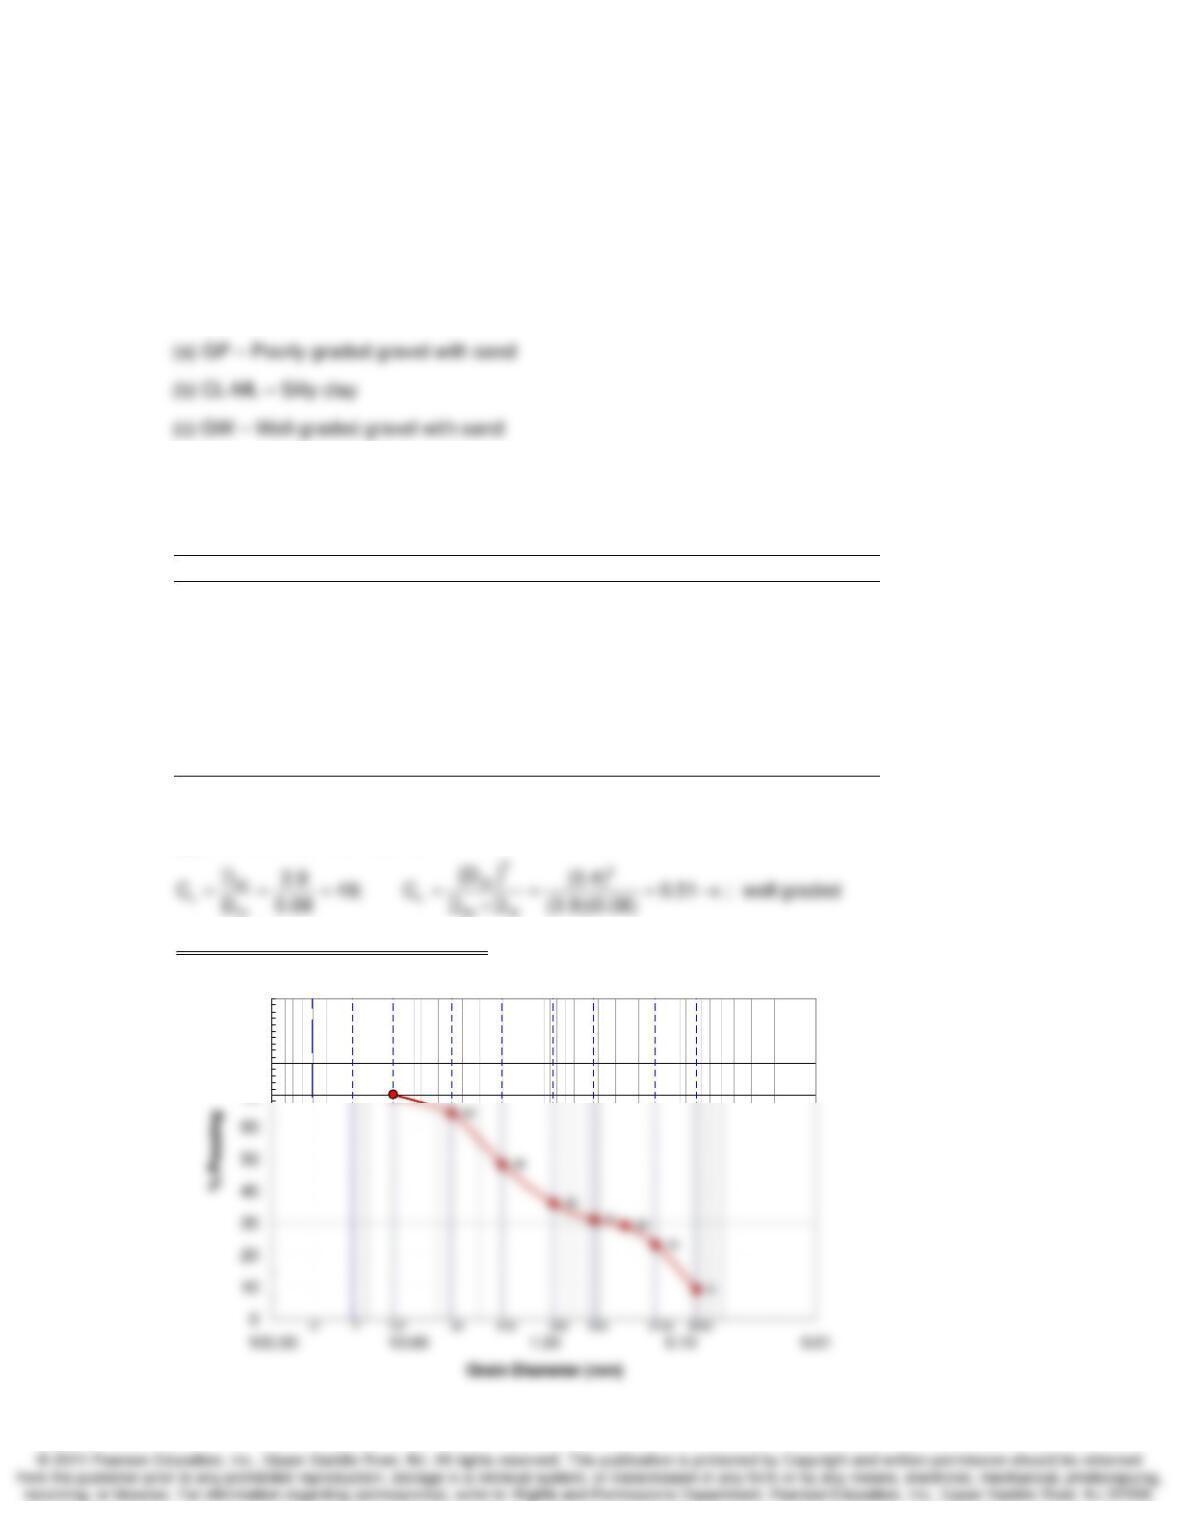
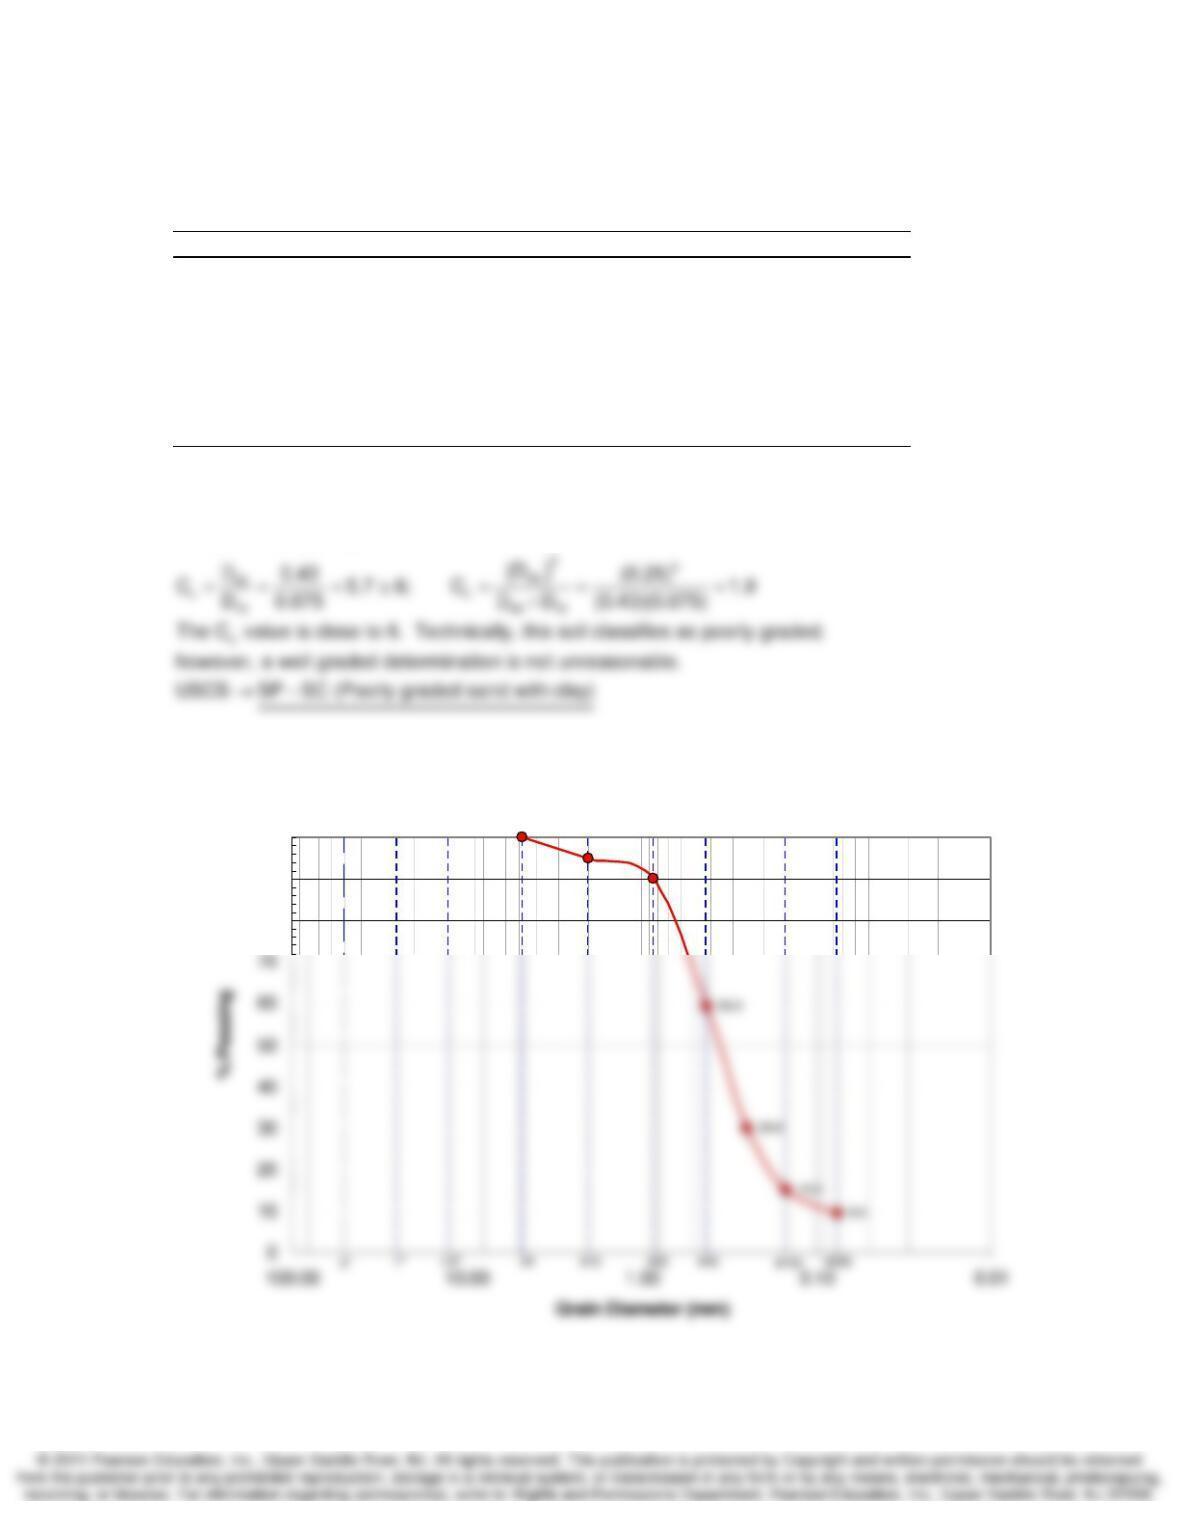
2.63. The results of a sieve test below give the percentage passing through the sieve.
(a) Using a spreadsheet, plot the particle-size distribution.
(b) Calculate the uniformity coefficient.
(c) Calculate the coefficient of curvature.
Sieve Percent Finer by Weight
½” 71
No. 4 37
No. 10 32
No. 20 23
No. 40 11
No. 60 7
No. 100 4
SOLUTION:
Grain Size Distribution Plot
2″
1″ 1/2″
#4 #10
#20
#40
#100
#200
80
90
100
Index and Classification Properties of Soils Chapter 2
2.64. For the data given below, classify the soils according to the USCS. For each soil, give both
the letter symbol and the narrative description.
(a) 65% material retained on No. 4 sieve, 32% retained on No. 200 sieve. Cu = 3, Cc = 1.
(b) 100% material passed No. 4 sieve, 90% passed No. 200 sieve. LL = 23, PL = 17.
(c) 70% material retained on No. 4 sieve, 27% retained on No. 200 sieve. Cu = 5, Cc = 1.5.
SOLUTION:
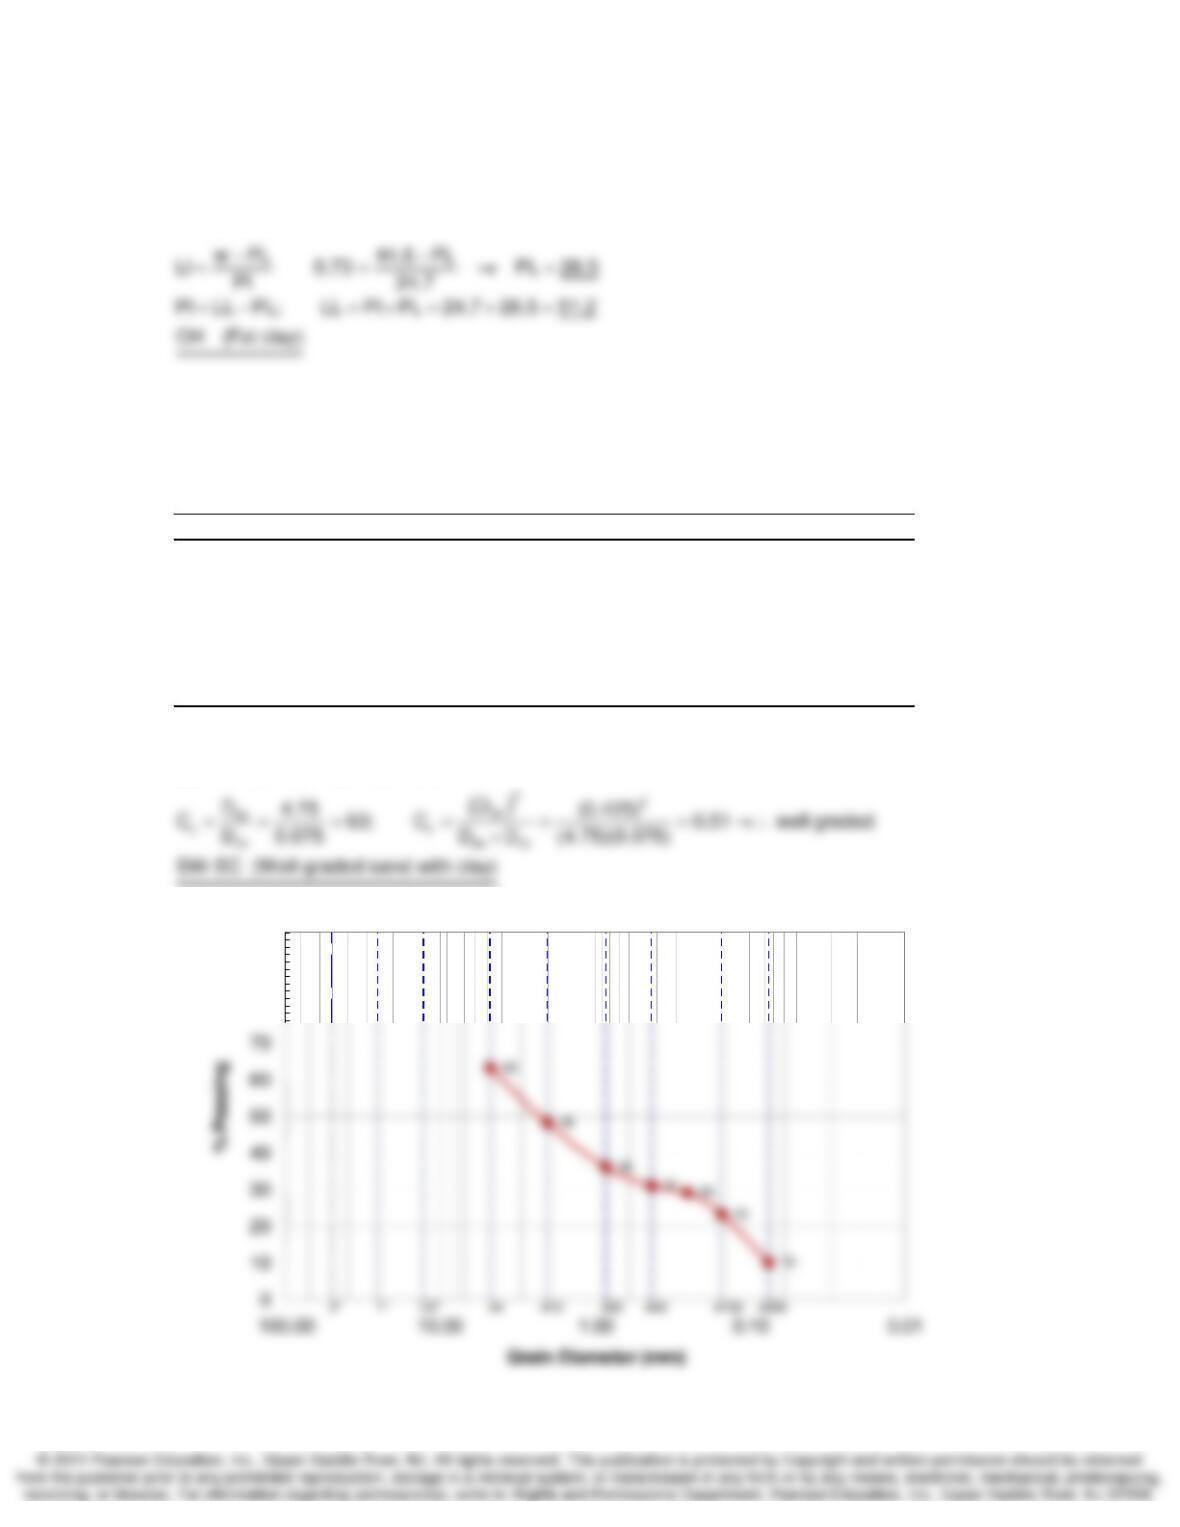
2.65. A sample of soil was tested in the laboratory and the following grain size analysis results
were obtained. Classify this soil according to the USCS, providing the group symbol for it.
Sieve Sieve Opening (mm) Percent Coarser by Weight Percent Finer by Weight
1/2″ 12.7 30 70
44.75 36 64
10 2.00 52 48
20 0.85 64 36
40 0.425 69 31
60 0.25 71 29
100 0.15 77 23
200 0.075 91 9
SOLUTION:
(a) PI LL PL 26 23 3
SW-SM (Well-graded sand with silt)
=−=−=
70
2″
1″ 1/2″
#4 #10
#20
#40
#100
#200
70
80
90
100
Index and Classification Properties of Soils Chapter 2
2.66. A minus No. 40 material had a liquidity index of 0.73, a natural water content of 44.5%, and
a plasticity index of 24.7. Classify this soil according to the USCS, provide the group symbol.
SOLUTION:
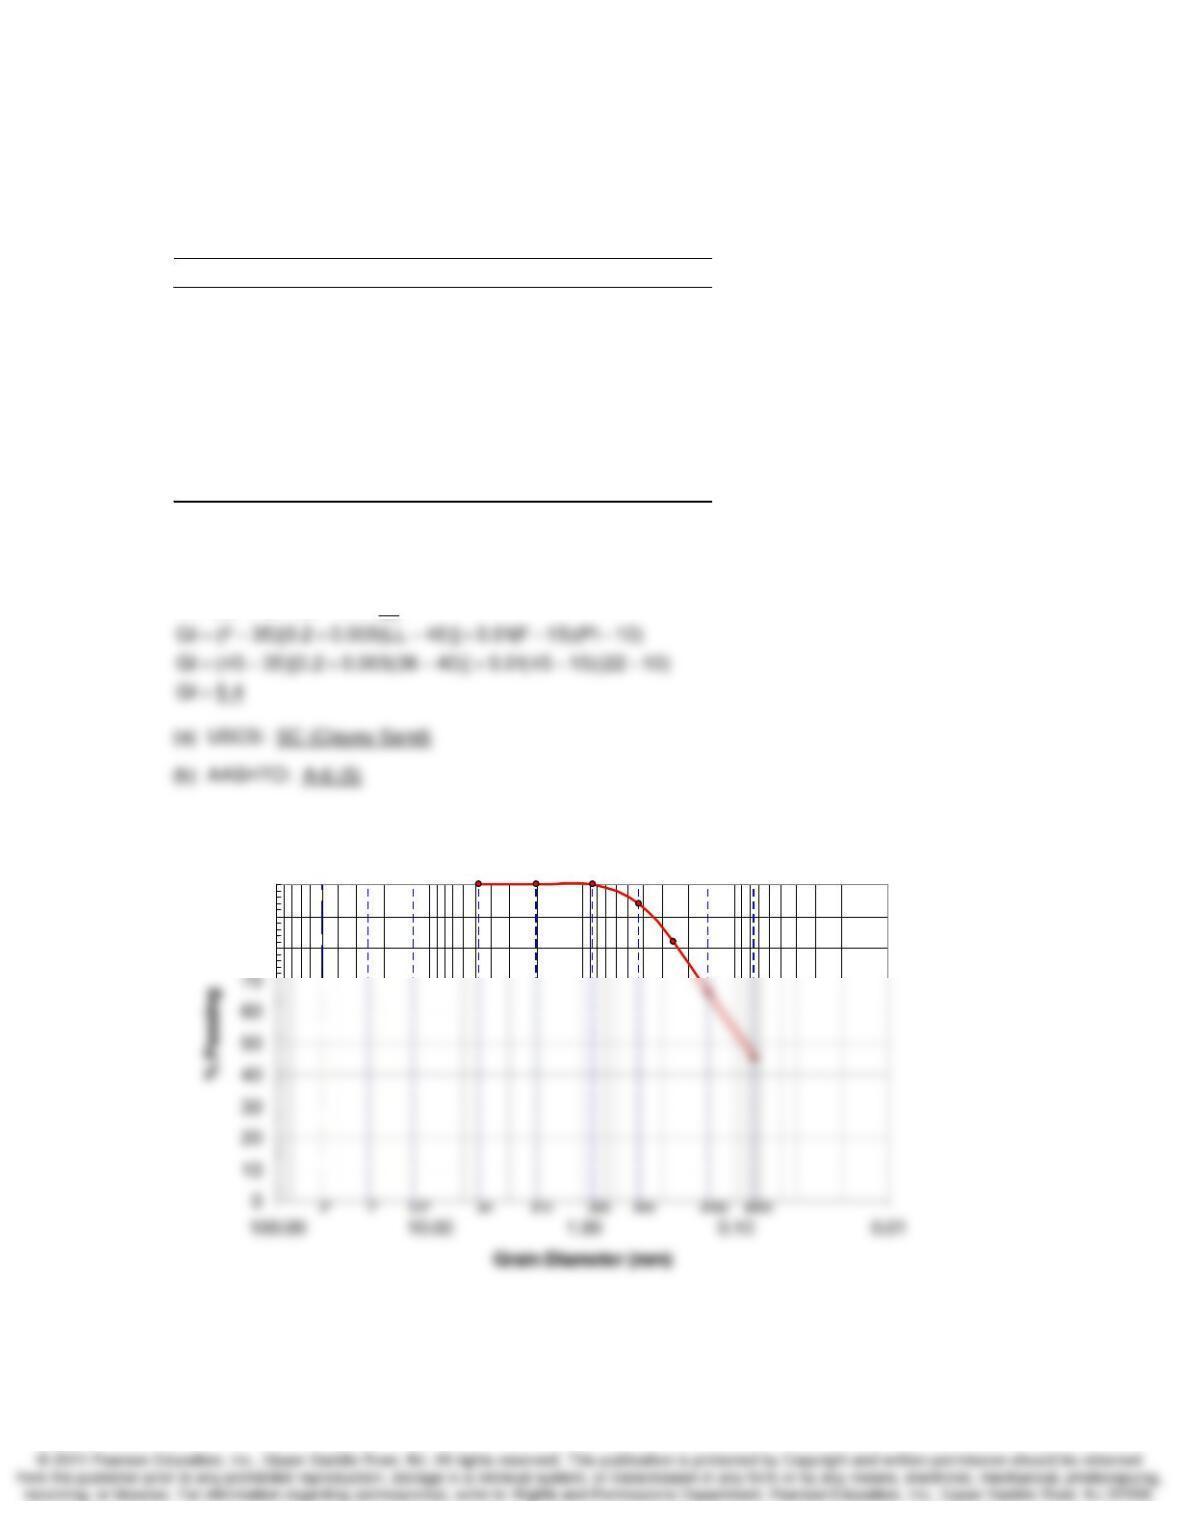
2.67. A sample of soil was tested in the laboratory and the following grain size analysis results
were obtained. Classify this soil according to the USCS, providing the group symbol for it.
Sieve No. Sieve Opening (mm) Percent Coarser by Weight Percent Finer by Weight
44.75 37 63
10 2.00 52 48
20 0.85 64 36
40 0.425 69 31
60 0.25 71 29
100 0.15 77 23
200 0.075 90 10
SOLUTION:
(a) PI LL PL 60 26 34
=−=−=
2″
1″ 1/2″
#4 #10
#20
#40
#100
#200
80
90
100
Index and Classification Properties of Soils Chapter 2
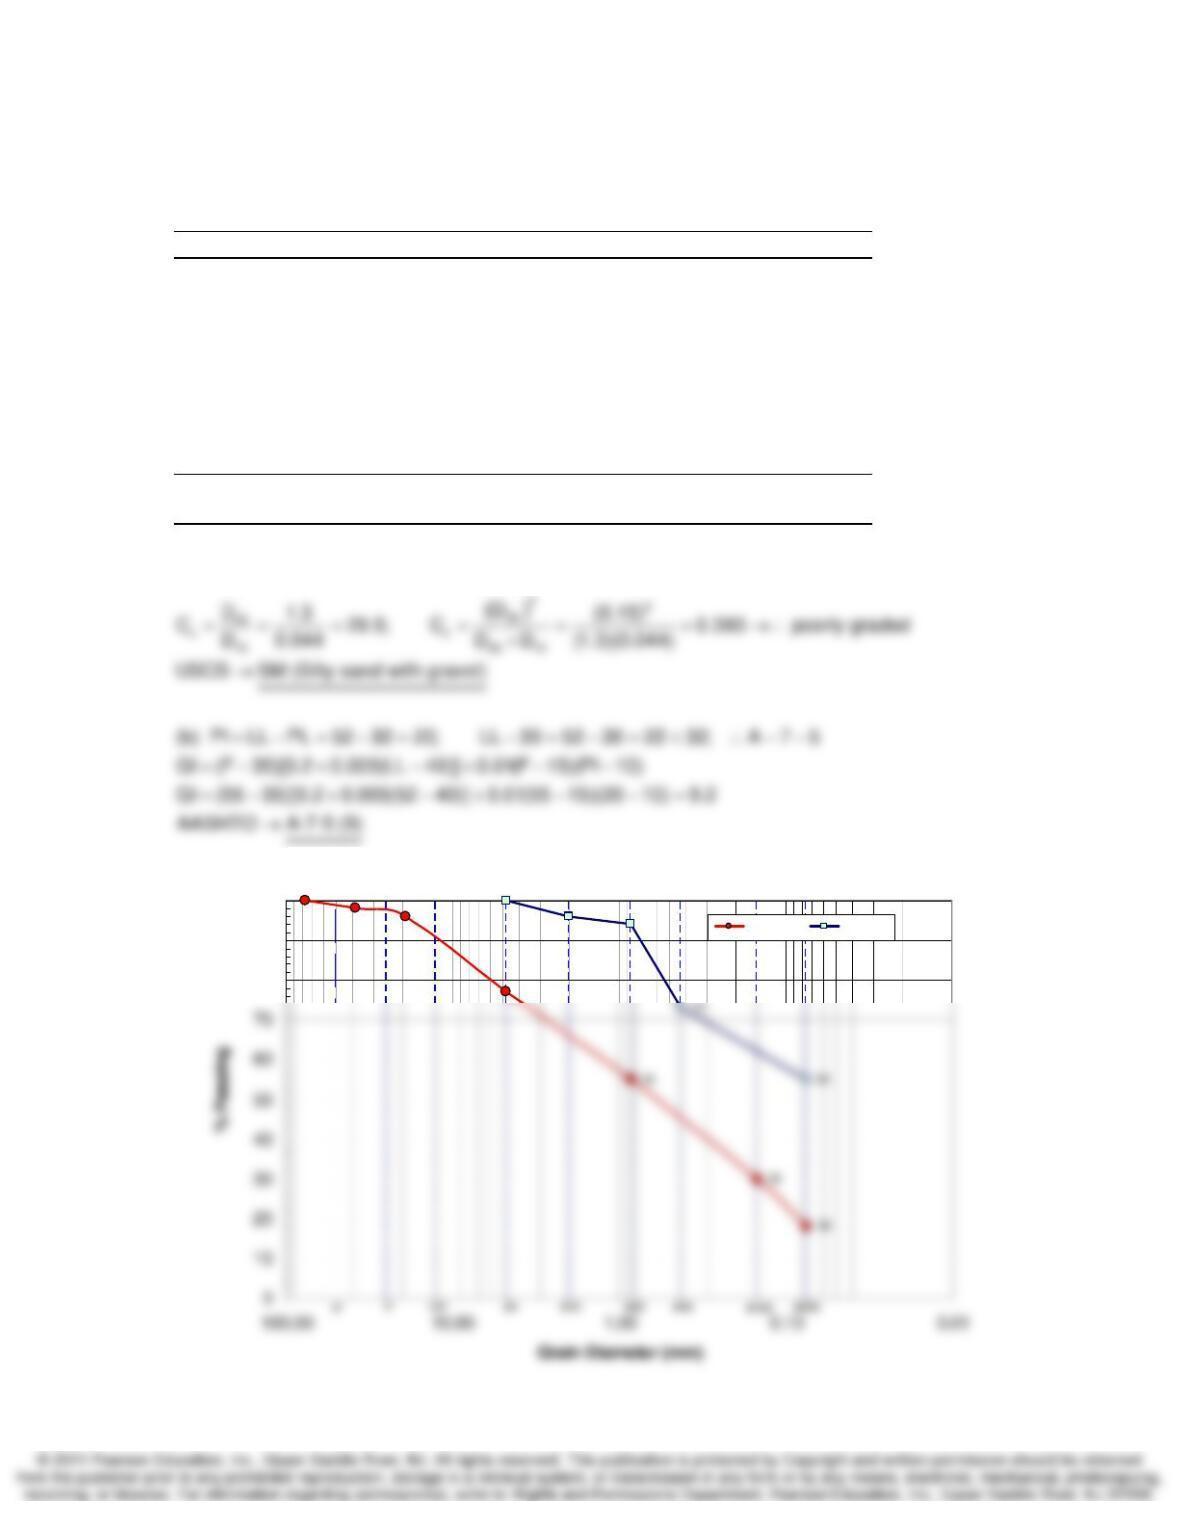
2.68. A sample of soil was tested in the laboratory and the following grain size analysis results
were obtained: Atterberg limits on minus No. 40 material were: LL = 36, PL = 14. Determine the
USCS classification symbol for this soil. Extra credit – determine the full AASHTO classification
for this soil (symbol plus group index).
Sieve No. Sieve Opening (mm) Percent Finer by Weight
4 4.75 100
10 2.00 100
20 0.85 100
40 0.425 94
60 0.25 82
100 0.15 66
200 0.075 45
Pan — 0
SOLUTION:
PI LL PL 36 14 22
=−=−=
Grain Size Distribution Plot
2″
1″ 1/2″
#4 #10
#20
#40
#100
#200
80
90
100
Index and Classification Properties of Soils Chapter 2
2.69. Laboratory testing was performed on two soil samples (A and B).
(a) Determine the USCS classification symbol for Sample A.
(b) Determine the AASHTO classification for Sample B.
Sieve No. Sieve Opening (mm) A – Percent Passing B – Percent Passing
3 inch 76.2 100
1.5 inch 38.1 98
0.75 inch 19.1 96
44.75 77 100
10 2.00 — 96
20 0.85 55 94
40 0.425 — 73
100 0.15 30 —
200 0.075 18 55
Liquid Limit 32 52
Plastic Limit 25 32
SOLUTION:
(a) PI LL PL 32 25 7
=−=−=
100 98 96
77
100
96 94
2″
1″ 1/2″
#4 #10
#20
#40
#100
#200
80
90
100
Sample A Sample B
Index and Classification Properties of Soils Chapter 2
2.70. A sample of soil was tested in the laboratory and the following grain size analysis results
were obtained: Atterberg limits on minus No. 40 material were: LL = 62, PL = 20. Determine the
USCS letter symbol for this soil.
Sieve No. Sieve Opening (mm) Percent Coarser by Weight Percent Finer by Weight
4 4.75 0.0 100.0
10 2.00 5.1 94.9
20 0.85 10.0 90.0
40 0.425 40.7 59.3
60 0.25 70.2 29.8
100 0.15 84.8 15.2
200 0.075 90.5 9.5
Pan — 100.0 0.0
SOLUTION:
PI LL PL 62 20 42
=−=−=
Grain Size Distribution Plot
100.0
94.9
90.0
2″
1″ 1/2″
#4 #10
#20
#40
#100
#200
80
90
100
Index and Classification Properties of Soils Chapter 2
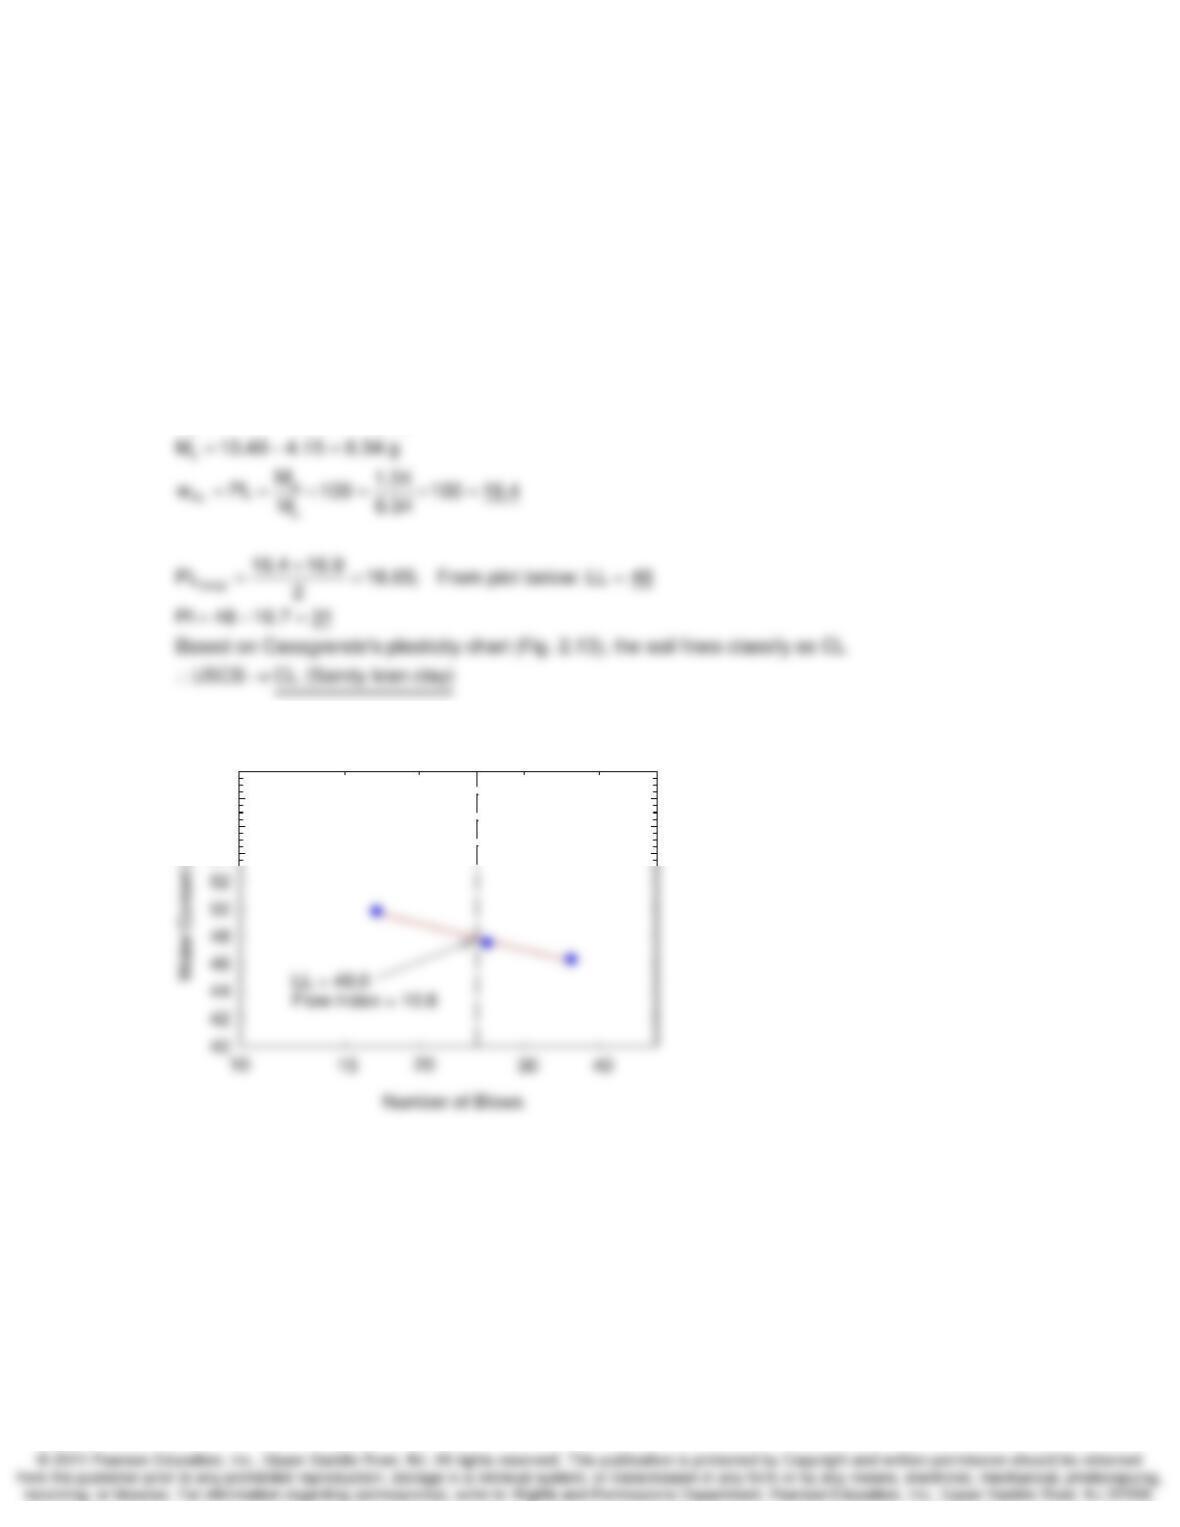
2.71. A sample of a brown sandy clay was obtained to determine its Atterberg limits and then
classify its soil type according to the Unified Soil Classification System. For one of the PL
determinations, the wet + dish = 11.53 g and the dry weight + dish = 10.49 g. The dish only
weighed 4.15 g. Compute the plastic limit. Another plastic limit was 16.9%. Three
determinations of the liquid limit were made. For 17 blows, the water content was 49.8%; for 26
blows, the water content was 47.5%; and for 36 blows, the water content was 46.3%. Evaluate
the soil type, indicate the information on a plasticity chart, and give the Unified Soil Classification
symbol.
SOLUTION:
w
M 11.53 10.49 1.04 g
=−=
54
56
58
60