Chap. 2 Uncertainty and Risk in Foundation Design
2.1 Classify the uncertainty associated with following items as either aleatory or epistemic and
explain your reason for your classification: average wind speed over a 30 day period, location of
a certain applied load, change in strength of a soil caused by sampling method, capacity
determined by a certain analysis method, magnitude of live load caused by vehicles travelling on
a bridge, soil shear strength as measured by a certain method.
Solution
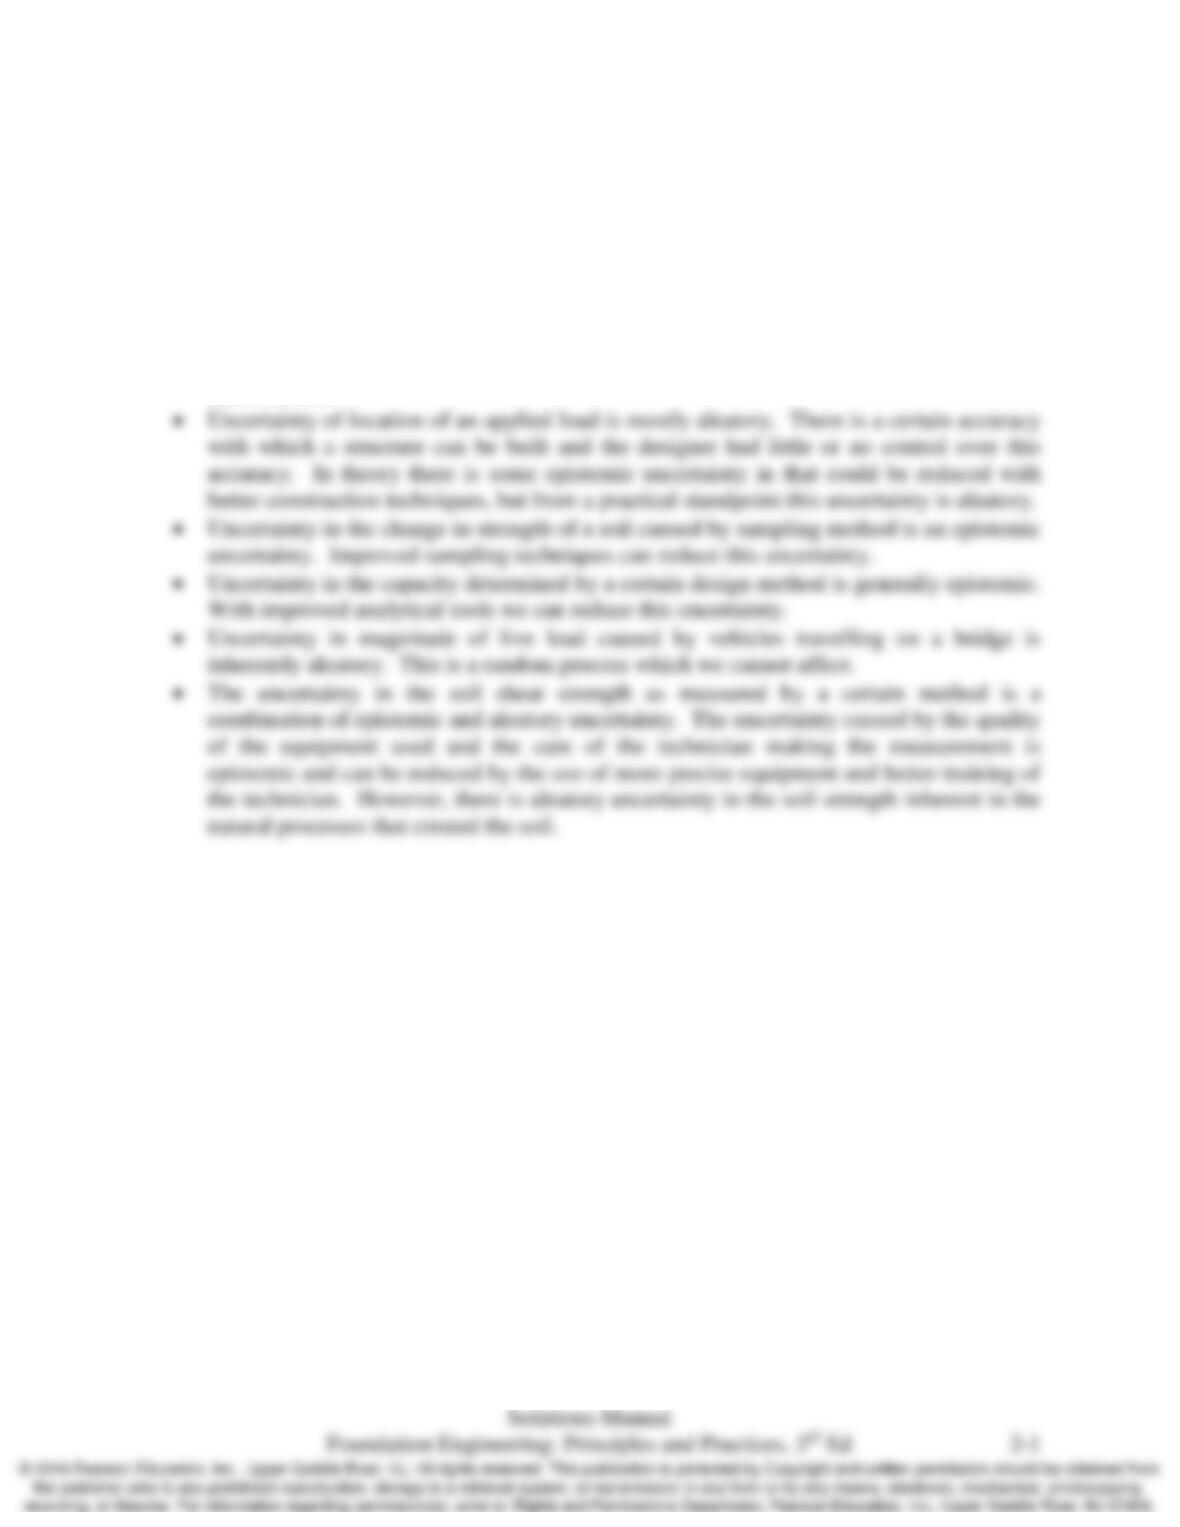
• Uncertainty of the average wind speed is aleatory. This is a random process that we
cannot affect.

Chap. 2 Uncertainty and Risk in Foundation Design
2.2 Figure 2.1 shows the PDF for a normal distribution determined from the unconfined compression
tests shown in the histogram. Does the mean and standard deviation of this PDF represent
aleatory or epistemic uncertainty? Explain.
Solution
The mean and standard deviation of this PDF contain both aleatory and epistemic uncertainty.
The mean of 20.8 and standard deviation of 7.30 are estimate valued of the true mean and
Chap. 2 Uncertainty and Risk in Foundation Design
2.3 List three sources of epistemic uncertainty associated with determining the soil strength at a
given site and describe how you might reduce these uncertainties.
Solution
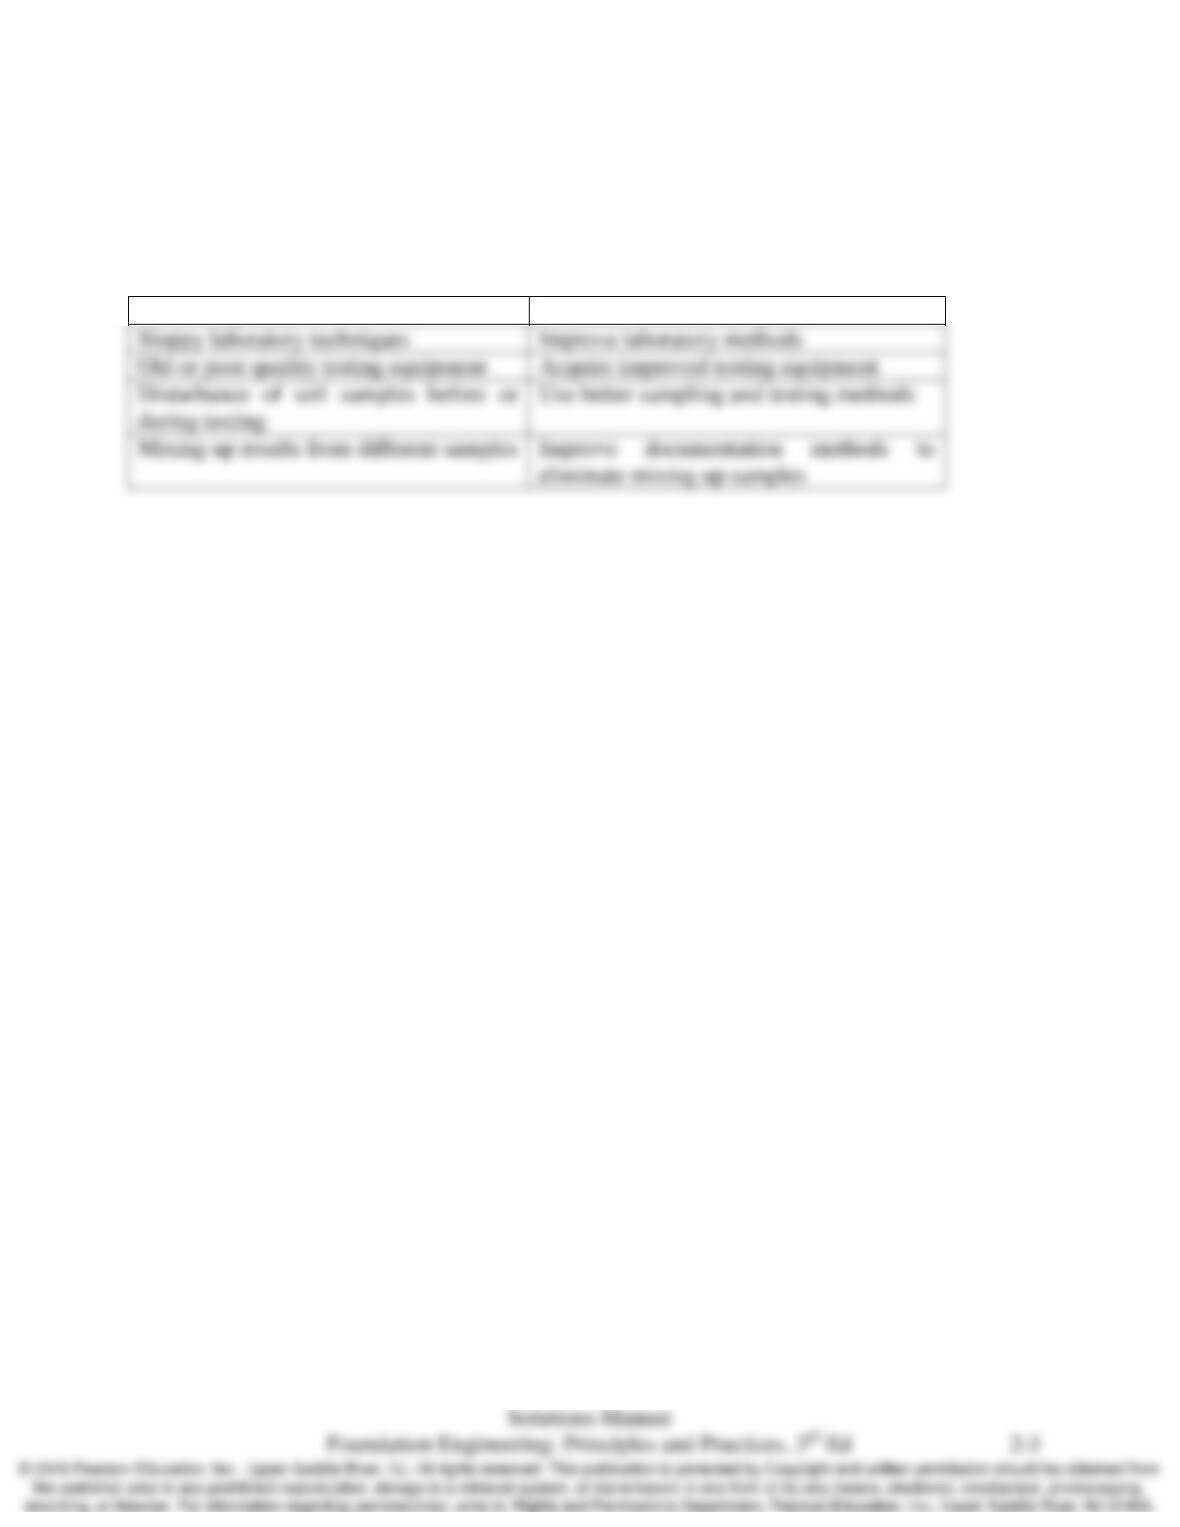
Source
How do reduce
Small sample size
Take and test more samples
Sloppy laboratory techniques
Improve laboratory methods
Acquire improved testing equipment
during testing
eliminate mixing up samples
Chap. 2 Uncertainty and Risk in Foundation Design
2.4 Using a random number generator create a sample of 4 relative densities using the PDF
presented in Figure 2.2. Repeat the exercise to create 3 different sample sets. Compute the mean
and standard deviation of your sample. Compute the mean and standard deviation of each
sample set. Compare the means and standard deviations of your samples with each other and
with the mean and standard deviation of the original distribution. Discuss the differences among
the sample sets and the original distribution, including the type of uncertainties you are dealing
with. How many samples do you think are needed to reliably determine the mean and standard
deviation of the relative density of this particular soil?
Solution
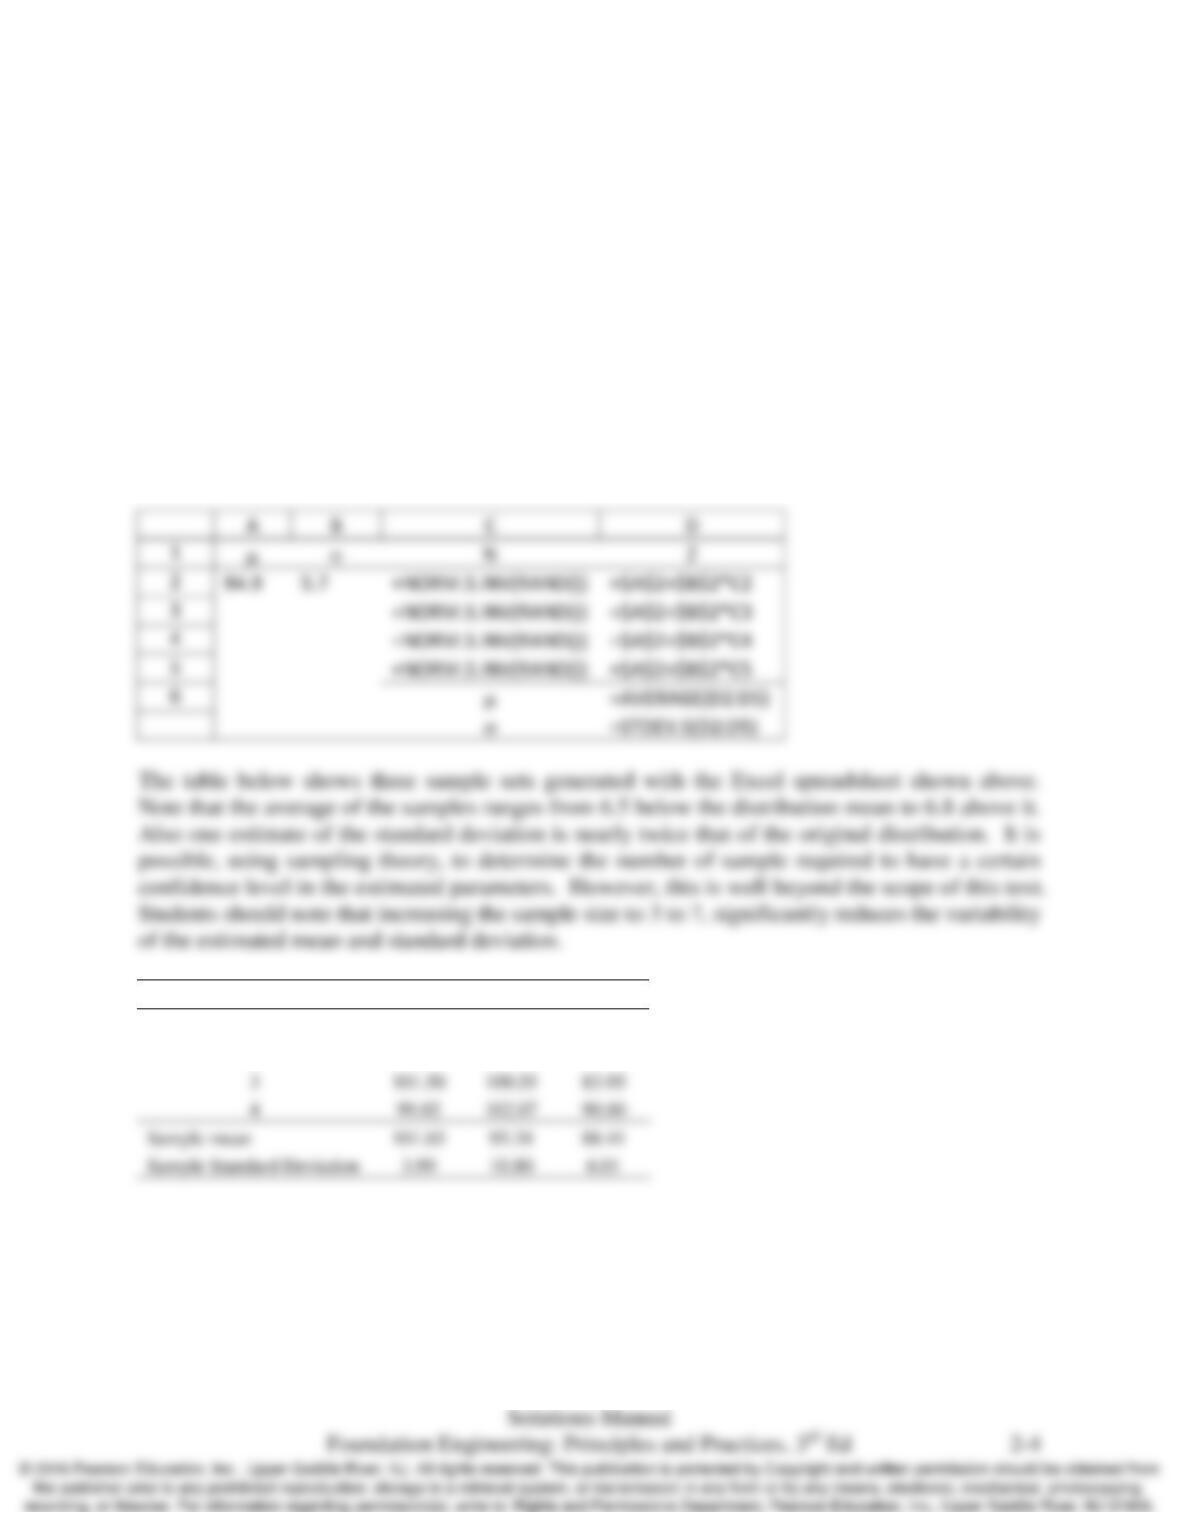
There are an infinite number of solutions to this problem. The table below shows Excel
spreadsheet formula that can be used to generate the random sample sets.
Sample #
Trial 1
Trial 2
Trial 3
1
107.34
92.44
95.79
2
98.75
78.47
83.10
3
101.50
100.55
83.95
4
99.02
102.07
90.80
101.65
93.38
88.41
10.80
Chap. 2 Uncertainty and Risk in Foundation Design
2.5 A certain column will carry a dead load estimated to be 400 k with a COV of 0.1 and a live load
of 200 k with a COV of 0.25. What is the mean and standard deviation of the total column load?
What is the probability that this load will exceed 750 k?
Solution
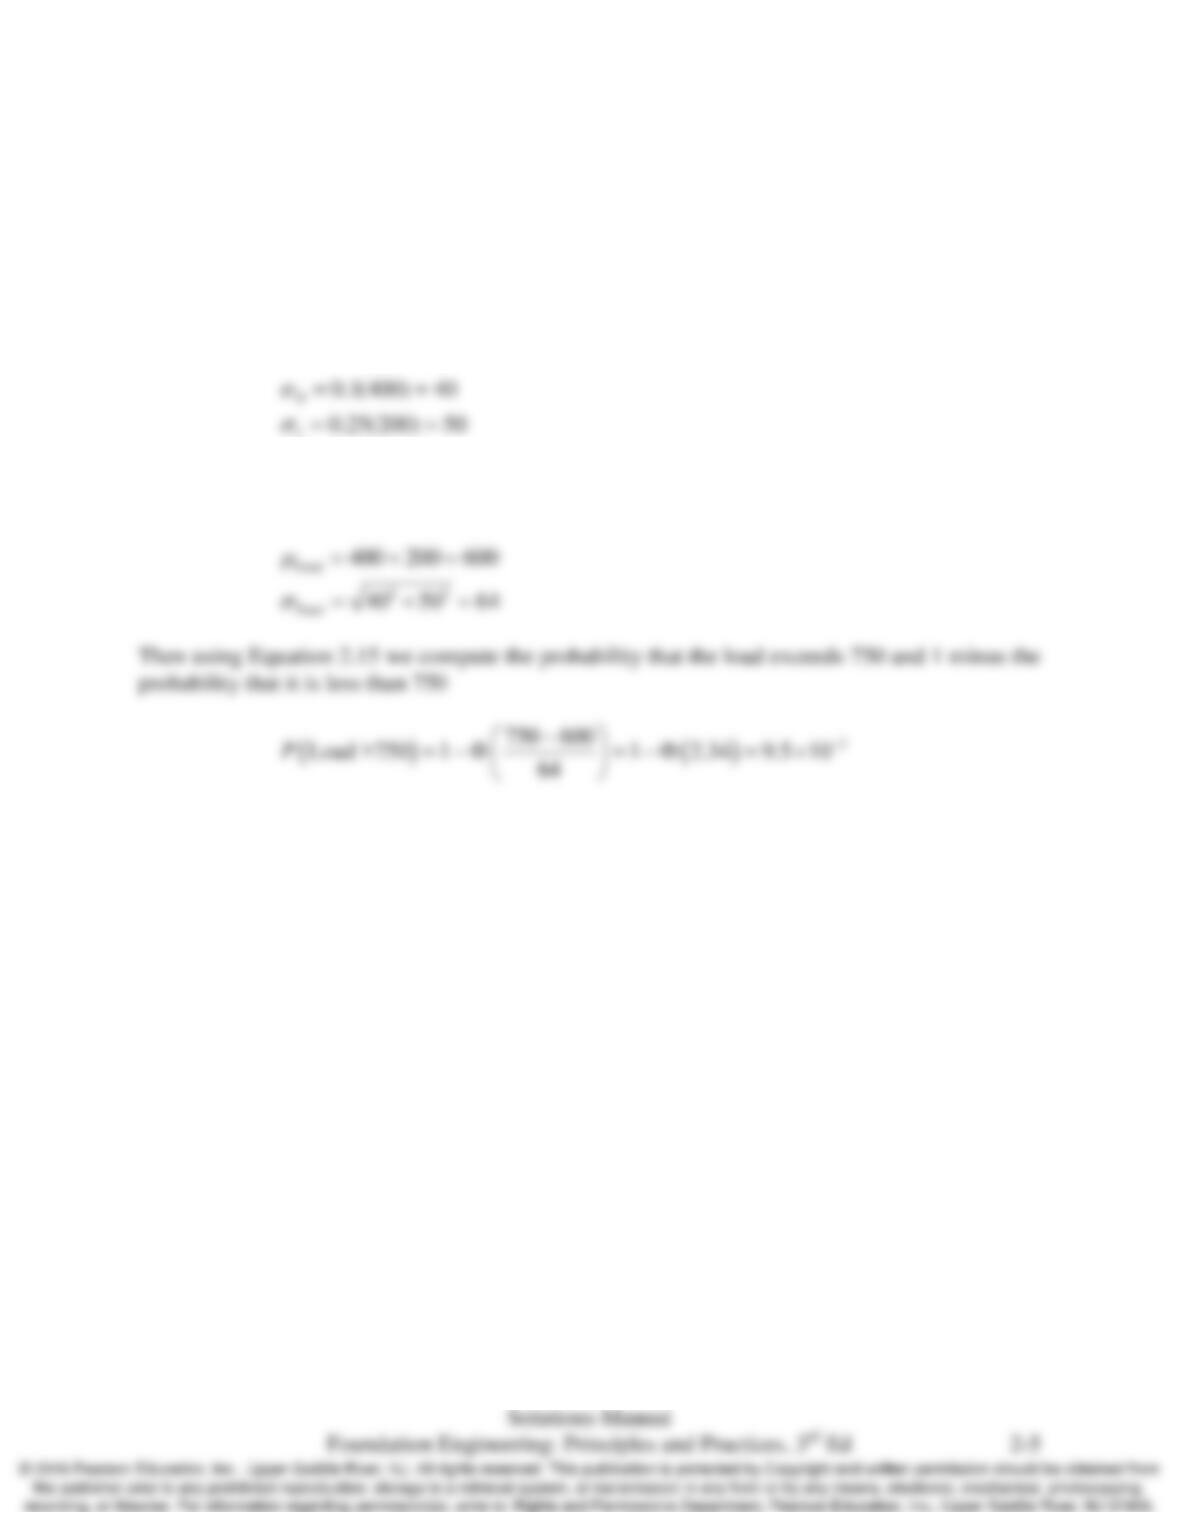
First we must compute the standard deviation of each random variable from their mean and COV
using Equation 2.10.
L
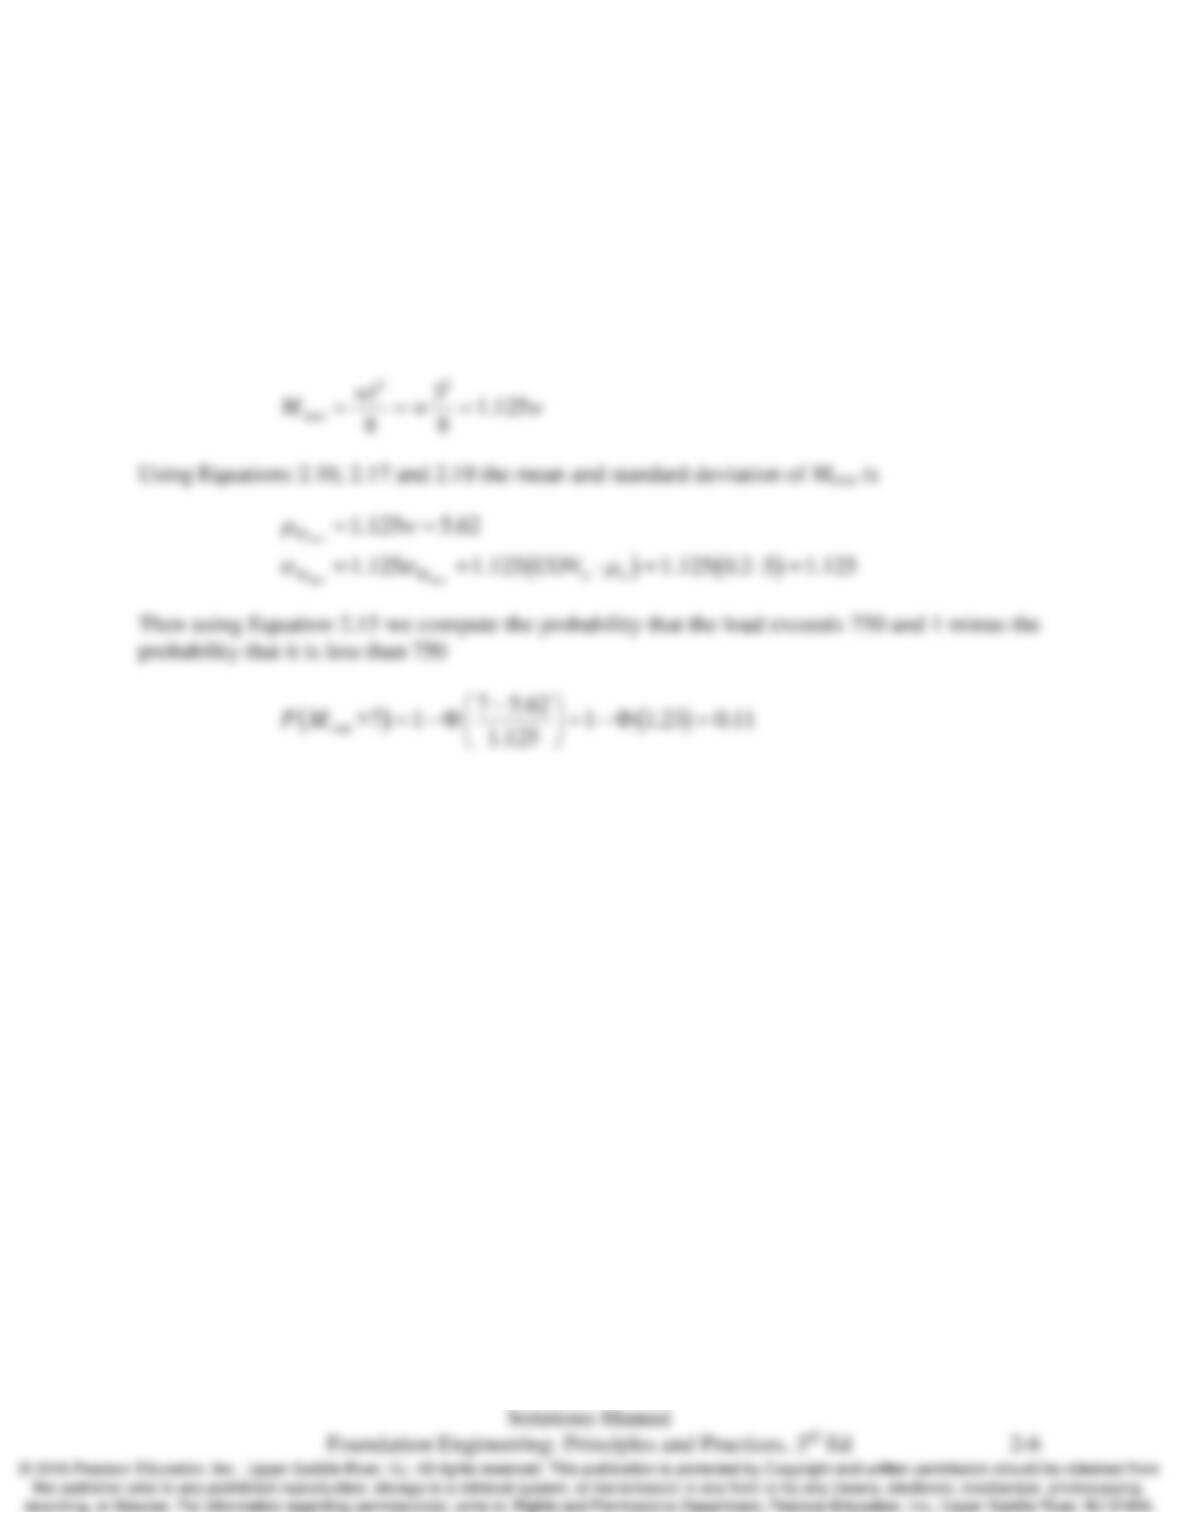
Then we compute the mean and standard deviation of the total column load using Equations 2.17
and 2.18
Chap. 2 Uncertainty and Risk in Foundation Design
2.6 A simply supported beam has a length of 3 m and carries a distributed load with a mean of 5
kN/m and a COV of 0.2. What is the mean and standard deviation of the maximum moment in
the beam? What is the probability the maximum moment will exceed 7 kN–m?
Solution
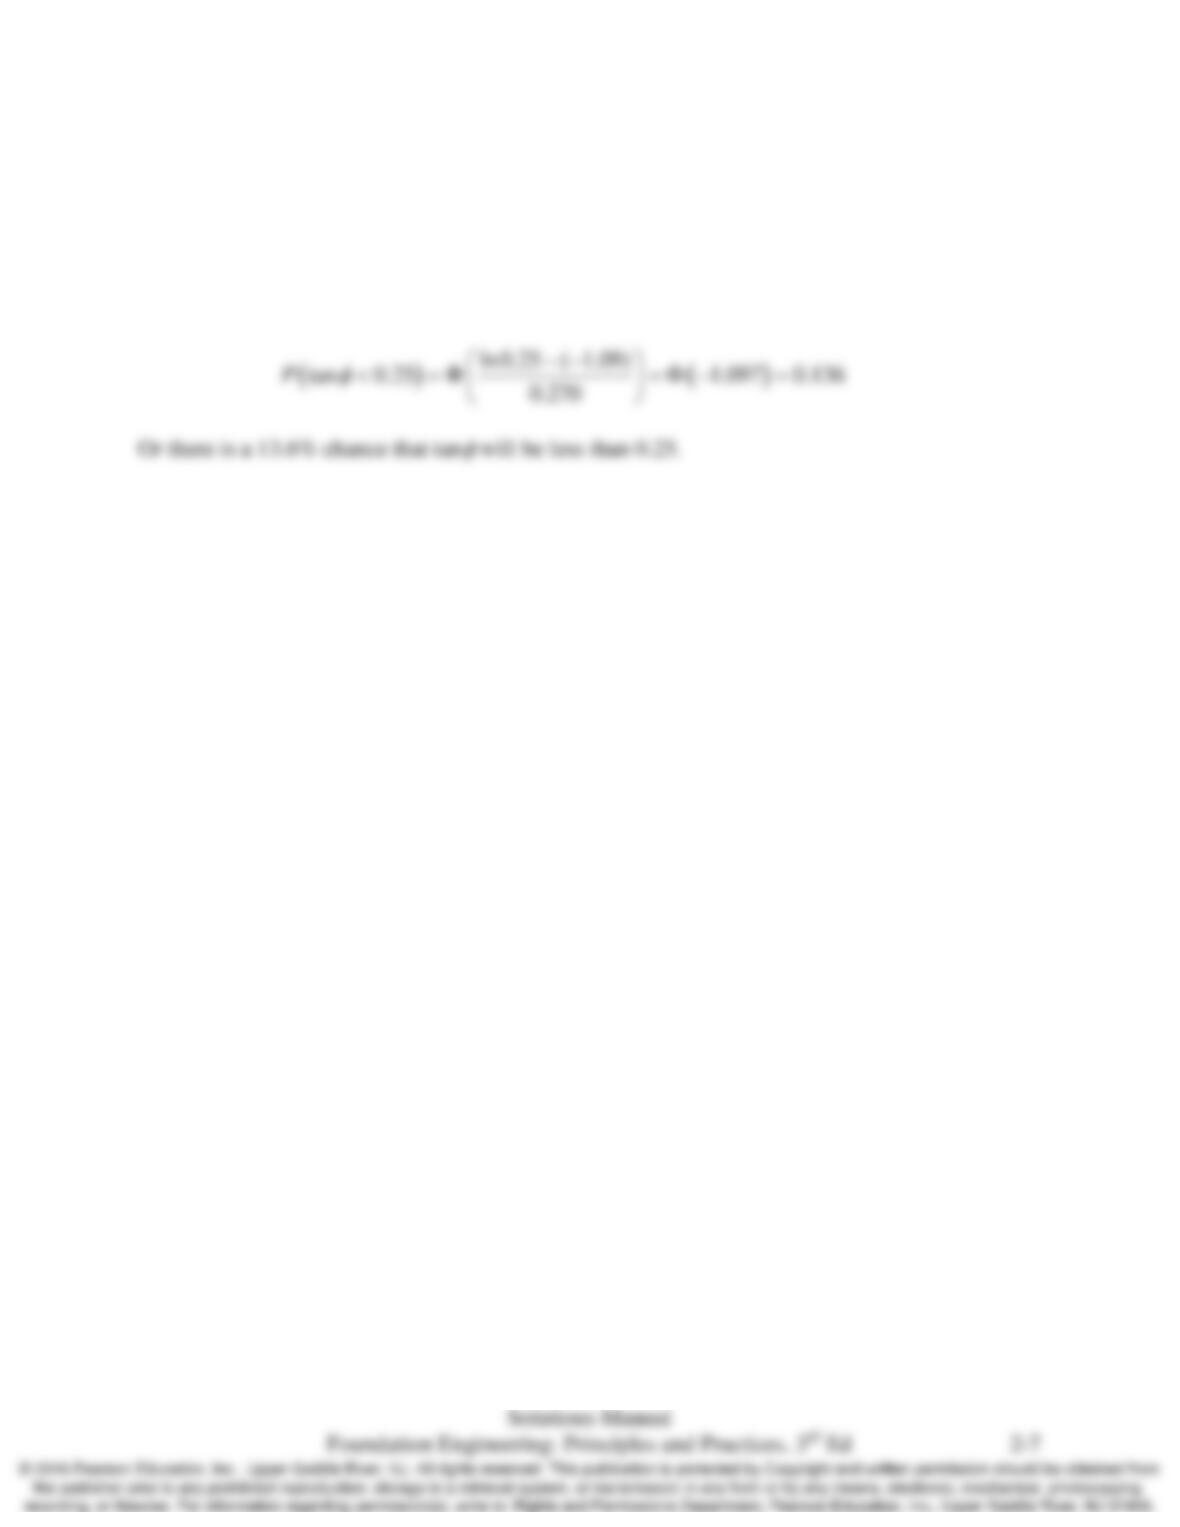
The equation for the maximum moment in a simply supported beam subject to a distributed load
is
Chap. 2 Uncertainty and Risk in Foundation Design
2.7 Using the data shown in Figure 2.5, determine the probability that tangent of the friction angle
for the mudstone at the Confederation Bridge site is less than 0.25.
Solution
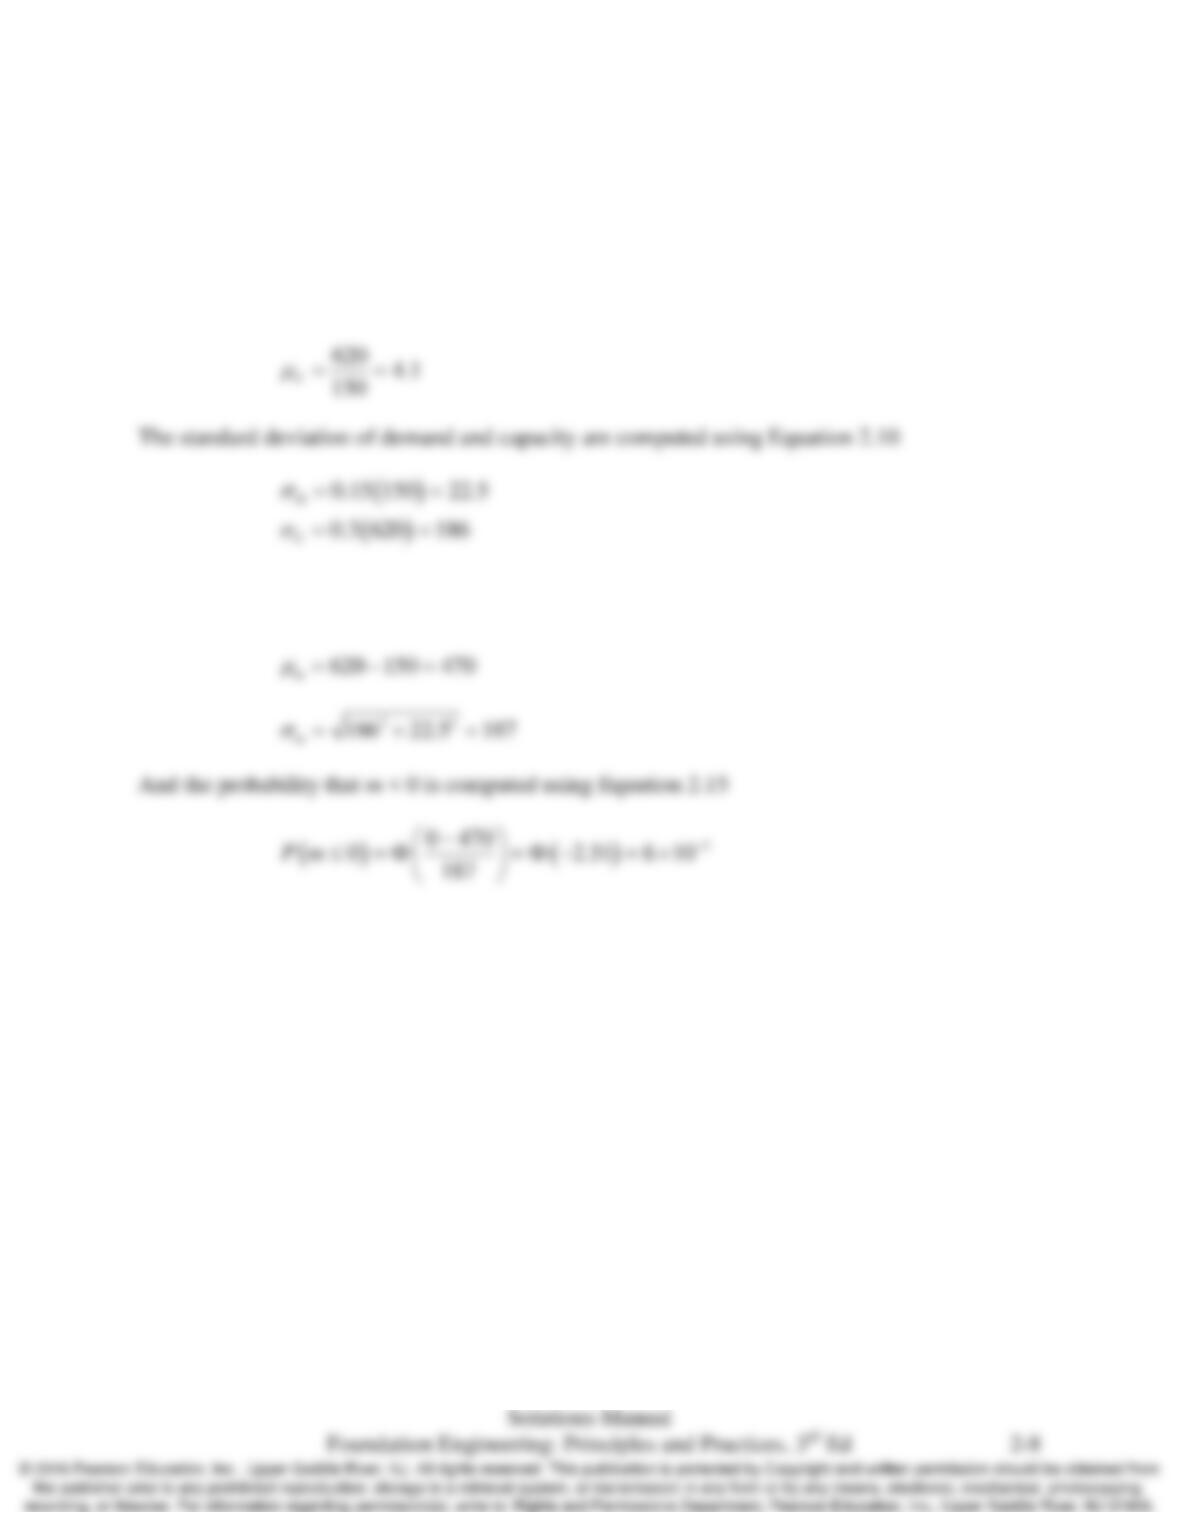
The data in Figure 2.5 is lognormally distributed with µ = -1.09 and
σ
= 0.270. Using Equation
2.16
Chap. 2 Uncertainty and Risk in Foundation Design
2.8 The capacity for a certain foundation system is estimated to be 620 kN with a COV of 0.3. The
demand on the foundation is estimated to be 150 kN with a COV of 0.15. Compute the mean
factor of safety of this foundation and its probability of failure.
Solution
The mean factor of safety is
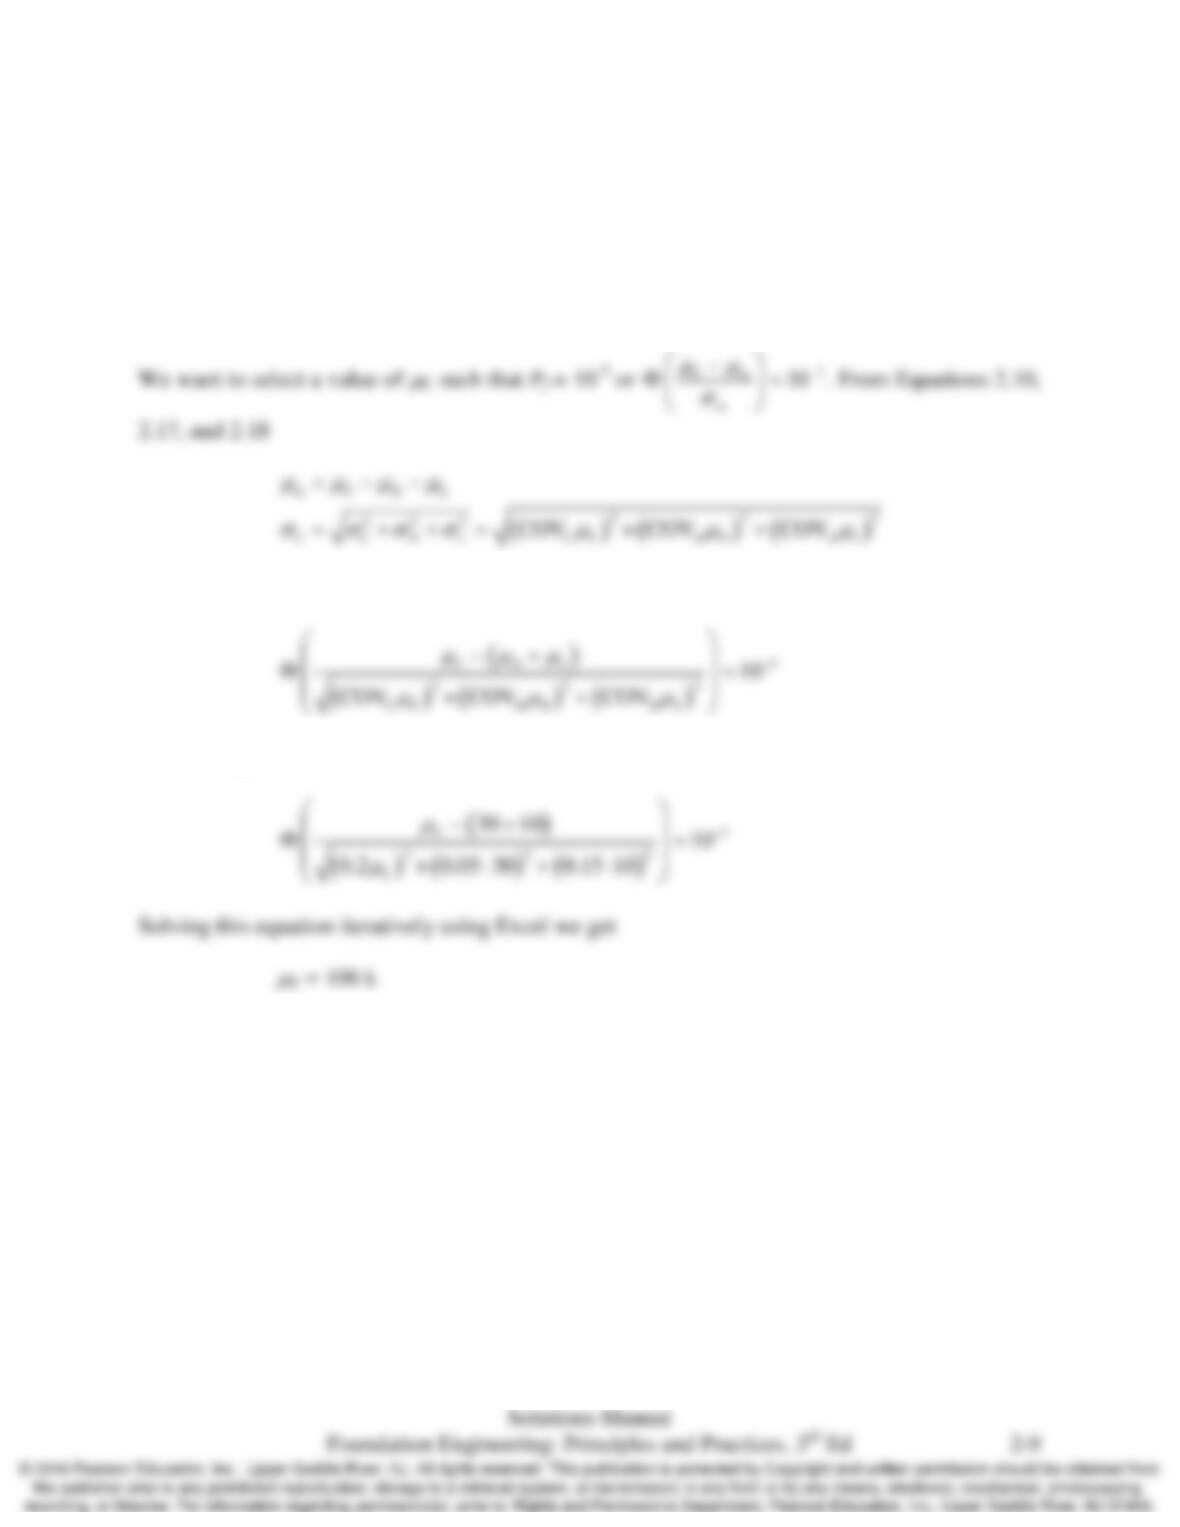
The mean and standard deviation of the safety margin, m, are computed using Equations 2.17
and 2.18
Chap. 2 Uncertainty and Risk in Foundation Design
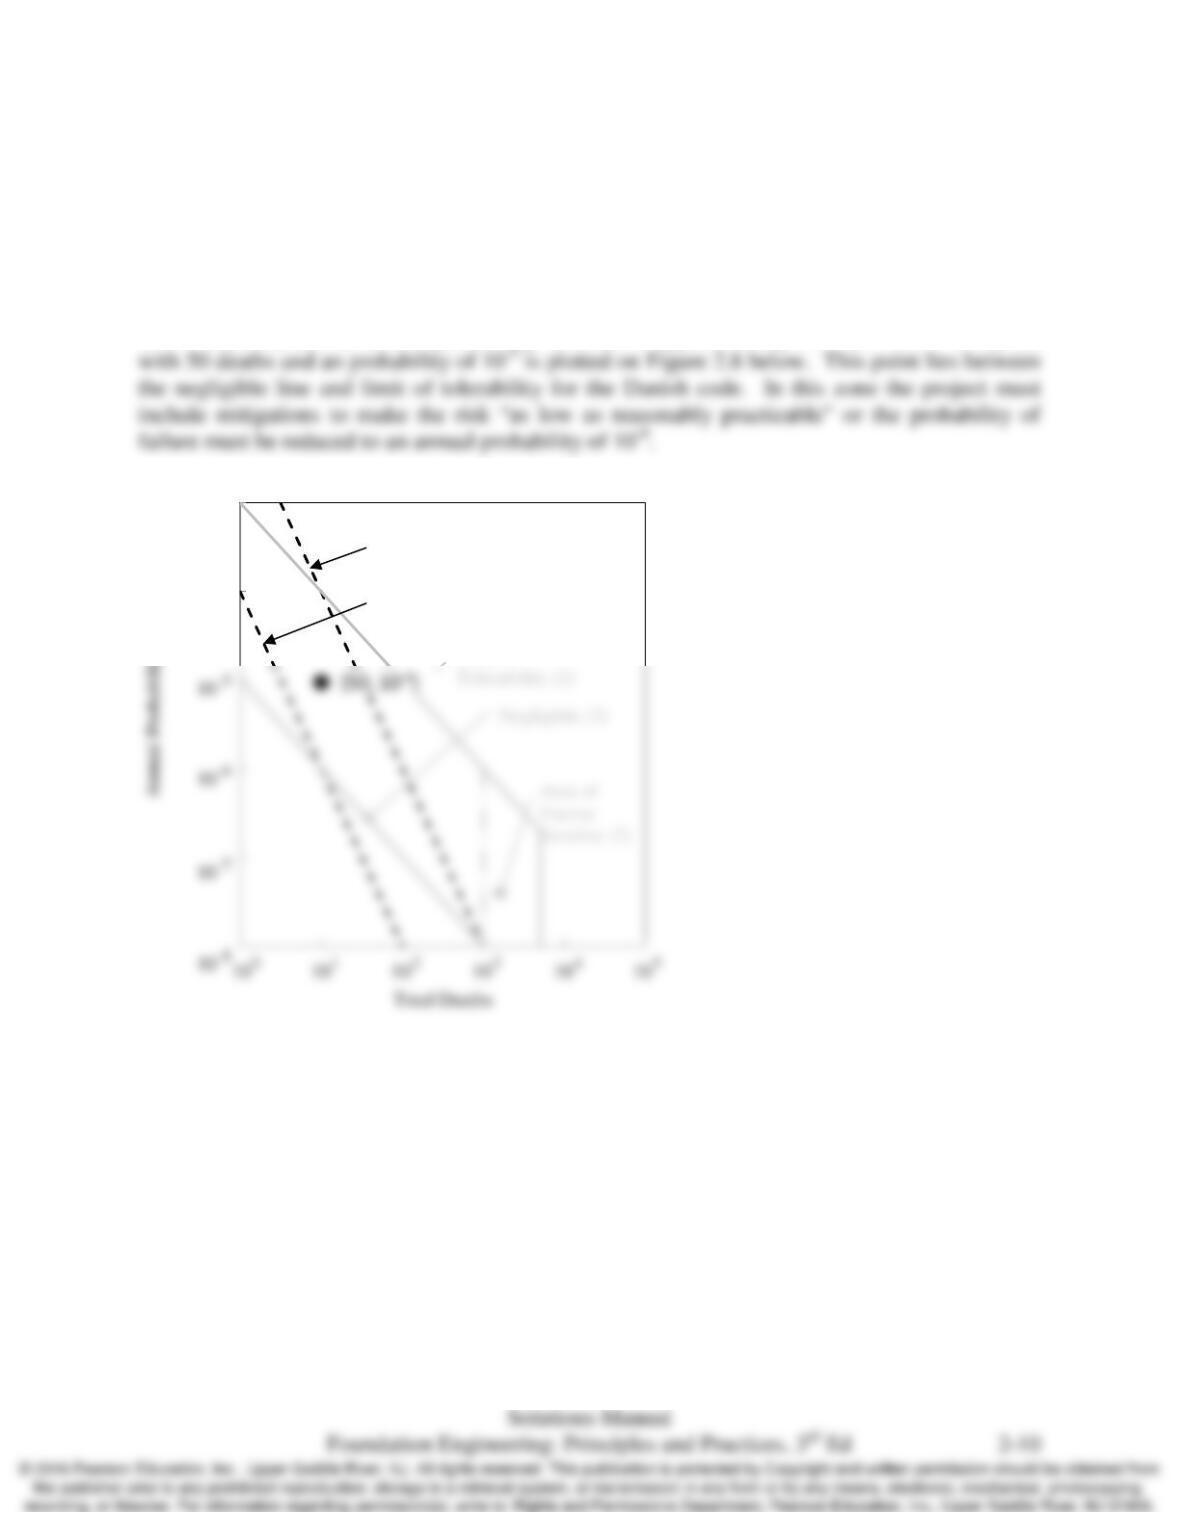
2.9 We wish to design a shallow foundation with a probability of failure of 10-3. The footing
supports a column carrying a dead load with a mean of 30 k and COV of 0.05 and a live load
with a mean of 10 k and COV of 0.15. Based on the uncertainty of soil properties and our
analysis method, we estimate the COV of the foundation capacity to be 0.2. For what mean
capacity does the foundation need to be designed?
Solution
And
Substituting know values of for the COVs and means
Chap. 2 Uncertainty and Risk in Foundation Design
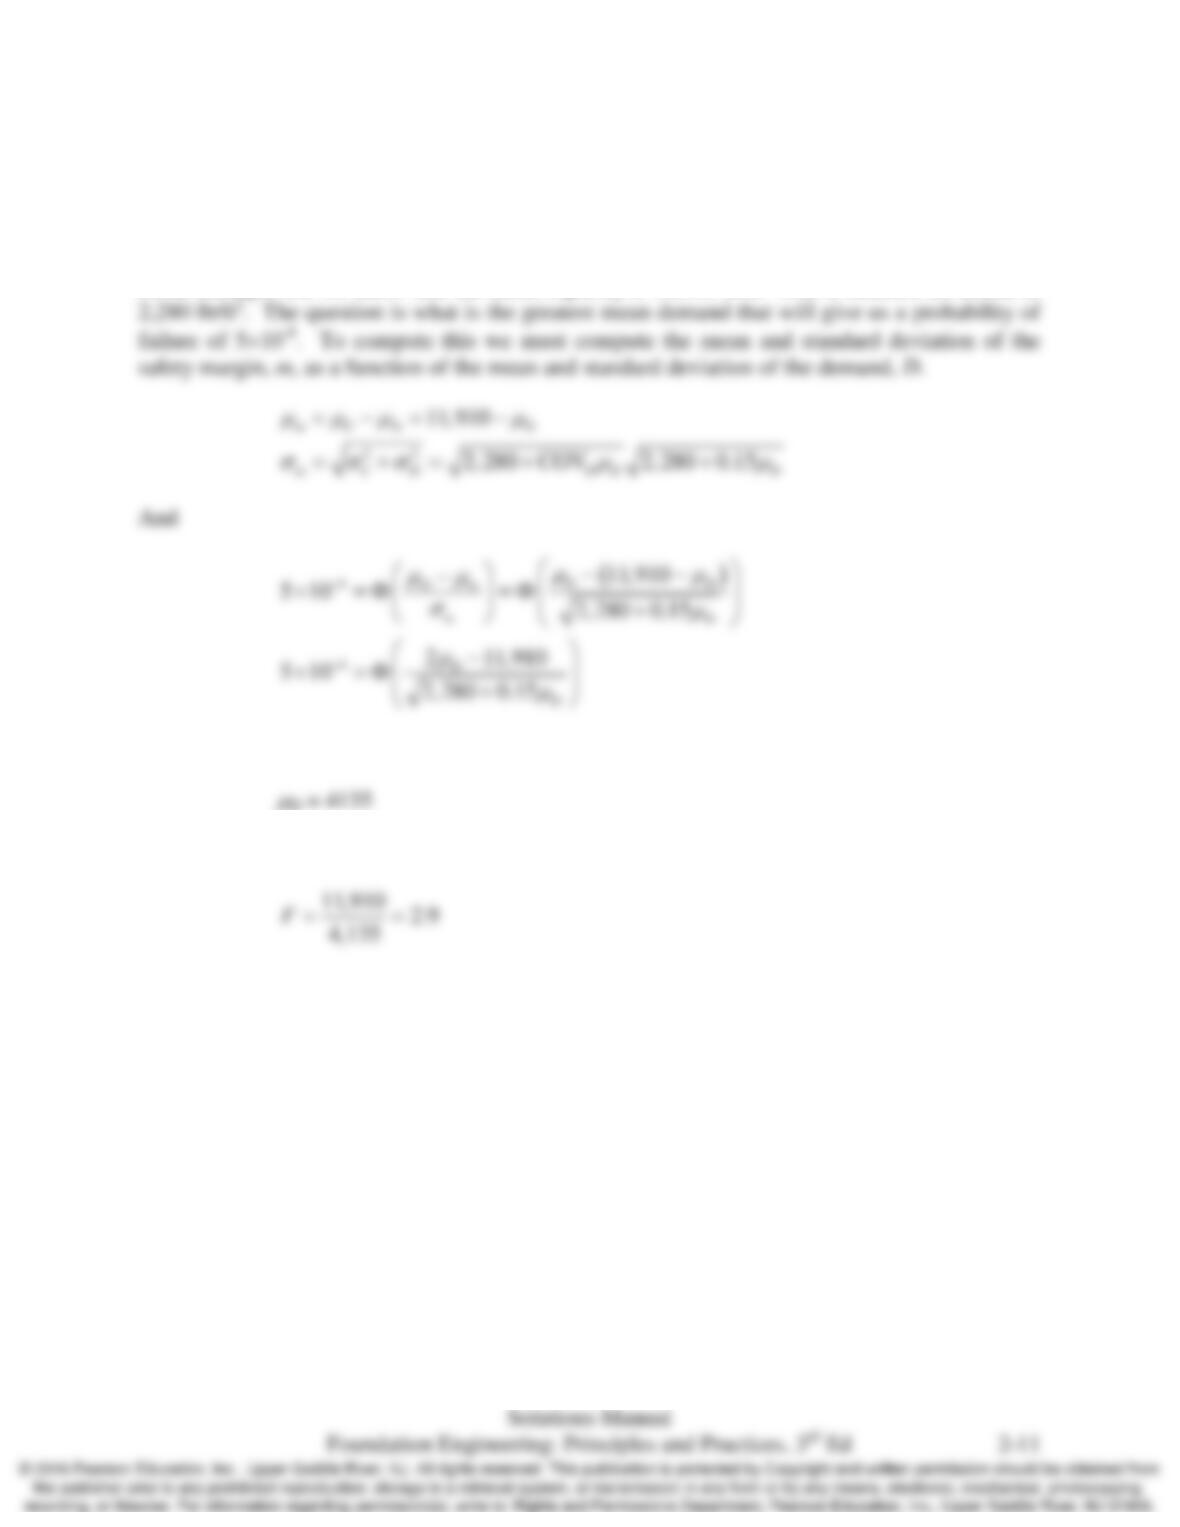
2.10 Assume the foundation in Problem 2.9 was to support a high voltage transmission line near the
Danish city of Århus. If the transmission line fails it will potentially kill 50 people. If the
computed probability of failure is for a design life of 100 years, is risk associated with the failure
of design acceptable based on the Danish guidance in Figure 2.8? Explain.
Solution
The probability of failure in Problem 2.9 was set to 10-3. If this is the total probability of failure
over 100 years, then the annual probability of failure is approximately 10-3/100 = 10-5. The point
1.E-04
1.E-03
Limit of
Limit of
Tolerability (1)
10
-3
10
-4
Negligible (1)
Chap. 2 Uncertainty and Risk in Foundation Design
2.11 For the footing in Example 2.2, compute factor of safety required for a probability of failure of
5×10⁻⁴ assuming the COV of the demand is 0.15
Solution
From Example 2.2 we know that the mean capacity is 11,910 lb/ft2 with a standard deviation of
Solving the above equation iteratively using Excel, we compute
D = 4135
And the mean factor of safety, F, is then

Chap. 2 Uncertainty and Risk in Foundation Design
2.12 If the ASD design method has work satisfactorily for over 50 years, what’s the value in changing
to LRFD method?
Solution
There are two major advantages to LRFD when compared to ASD. First, since LRFD uses