Chapter 2: Demand, Supply, and Market Equilibrium
Chapter 2:
DEMAND, SUPPLY, AND MARKET EQUILIBRIUM
Essential Concepts
1. The amount of a good or service that consumers are willing and able to purchase during a given
period of time is called quantity demanded (Qd). Six principal variables influence quantity demanded:
(1) the price of the good or service (P), (2) the incomes of consumers (M), (3) the prices of related
2. The impact on Qd of changing one of the six factors while the other five remain constant is
summarized below.
(1) The quantity demanded of a good is inversely related to its own price by the law of demand. Thus
d
Q PD D
is negative.
3. The general demand function can be expressed in linear functional form as
Qd=a+bP +cM +dP
R+eÁ+ f P
E+gN
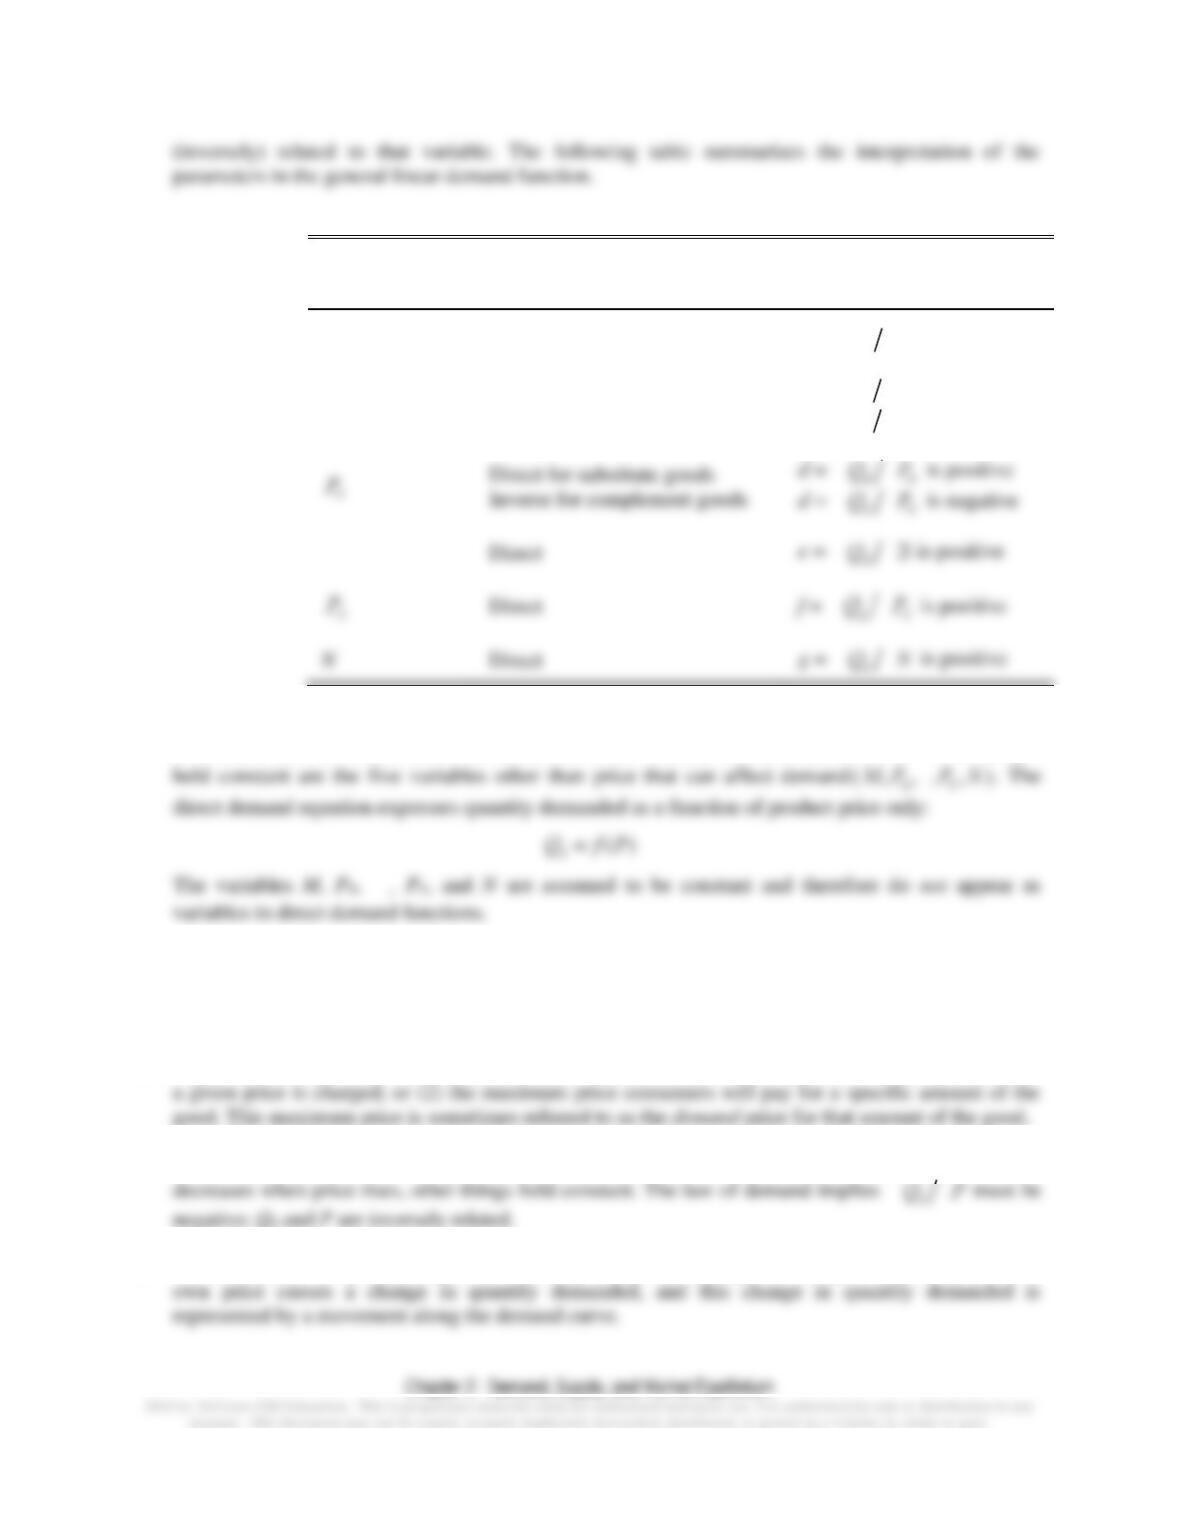
Variable
Relation to Quantity Demanded
Sign of Slope Parameter
P
Inverse
b =
D D
d
Q P
is negative
M
Direct for normal goods
Inverse for inferior goods
c =
d
Q MD D
is positive
c =
D D
d
Q M
is negative
Direct
e =
Direct
4. The direct demand function (or simply demand) shows the relation between price and quantity
demanded when all other factors that affect consumer demand are held constant. The “other things”
5. When graphing demand curves, economists traditionally plot the independent variable price (P) on
the vertical axis and Qd, the dependent variable, on the horizontal axis. The equation so plotted is
actually the inverse demand function
P=f(Qd)
.
6. A point on a demand curve shows either: (1) the maximum amount of a good that will be purchased if
7. The law of demand states that quantity demanded increases when price falls and quantity demanded
8. When the price of a good changes, the “quantity demanded” changes. A change in a good or service’s
Chapter 2: Demand, Supply, and Market Equilibrium
9. The five variables held constant in deriving demand
R,Á,P
E,N)
are called the determinants of
10. The quantity supplied (Qs) of a good depends most importantly upon six factors: (1) the price of the
good itself (P), (2) the price of inputs used in production (PI), (3) the prices of goods related in
11. The impact on Qs of changing one of the six factors while the other five remain constant is
summarized below.
(1) The quantity supplied of a good is directly related to the price of the good. Thus
s
Q PD D
is
positive.
(2) As input prices increase (decrease), production costs rise (fall), and producers will want to supply
a smaller (larger) quantity at each price. Thus
s I
Q PD D
is negative.
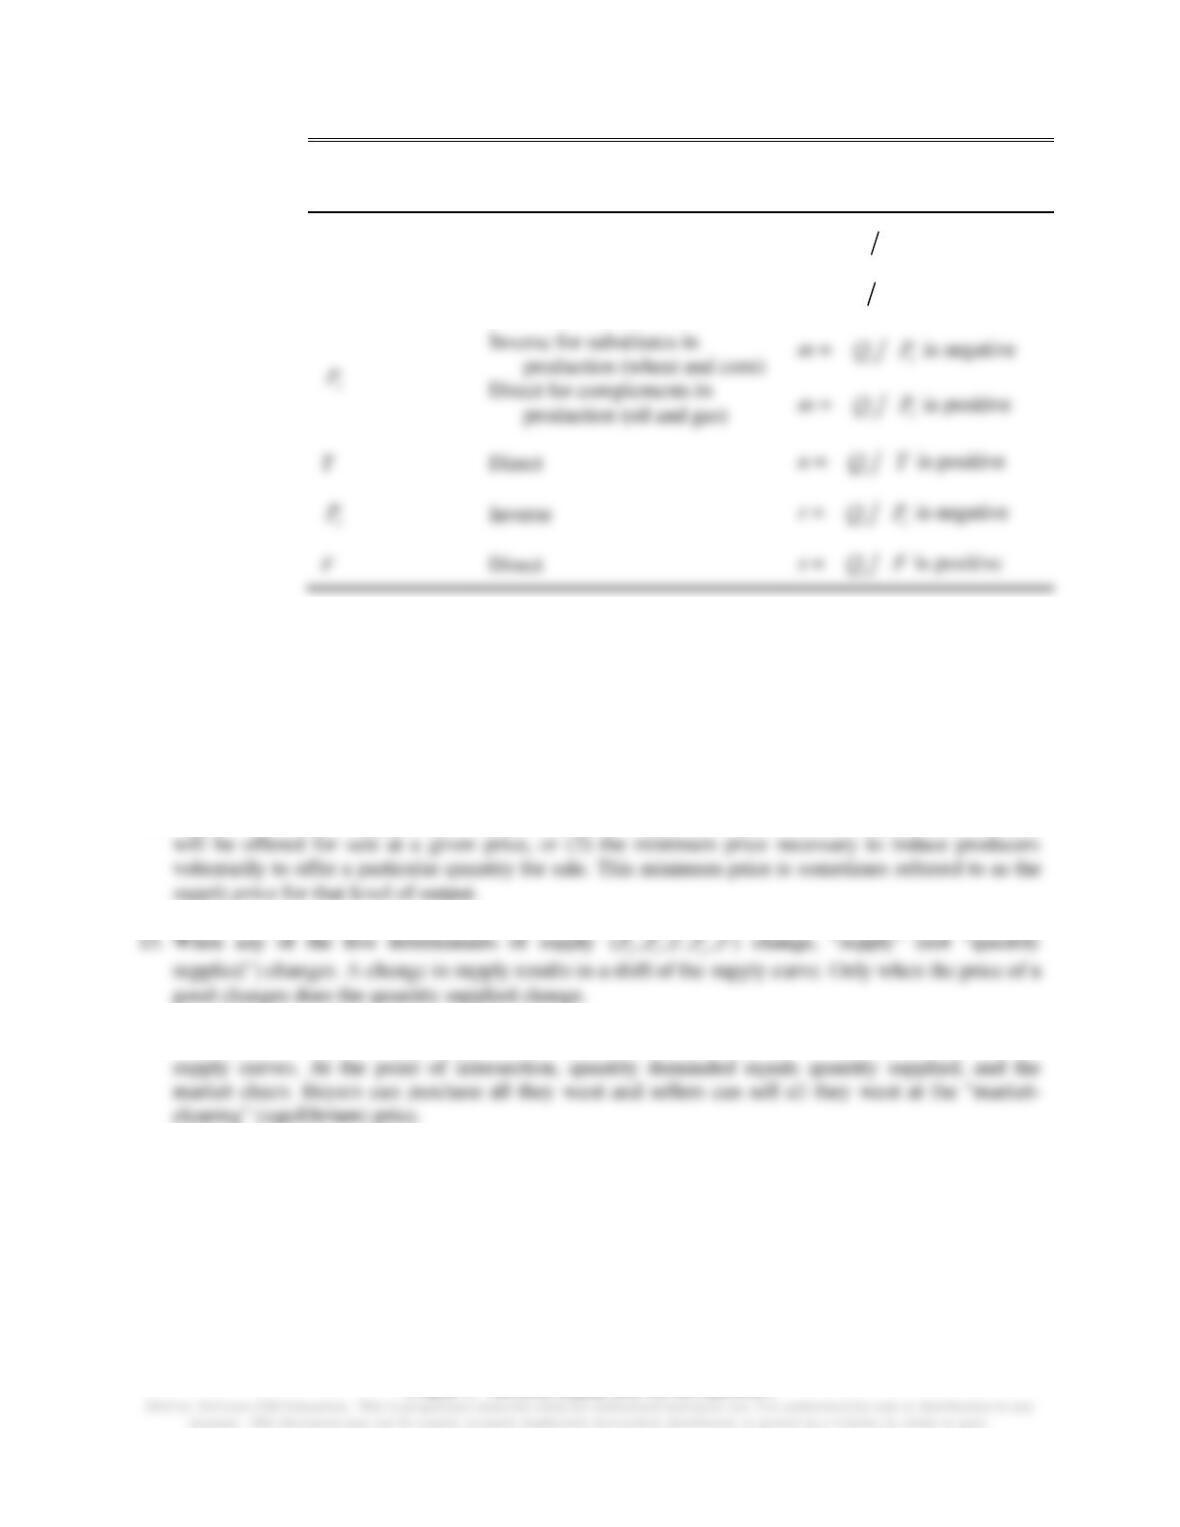
12. The general supply function can be expressed in linear functional form as
= + + + + + +
s I r e
Q h kP lP mP nT rP sF
where the slope parameters are interpreted as summarized in the following table:
Chapter 2: Demand, Supply, and Market Equilibrium
Variable
Relation to Quantity Supplied
Sign of Slope Parameter
P
Direct
k =
D D
s
Q P
is positive
PI
Inverse
l =
D D
s I
Q P
is negative
Direct for complements in
Inverse
D D
Q P
Direct
is positive
13. The direct supply function (or simply supply) gives the quantity supplied at various prices and may be
expressed mathematically as
( )
s
Q f P=
where
, , , ,
I r e
P P T P
and F are assumed to be constant and therefore do not appear as variables in the
supply function. An increase (decrease) in price causes an increase in quantity supplied, which is
represented by an upward (downward) movement along a given supply curve.
14. A point on the direct supply curve indicates either (1) the maximum amount of a good or service that
16. The equilibrium price and quantity in a market are determined by the intersection of demand and
17. Since the location of the demand and supply curves is determined by the five determinants of demand
and the five determinants of supply, a change in any one of these ten variables will result in a new
equilibrium point. The following figure summarizes the results when either demand or supply shifts
while the other curve remains constant.
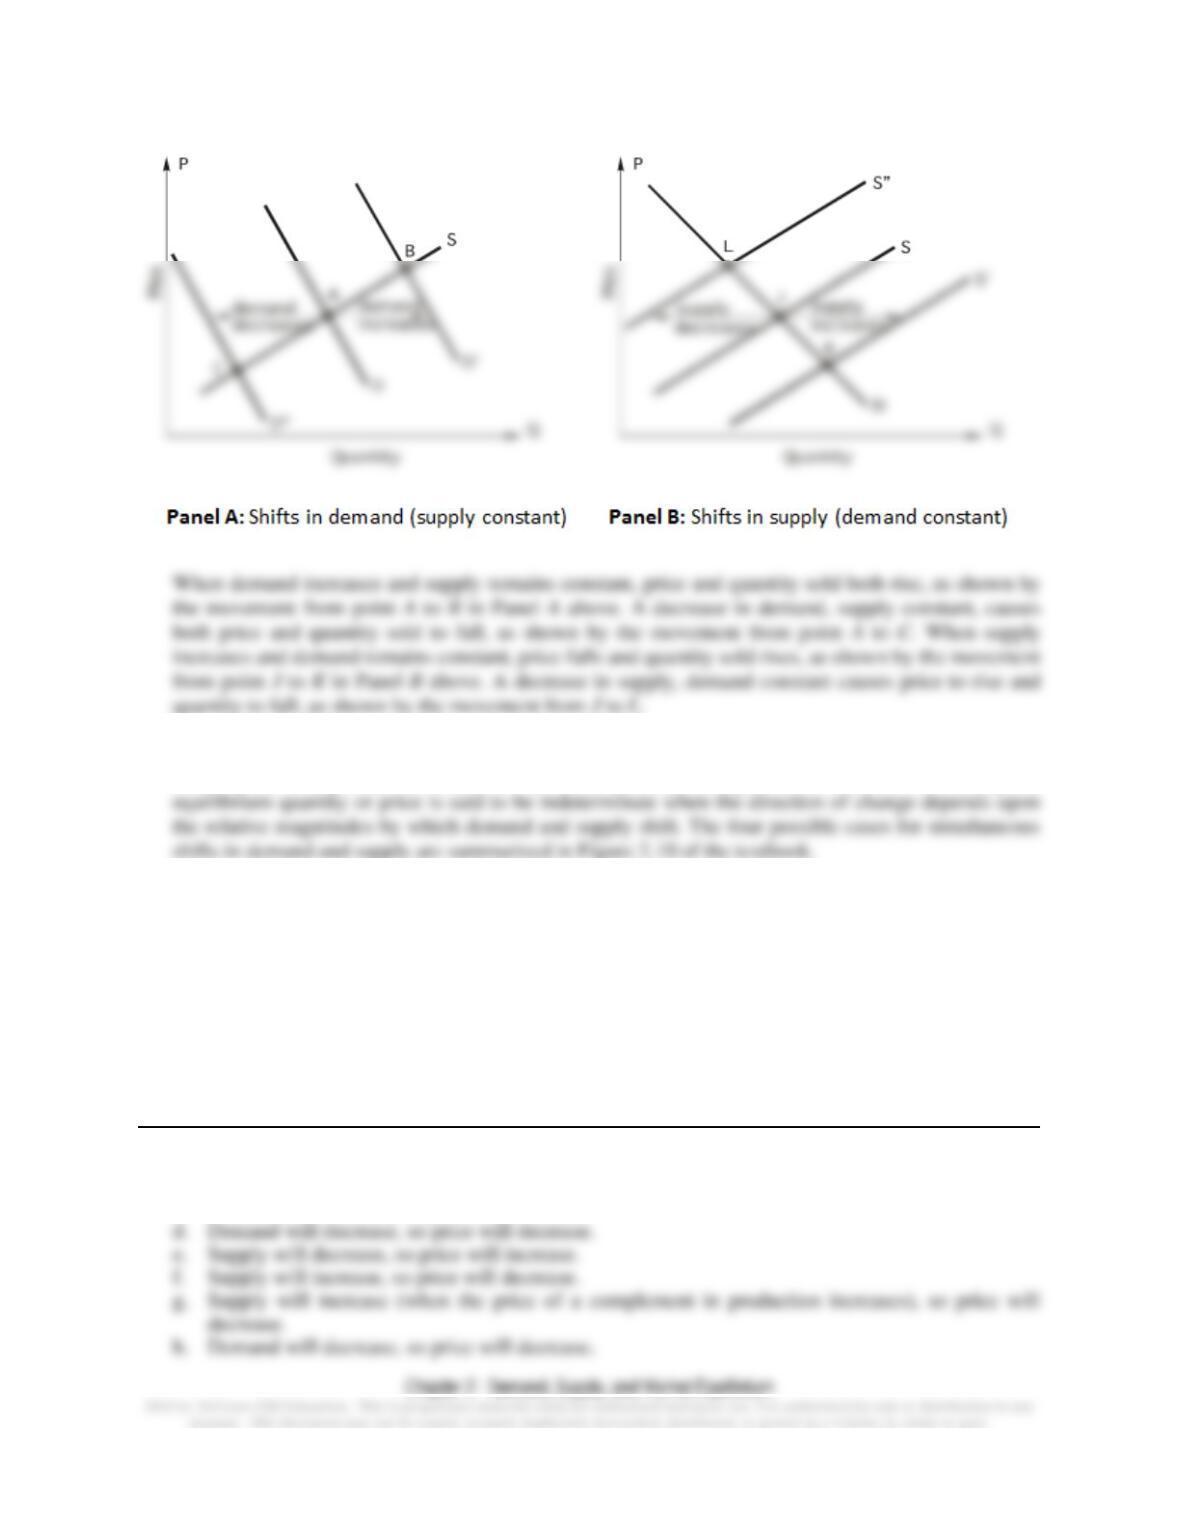
18. When both supply and demand shift simultaneously, it is possible to predict either the direction in
which price changes or the direction in which quantity changes, but not both. The change in
19. When government sets a ceiling price below the equilibrium price, a shortage results because
consumers wish to buy more of the good than producers are willing to sell at the ceiling price. If
government sets a floor price above the equilibrium price, a surplus results because producers offer
for sale more of the good than buyers wish to consume at the floor price.
Answers to Applied Problems
1. a. Demand will decrease, so price will decrease.
b. Supply will increase, so price will decrease.
c. Demand will increase, so price will increase.
2. a. Supply will decrease, so price will increase and output will decrease.
b. Supply will increase, so price will decrease and output will increase.
c. Demand will increase, so price will increase and output will increase.
3. a. An increase in demand for home heating oil causes demand for heating oil to shift rightward. In
the absence of price controls, no shortage occurs because market price is bid up to PB. An
increase in demand causes equilibrium price and quantity to rise.
4. a. No effect on demand (no shift)—just a movement up the demand.
b. Decrease demand for hotels.
c. Demand for rental cars decreases.
d. Supply of overnight mail decreases.
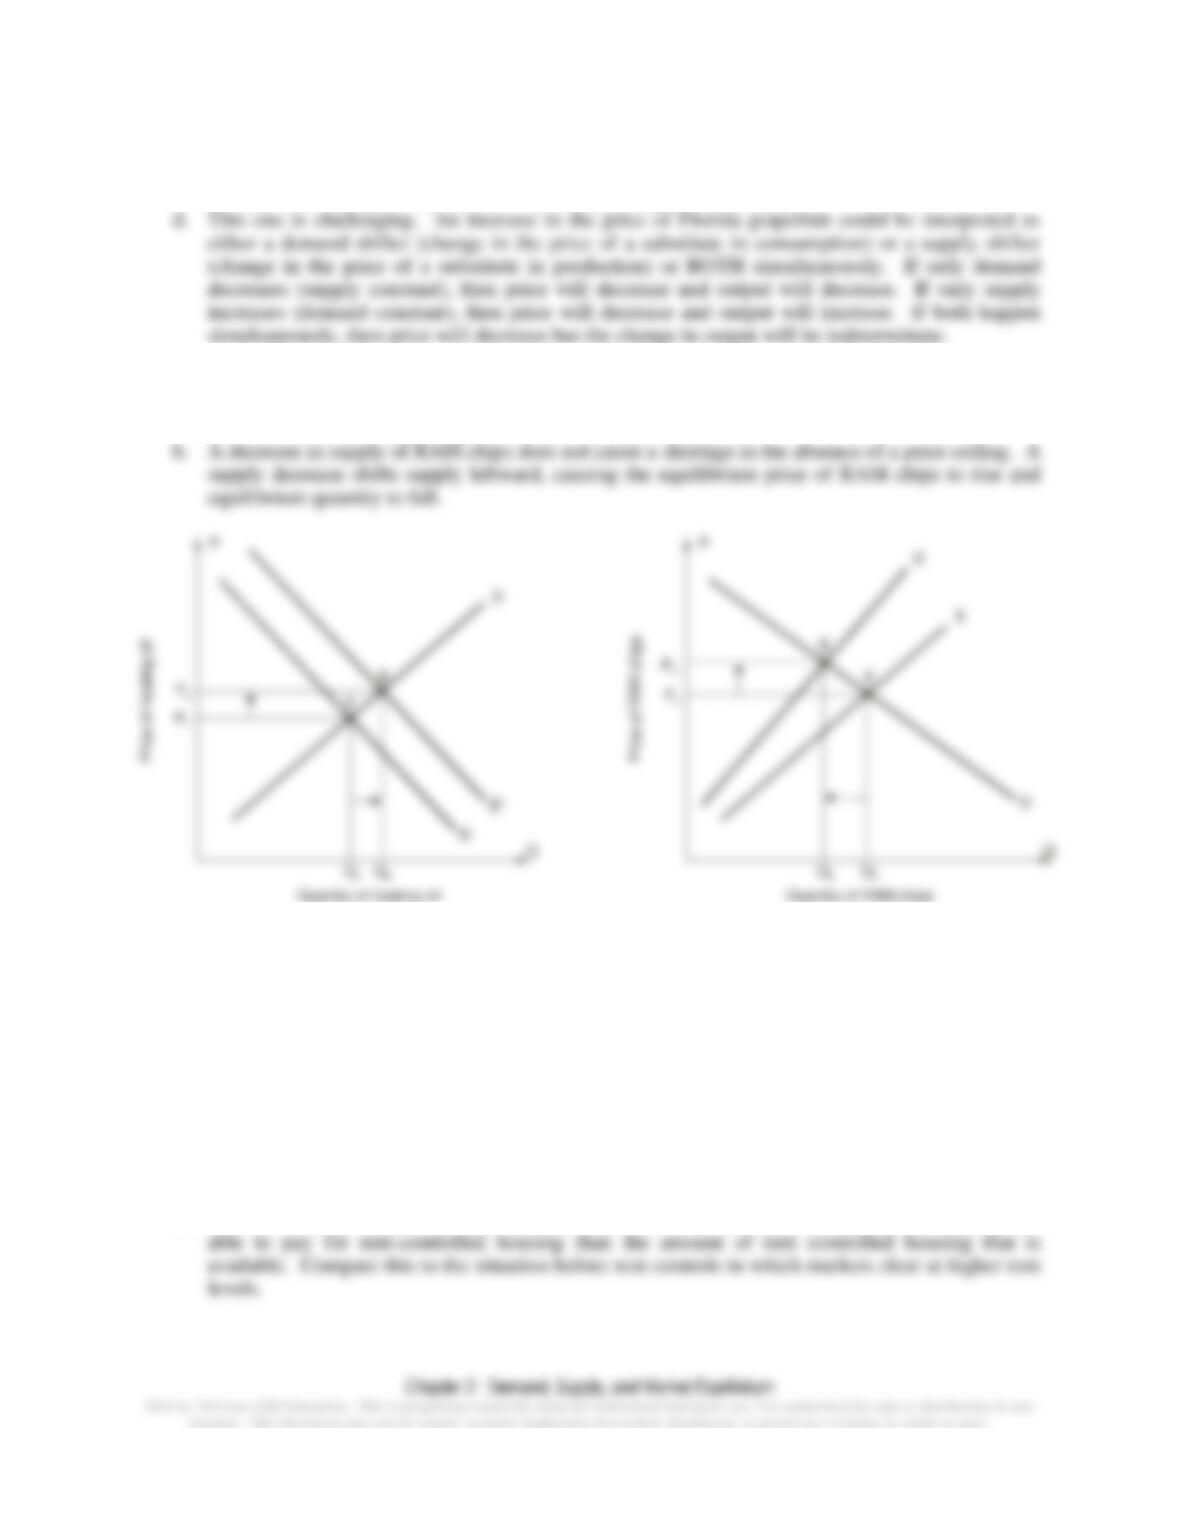
5. Construct a demand and supply diagram like Panel A of Figure 2.12.
a. Imposing rent controls creates a shortage of low-income housing, which decreases the quantity
supplied at the lower rent imposed by the controls compared to the amount of housing supplied at
the market-clearing (higher) rent level.
b. No, the shortage created by rent controls means that more low-income families are willing and
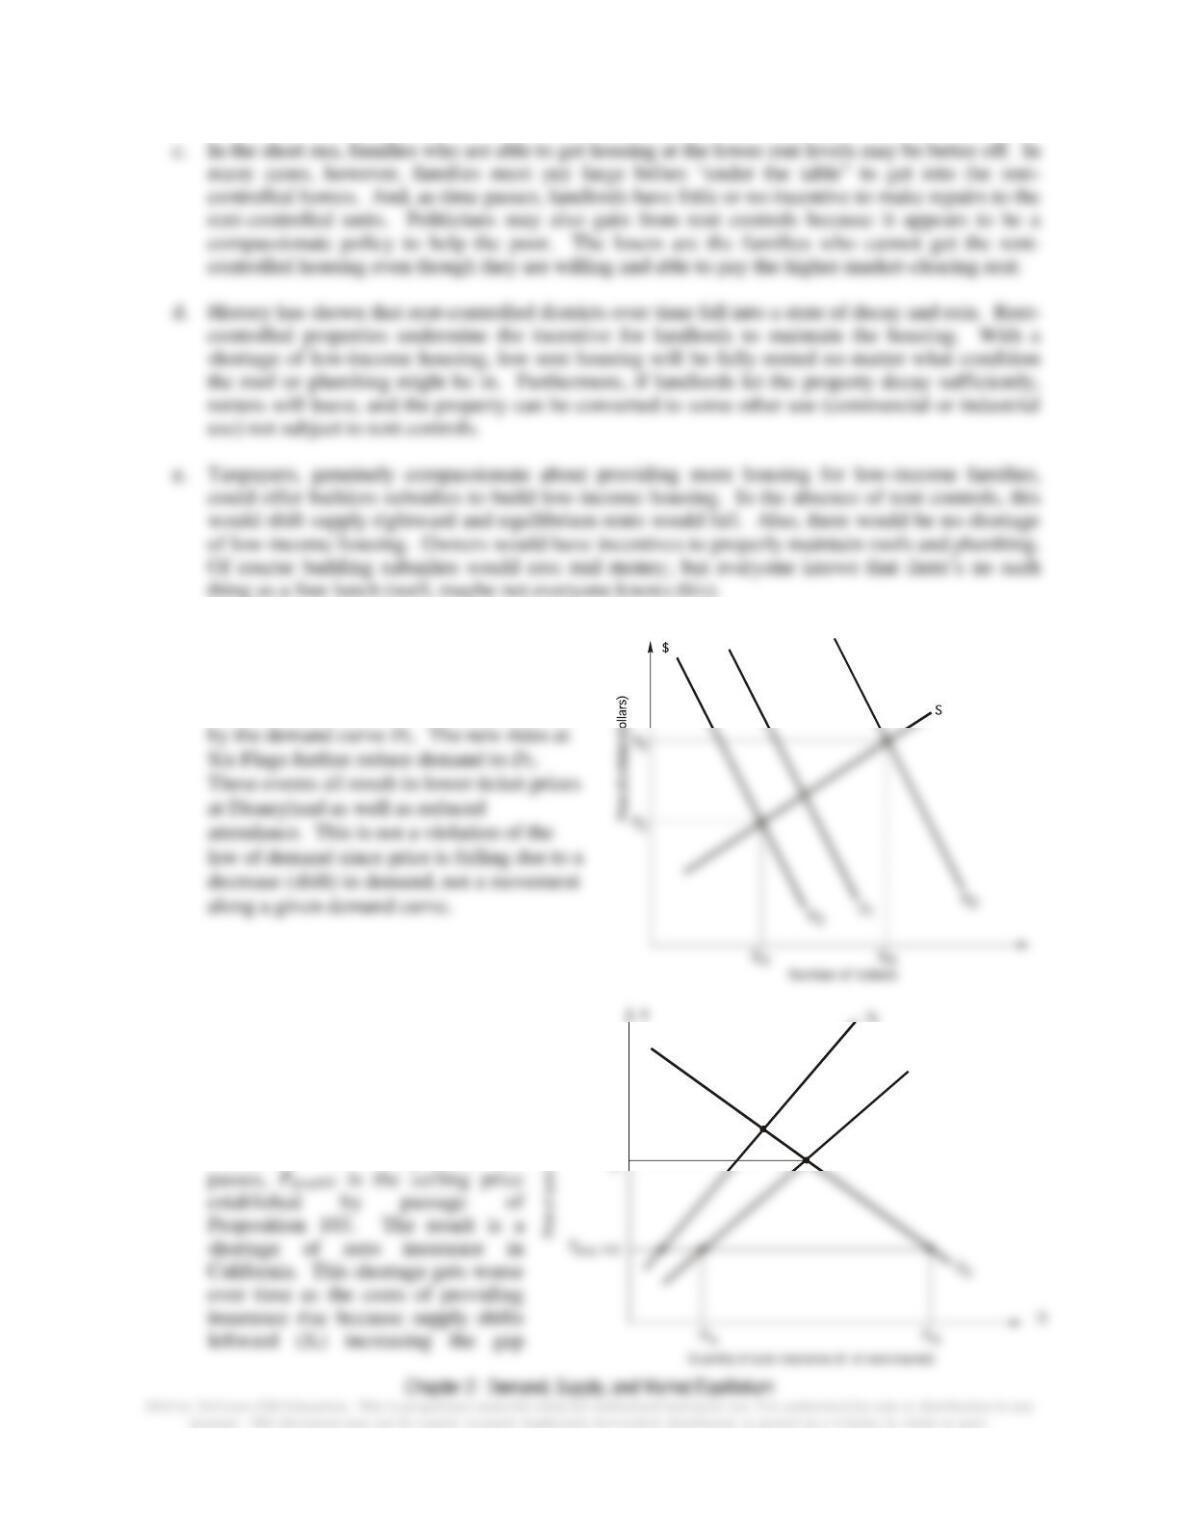
6. In the graph, let D0 be the initial demand for
tickets to Disneyland and S0 be the supply
of tickets to Disneyland. Slowing tourism
causes demand to decrease, as represented
7. In the graph, S0 and D0 are the
supply and demand curves for auto
insurance before Proposition 103 is
passed. PE is the price of auto
insurance. After Proposition 103
A
B
S0
PE
8. a. Increase in the price of a complement goods causes demand to shift leftward. Movie ticket prices
fall and ticket sales fall.
b. Decrease in the price of a substitute good causes demand to shift leftward. Movie ticket prices
fall and ticket sales fall.
9. a. The new process causes an increase in supply, shown as a rightward shift in the supply of crude
oil curve. The rightward shift in supply of crude oil does NOT cause a surplus because the
equilibrium price of crude oil falls until quantity demanded equals quantity supplied. The market
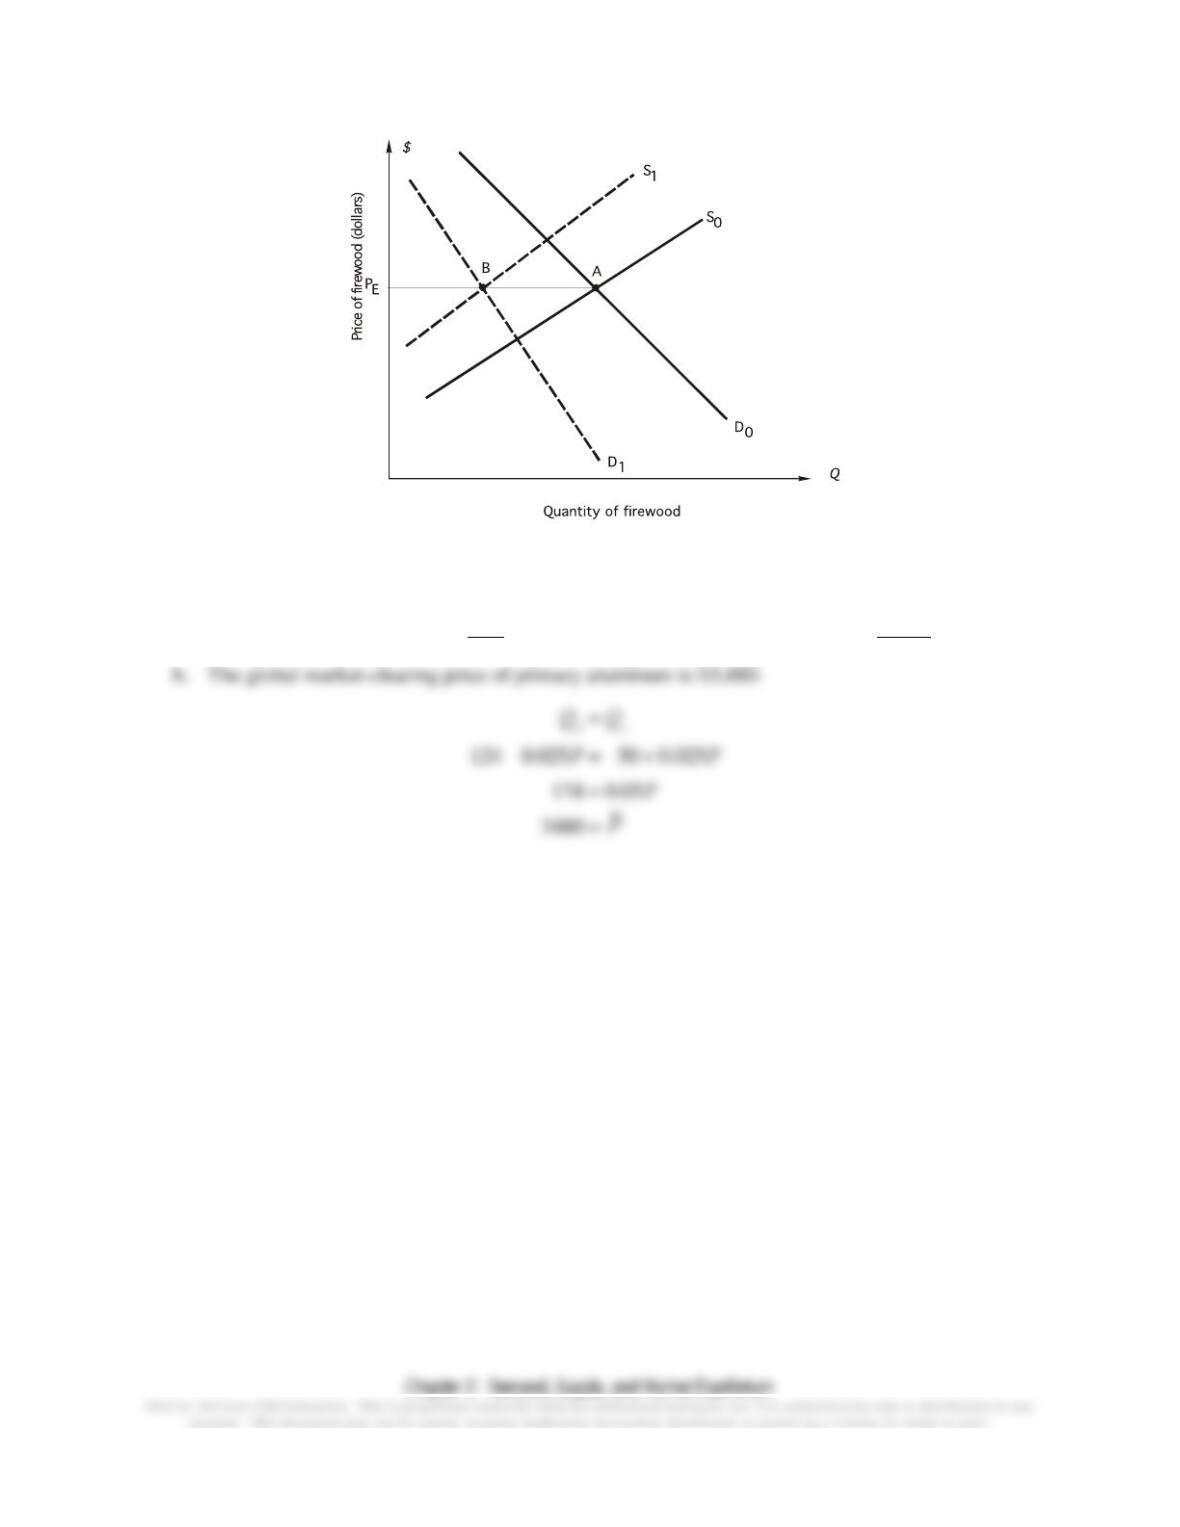
10. In the figure, the environmental curbs on burning wood causes supply to shift leftward from S0 to
S1. The substitution from burning wood to gas hearths is represented by the leftward shift in
demand from D0 to D1. Comparing initial equilibrium point A to B, the price of firewood has
remained unchanged while the quantity of firewood burned decreases.
11. Demand and supply both increase simultaneously. An increase in customers (N) causes demand
to shift rightward. An increase in the number of businesses in a market (F) causes supply to shift
12. a. At $3,600 per metric ton, quantity demanded is 34 metric tons per year (= 124 – 0.025 3,600)
and quantity supplied is 40 metric tones per year (= –50 + 0.025 3,600). So, the annual rate of
inventory growth is 6 tons per year (= 40 – 34), which corresponds 0.5 ton per month.