
15
w
WHAT’S NEW IN THE SEVENTH EDITION:
There is a new
In the News
feature on “Actual Economists and Virtual Realities.” Figure A-1 has been
updated.
LEARNING OBJECTIVES:
By the end of this chapter, students should understand:
➢ how economists apply the methods of science.
➢ how assumptions and models can shed light on the world.
➢ two simple models—the circular flow and the production possibilities frontier.
➢ the difference between microeconomics and macroeconomics.
➢ the difference between positive and normative statements.
➢ the role of economists in making policy.
➢ why economists sometimes disagree with one another.
CONTEXT AND PURPOSE:
Chapter 2 is the second chapter in a three chapter section that serves as the introduction of the text.
Chapter 1 introduced ten principles of economics that will be revisited throughout the text. Chapter 2
develops how economists approach problems while Chapter 3 will explain how individuals and countries
gain from trade.
The purpose of Chapter 2 is to familiarize students with how economists approach economic
problems. With practice, they will learn how to approach similar problems in this dispassionate systematic
2
THINKING LIKE AN ECONOMIST
16 ❖ Chapter 2/Thinking Like an Economist
KEY POINTS:
• Economists try to address their subject with a scientist’s objectivity. Like all scientists, they make
appropriate assumptions and build simplified models to understand the world around them. Two
simple economic models are the circular-flow diagram and the production possibilities frontier.
• The field of economics is divided into two subfields: microeconomics and macroeconomics.
Microeconomists study decision making by households and firms and the interaction among
households and firms in the marketplace. Macroeconomists study the forces and trends that affect
the economy as a whole.
• A positive statement is an assertion about how the world
is
. A normative statement is an assertion
about how the world
ought to be
. When economists make normative statements, they are acting
more as policy advisers than as scientists.
• Economists who advise policymakers sometimes offer conflicting advice either because of differences
in scientific judgments or because of differences in values. At other times, economists are united in
the advice they offer, but policymakers may choose to ignore the advice because of the many forces
and constraints imposed by the political process.
CHAPTER OUTLINE:
I. The Economist as Scientist
A. Economists Follow the Scientific Method.
1. Observations help us to develop theory.
2. Data can be collected and analyzed to evaluate theories.
B. Assumptions Make the World Easier to Understand.
1. Example: to understand international trade, it may be helpful to start out assuming that
there are only two countries in the world producing only two goods. Once we understand
how trade would work between these two countries, we can extend our analysis to a greater
number of countries and goods.
2. One important role of a scientist is to understand which assumptions one should make.
C. Economists Use Economic Models to Explain the World around Us.
Chapter 2/Thinking Like an Economist ❖ 17
1. Most economic models are composed of diagrams and equations.
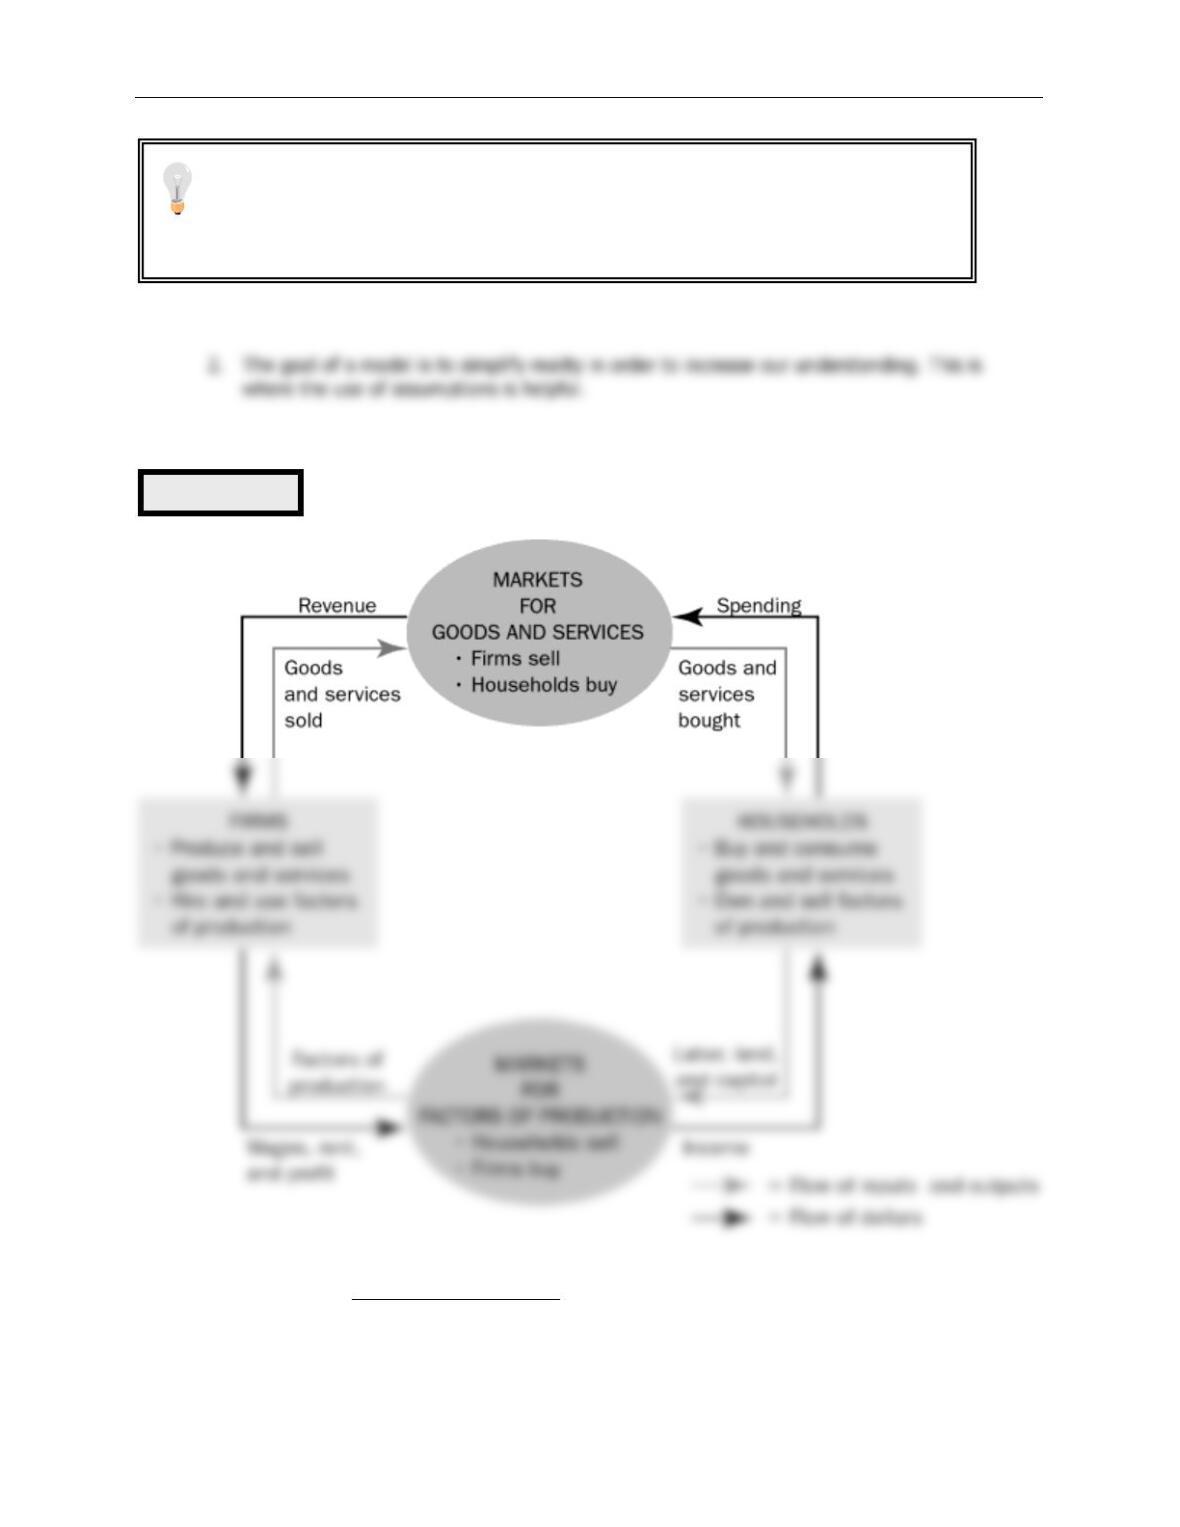
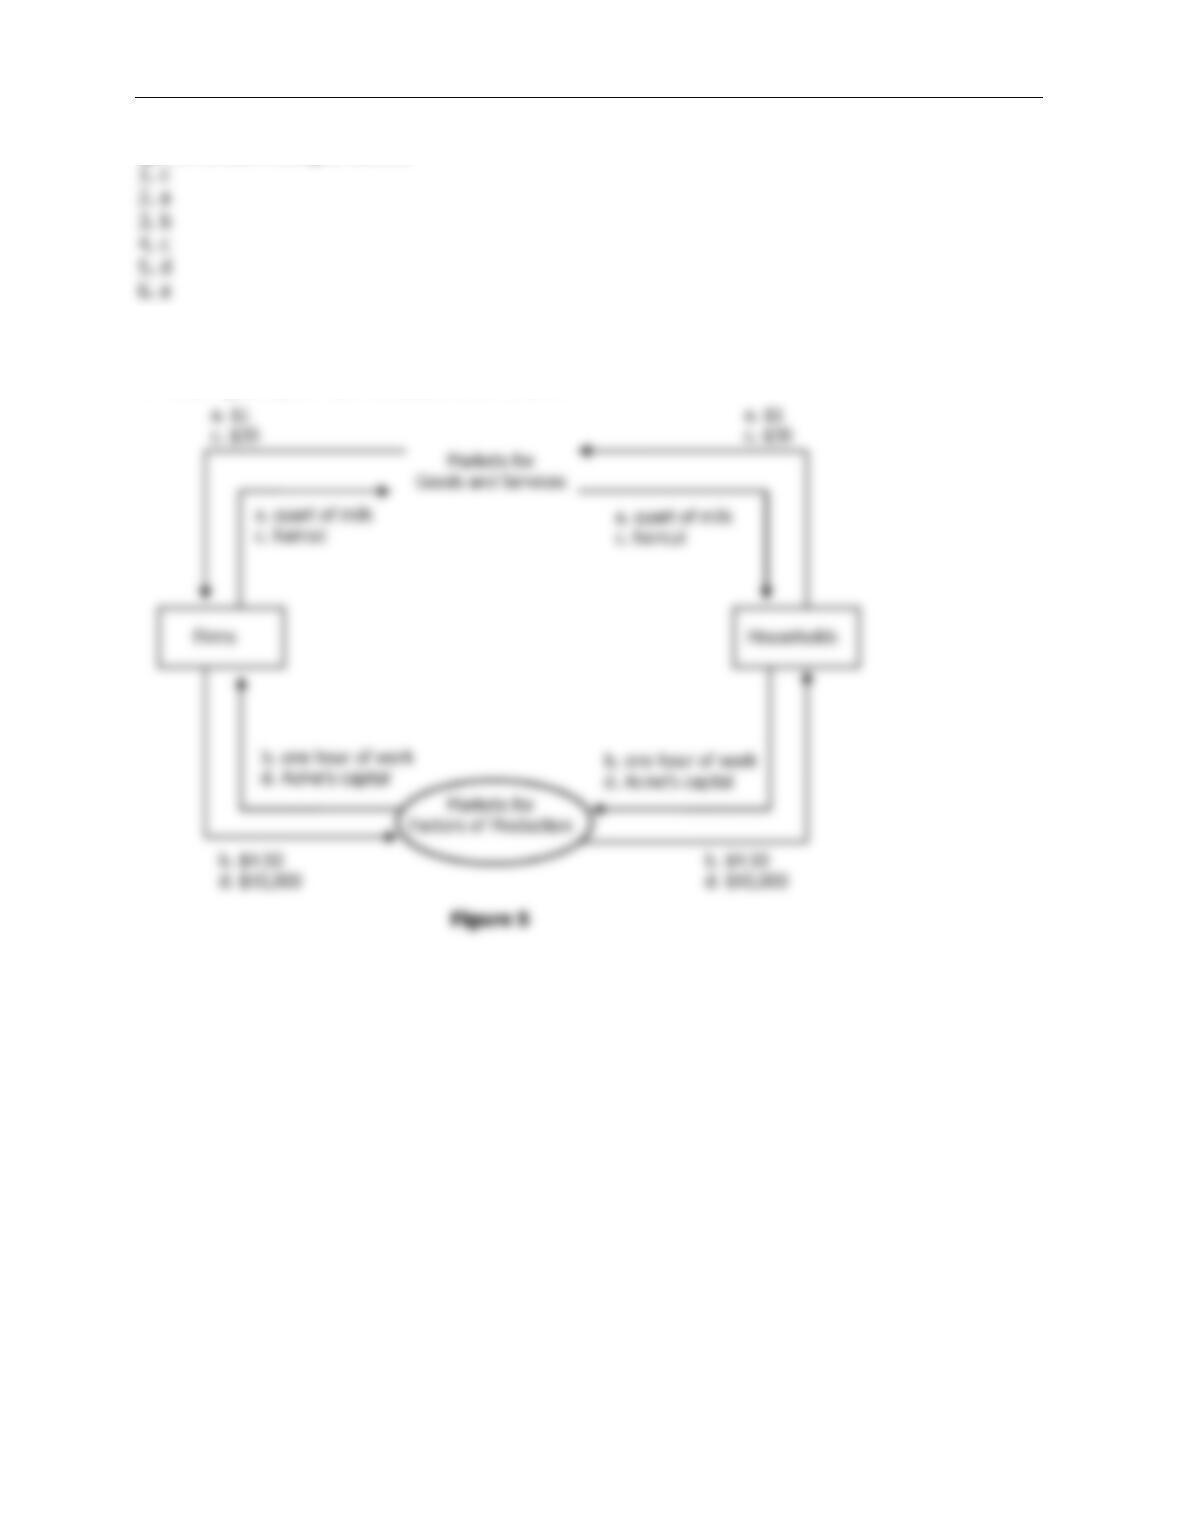
D. Our First Model: The Circular Flow Diagram
1. Definition of circular-flow diagram: a visual model of the economy that shows how
dollars flow through markets among households and firms.
Figure 1
To illustrate to the class how simple but unrealistic models can be useful, bring a
road map to class. Point out how unrealistic it is. For example, it does not show
where all of the stop signs, gas stations, or restaurants are located. It assumes that
the earth is flat and two-dimensional. But, despite these simplifications, a map
usually helps travelers get from one place to another. Thus, it is a good model.

18 ❖ Chapter 2/Thinking Like an Economist
2. This diagram is a very simple model of the economy. Note that it ignores the roles of
government and international trade.
a. There are two decision makers in the model: households and firms.
b. There are two markets: the market for goods and services and the market for factors of
production.
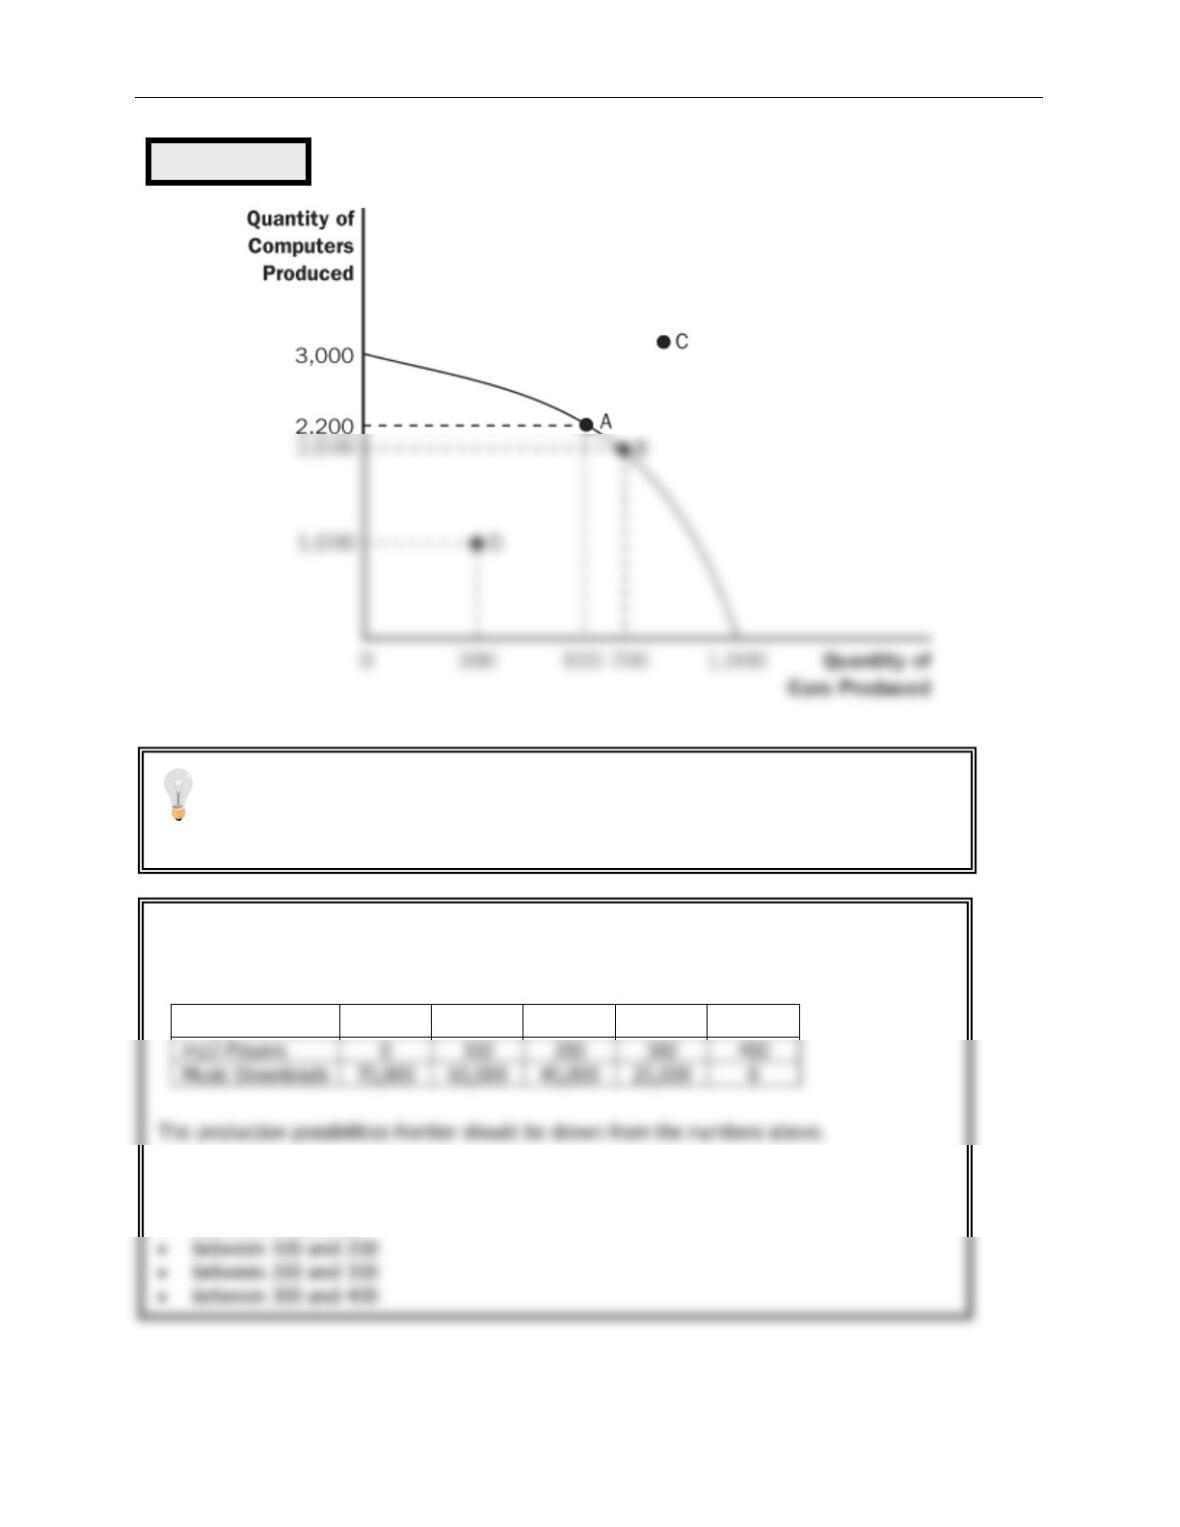
E. Our Second Model: The Production Possibilities Frontier
2. Example: an economy that produces two goods, cars and computers.
a. If all resources are devoted to producing cars, the economy would produce 1,000 cars
and zero computers.
Spend more time with this model than you think is necessary. Be aware that the
math and graphing skills of many of your students will be limited. It is important for
the students to feel confident with this first graphical and mathematical model. Be
deliberate with every point. If you lose them with this model, they may be gone for
the rest of the course.
Chapter 2/Thinking Like an Economist ❖ 19
ALTERNATIVE CLASSROOM EXAMPLE:
A small country produces two goods: mp3 players and music downloads. Points on a
production possibilities frontier can be shown in a table or a graph:
A
B
C
D
E
Students should be asked to calculate the opportunity cost of increasing the number of mp3
players produced by 100:
• between 0 and 100
Points inside the curve, points on the curve, and points outside of the curve can also be
discussed.
You may want to include time dimensions for variables. This will help students to
realize that a new production possibilities frontier occurs for each period. Thus, the
axes show the levels of output per period.
Figure 2
20 ❖ Chapter 2/Thinking Like an Economist
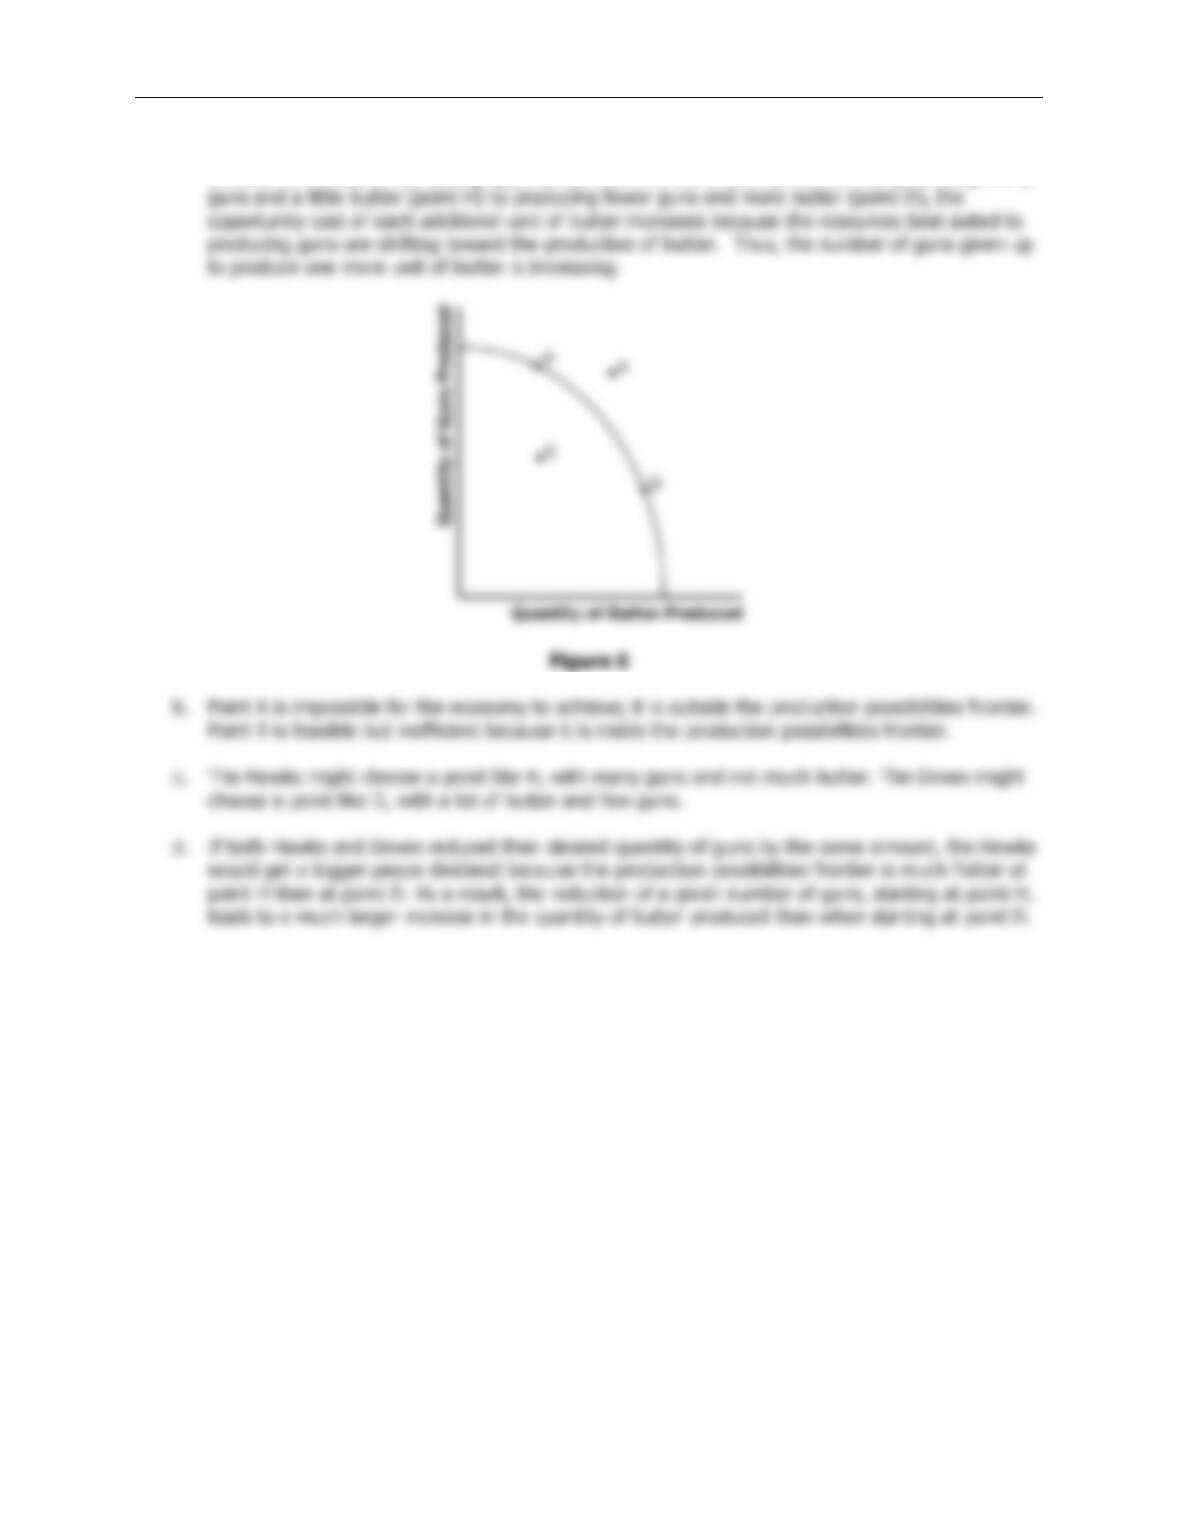
3. Because resources are scarce, not every combination of computers and cars is possible.
Production at a point outside of the curve (such as C) is not possible given the economy’s
current level of resources and technology.
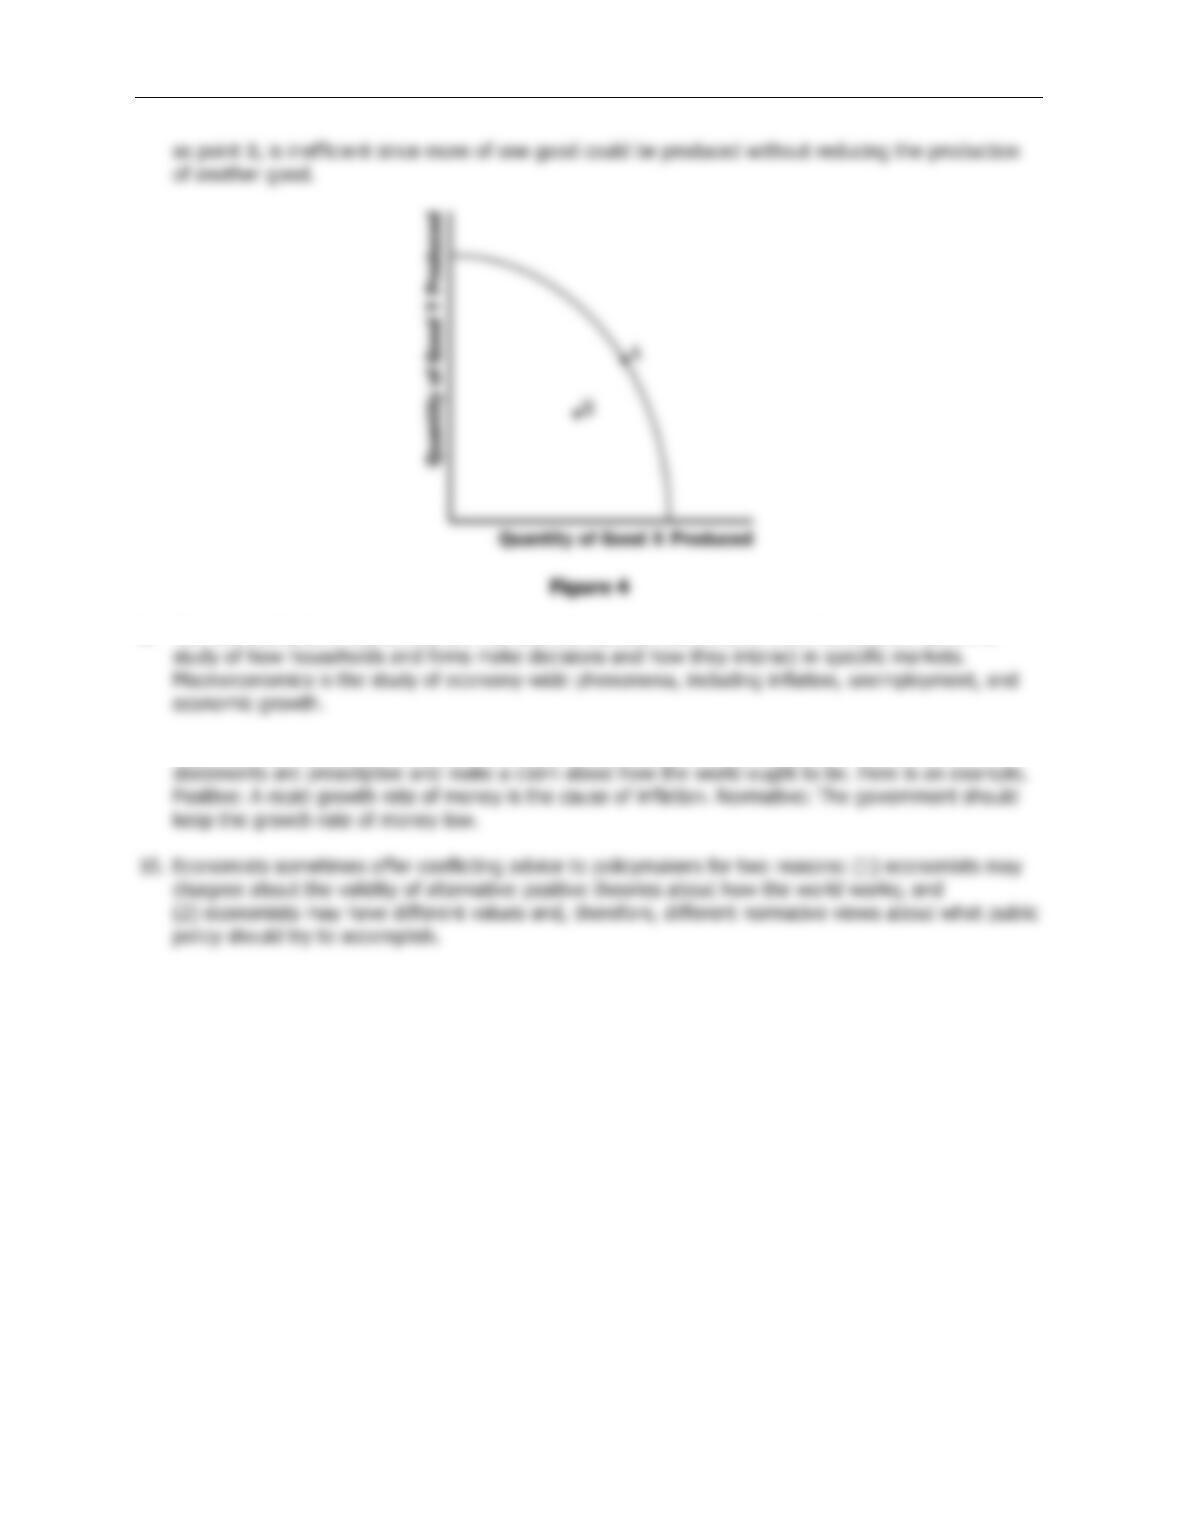
5. Production at a point inside the curve (such as D) is inefficient.
a. This means that the economy is producing less than it can from the resources it has
available.
b. If the source of the inefficiency is eliminated, the economy can increase its production of
both goods.
6. The production possibilities frontier reveals Principle #1: People face trade-offs.
a. Suppose the economy is currently producing 600 cars and 2,200 computers.
b. To increase the production of cars to 700, the production of computers must fall to
2,000.
7. Principle #2 is also shown on the production possibilities frontier: The cost of something is
what you give up to get it (opportunity cost).
8. The opportunity cost of a car depends on the number of cars and computers currently
produced by the economy.
a. The opportunity cost of a car is high when the economy is producing many cars and few
computers.
b. The opportunity cost of a car is low when the economy is producing few cars and many
computers.
It is useful to point out that the production possibilities frontier depends on two
things: the availability of resources and the level of technology.

Chapter 2/Thinking Like an Economist ❖ 21
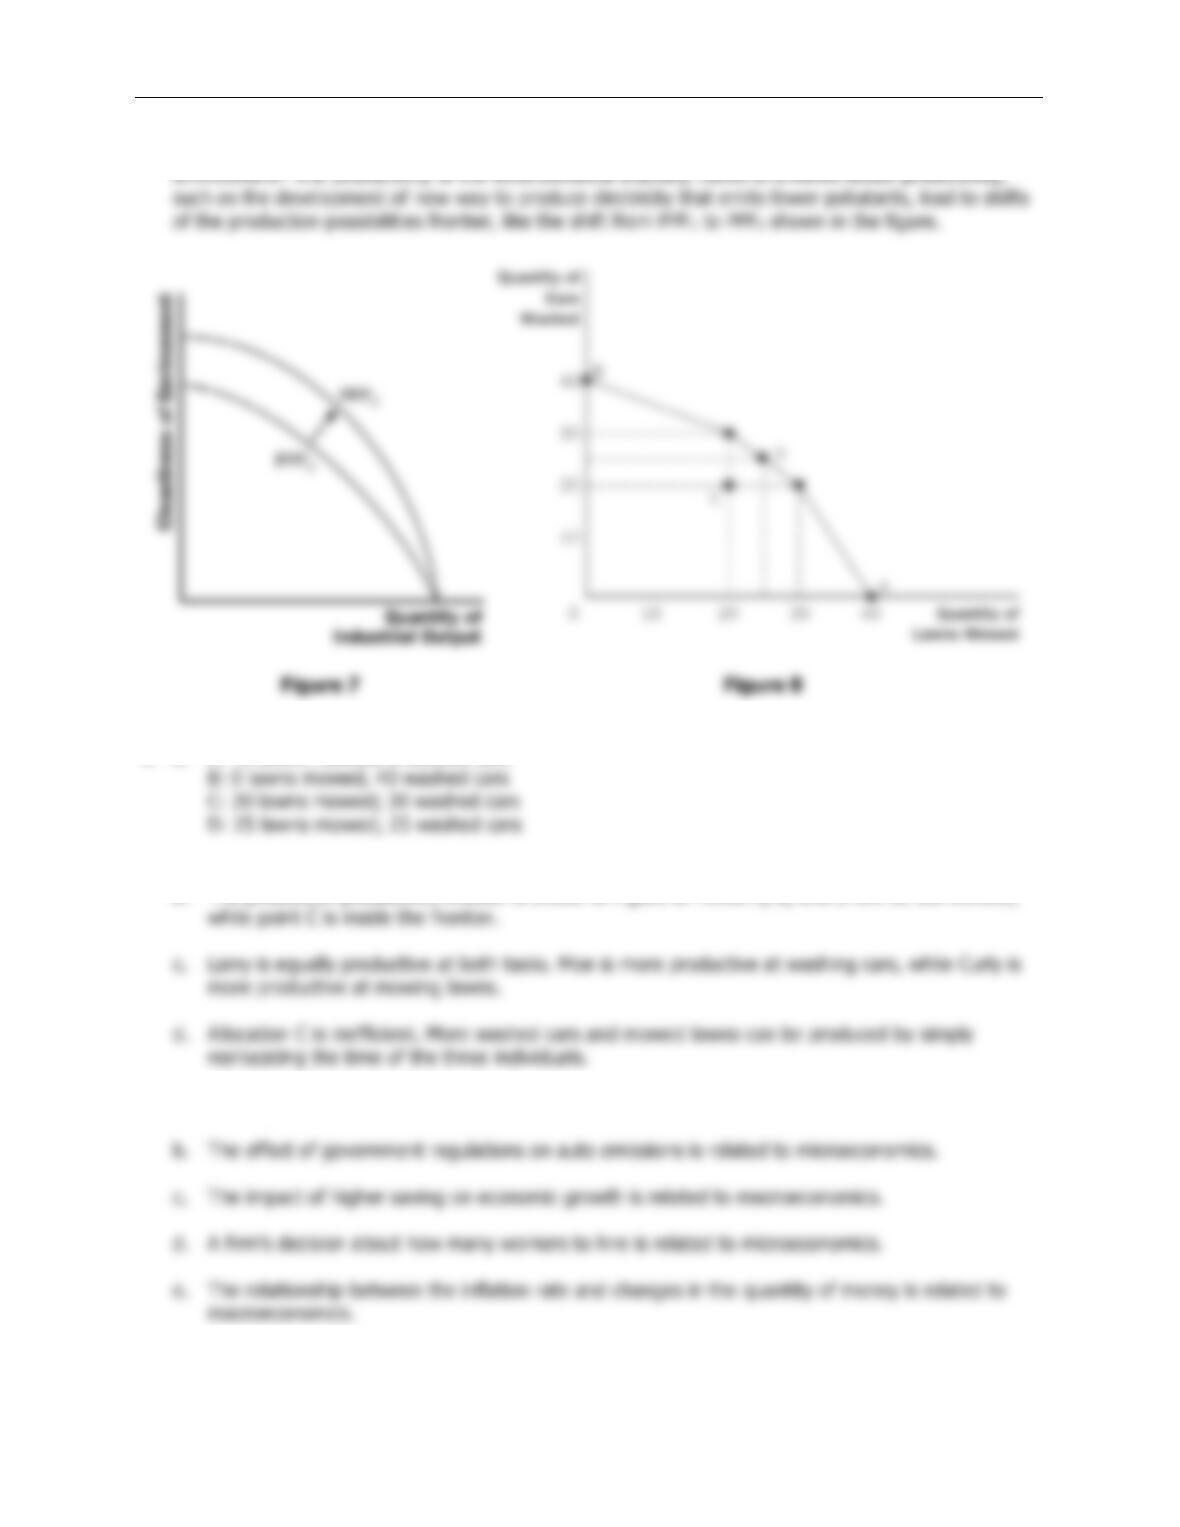
10. The production possibilities frontier can shift if resource availability or technology changes.
Economic growth can be illustrated by an outward shift of the production possibilities
frontier.
F. Microeconomics and Macroeconomics
1. Economics is studied on various levels.
a. Definition of microeconomics: the study of how households and firms make
decisions and how they interact in markets.
2. Microeconomics and macroeconomics are closely intertwined because changes in the overall
economy arise from the decisions of individual households and firms.
You may also want to teach students about budget constraints at this time (call them
“consumption possibilities frontiers”). This reinforces the idea of opportunity cost,
and allows them to see how opportunity cost can be measured by the slope. Also, it
will introduce students to the use of straight-line production possibilities frontiers
(which appear in Chapter 3). However, be careful if you choose to do this as students
often find the difference between straight-line and concave production possibilities
frontiers challenging.
Figure 3
ALTERNATIVE CLASSROOM EXAMPLE:
Ivan receives an allowance from his parents of $20 each week. He spends his entire
allowance on two goods: ice cream cones (which cost $2 each) and tickets to the movies
(which cost $10 each).
Students should be asked to calculate the opportunity cost of one movie and the opportunity
cost of one ice cream cone.
Ivan’s consumption possibilities frontier (budget constraint) can be drawn. It should be noted
that the slope is equal to the opportunity cost and is constant because the opportunity cost is
constant.
Ask students what would happen to the consumption possibilities frontier if Ivan’s allowance
changes or if the price of ice cream cones or movies changes.
Be aware that students often have trouble understanding why opportunity costs rise

22 ❖ Chapter 2/Thinking Like an Economist
3. Because microeconomics and macroeconomics address different questions, each field has its
own set of models which are often taught in separate courses.
II. The Economist as Policy Adviser
A. Positive versus Normative Analysis
1. Example of a discussion of minimum-wage laws: Polly says, “Minimum-wage laws cause
unemployment.” Norma says, “The government should raise the minimum wage.”
4. Positive statements can be evaluated by examining data, while normative statements involve
personal viewpoints.
5. Positive views about how the world works affect normative views about which policies are
desirable.
6. Much of economics is positive; it tries to explain how the economy works. But those who use
economics often have goals that are normative. They want to understand how to improve
the economy.
B. Economists in Washington
1. Economists are aware that trade-offs are involved in most policy decisions.
2. The president receives advice from the Council of Economic Advisers (created in 1946).
C. Why Economists’ Advice Is Not Always Followed
Use several examples to illustrate the differences between positive and normative
statements and stimulate classroom discussion. Possible examples include the
minimum wage, budget deficits, tobacco taxes, legalization of marijuana, and seat–
belt laws.
Have students bring in newspaper articles and in groups, identify each statement in
an editorial paragraph as being a positive or normative statement. Discuss the
differences among news stories, editorials, and blogs and the analogy to economists
as scientists and as policy advisers.

Chapter 2/Thinking Like an Economist ❖ 23
2. Economists offer crucial input into the policy process, but their advice is only part of the
advice received by policymakers.
III. Why Economists Disagree
A. Differences in Scientific Judgments
1. Economists may disagree about the validity of alternative positive theories or about the size
of the effects of changes in the economy on the behavior of households and firms.
B. Differences in Values
C. Perception versus Reality
1. While it seems as if economists do not agree on much, this is in fact not true. Table 1
contains 20 propositions that are endorsed by a majority of economists.
2. Almost all economists believe that rent control adversely affects the availability and quality of
housing.
3. Most economists also oppose barriers to trade.
IV.
In the News: Actual Economists and Virtual Realities
A. Professional Economists have begun working in the video game industry as consultants to
developers and to experiment with policy options.
V. Appendix—Graphing: A Brief Review
Table 1
Emphasize that there is more agreement among economists than most people think.
The reason for this is probably that the things that are generally agreed upon are
boring to most noneconomists.
Many instructors may be unaware of how much trouble beginning students have
grasping the most basic graphs. It is important for instructors to make sure that
students are comfortable with these techniques.

24 ❖ Chapter 2/Thinking Like an Economist
A. Graphs of a Single Variable
1. Pie Chart
B. Graphs of Two Variables: The Coordinate System
1. Economists are often concerned with relationships between two or more variables.
2. Ordered pairs of numbers can be graphed on a two-dimensional grid.
a. The first number in the ordered pair is the
x
-coordinate and tells us the horizontal
location of the point.
b. The second number in the ordered pair is the
y
-coordinate and tells us the vertical
location of the point.
3. The point with both an
x
-coordinate and
y
-coordinate of zero is called the origin.
4. Two variables that increase or decrease together have a positive correlation.
C. Curves in the Coordinate System
1. Often, economists want to show how one variable affects another, holding all other variables
constant.
When reviewing graphing with the students, it is best to bring students to the board
to be “recorders” of what the other students say as you give a series of instructions
like “Draw a pie chart” or ask questions like “How tall should the bar be if the value is
120 million?” Do not make the student at the board responsible for the answer.
Instead he should be simply recording what the other students say. Students are
often uneasy about graphing at first and need to gain confidence.
Figure A-1
Figure A-2
Table A-1
Figure A-3
Chapter 2/Thinking Like an Economist ❖ 25
a. An example of this is a demand curve.
b. The demand curve shows how the quantity of a good a consumer wants to purchase
varies as its price varies, holding everything else (such as income) constant.
d. A simple way to tell if it is necessary to shift the curve is to look at the axes. When a
variable that is not named on either axis changes, the curve shifts.
D. Slope
1. We may want to ask how strongly a consumer reacts if the price of a product changes.
2. The slope of a line is the ratio of the vertical distance covered to the horizontal distance
3. A small slope (in absolute value) means that the demand curve is relatively flat; a large slope
(in absolute value) means that the demand curve is relatively steep.
E. Cause and Effect
1. Economists often make statements suggesting that a change in Variable A causes a change
in Variable B.
a. If Variables A and B both change at the same time, we may conclude that the change in
Variable A caused the change in Variable B.
Figure A-4
Figure A-5
Figure A-6

26 ❖ Chapter 2/Thinking Like an Economist
b. But, if Variable C has also changed, it is entirely possible that Variable C is responsible for
the change in Variable B.
4. Another problem is reverse causality.
a. If Variable A and Variable B both change at the same time, we may believe that the
change in Variable A led to the change in Variable B.
b. However, it is entirely possible that the change in Variable B led to the change in Variable
A.
SOLUTIONS TO TEXT PROBLEMS:
Quick Quizzes
1. Economics is like a science because economists devise theories, collect data, and analyze the data in
an attempt to verify or refute their theories. In other words, economics is based on the scientific
method.
Figure A-7
There are two very good examples in the text that you should use in class. To
discuss the omitted variable problem, point out to students that a rise in the sales of
cigarette lighters is positively related to the number of individuals diagnosed with
lung cancer. To discuss reverse causality, show that an increase in minivan sales is
followed by an increase in birth rates.
Chapter 2/Thinking Like an Economist ❖ 27
Microeconomics is the study of how households and firms make decisions and how they interact in
markets. Macroeconomics is the study of economy-wide phenomena, including inflation,
unemployment, and economic growth.
2. An example of a positive statement is “a higher price of coffee causes me to buy more tea.” It is a
positive statement because it is a claim that describes the world as it is. An example of a normative
28 ❖ Chapter 2/Thinking Like an Economist
3. Economic advisers to the president might disagree about a question of policy because of differences
in scientific judgments or differences in values.
Questions for Review
1. Economics is like a science because economists use the scientific method. They devise theories,
4. There are many possible answers.
5. There are many possible answers.
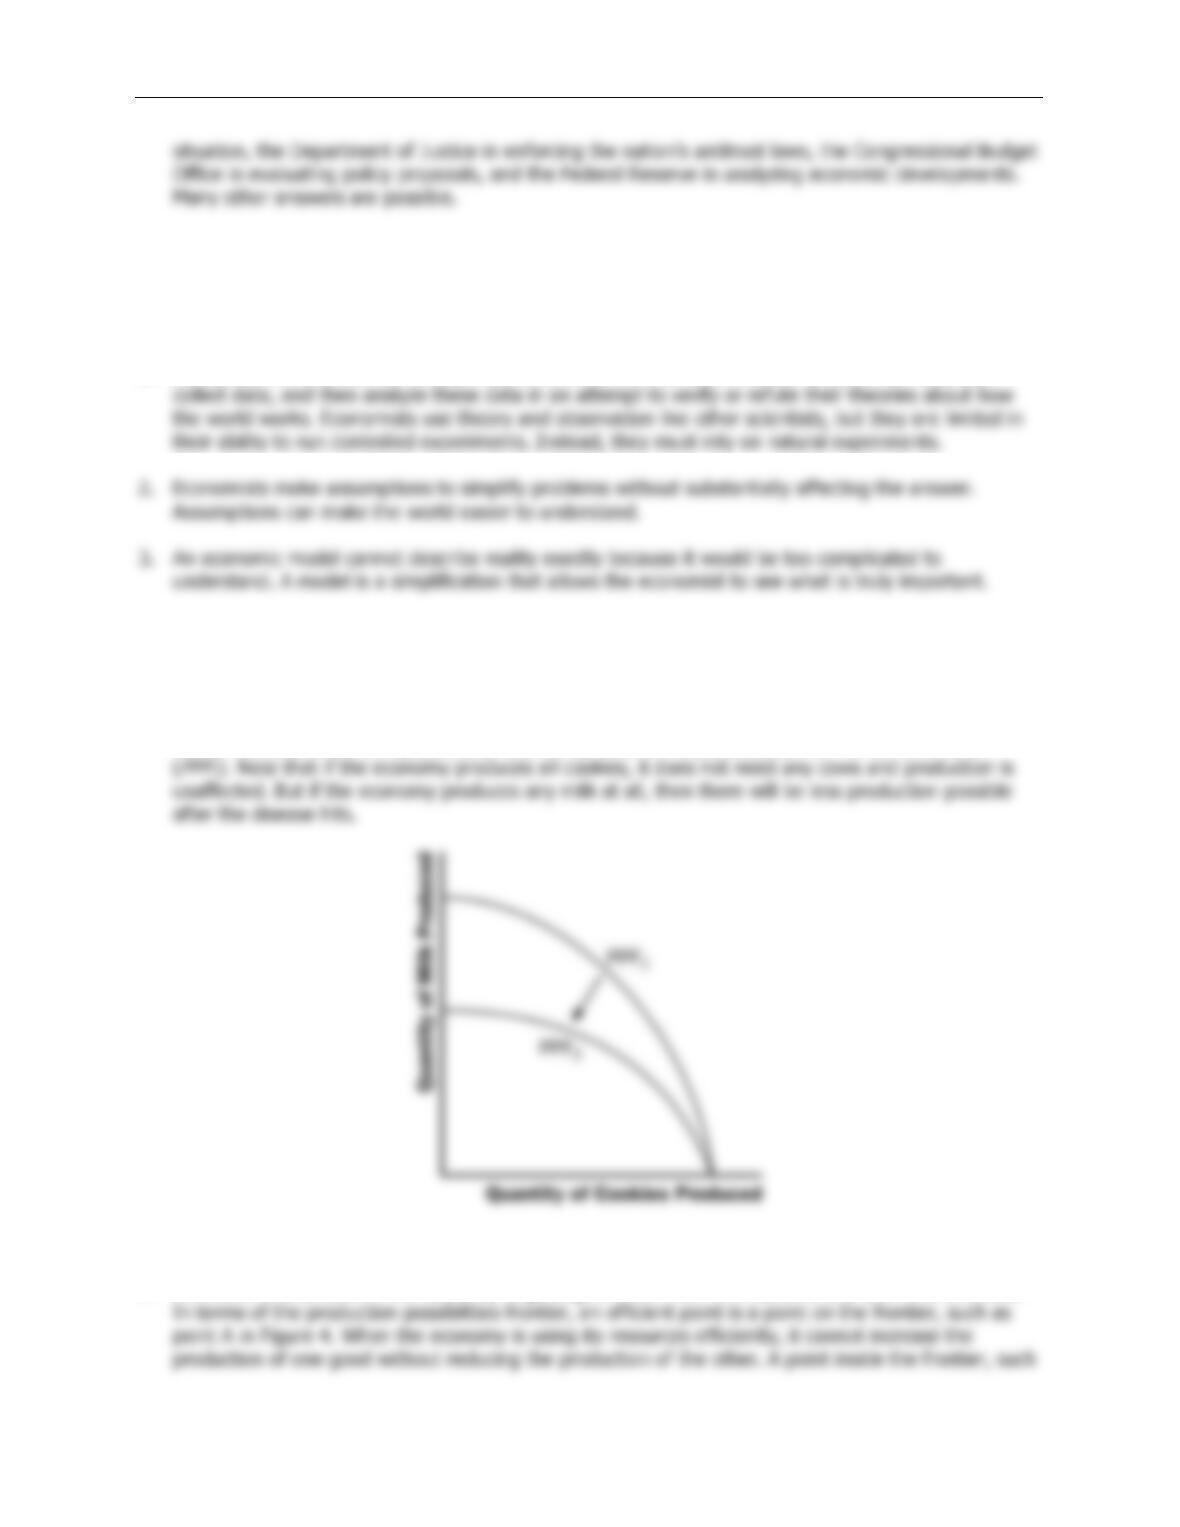
6. Figure 3 shows a production possibilities frontier between milk and cookies (
PPF
1). If a disease kills
half of the economy’s cow population, less milk production is possible, so the
PPF
shifts inward
Figure 3
7. An outcome is efficient if the economy is getting all it can from the scarce resources it has available.
Chapter 2/Thinking Like an Economist ❖ 29
8. The two subfields in economics are microeconomics and macroeconomics. Microeconomics is the
9. Positive statements are descriptive and make a claim about how the world is, while normative
30 ❖ Chapter 2/Thinking Like an Economist
Quick Check Multiple Choice
Problems and Applications
1. See Figure 5; the four transactions are shown.
Chapter 2/Thinking Like an Economist ❖ 31
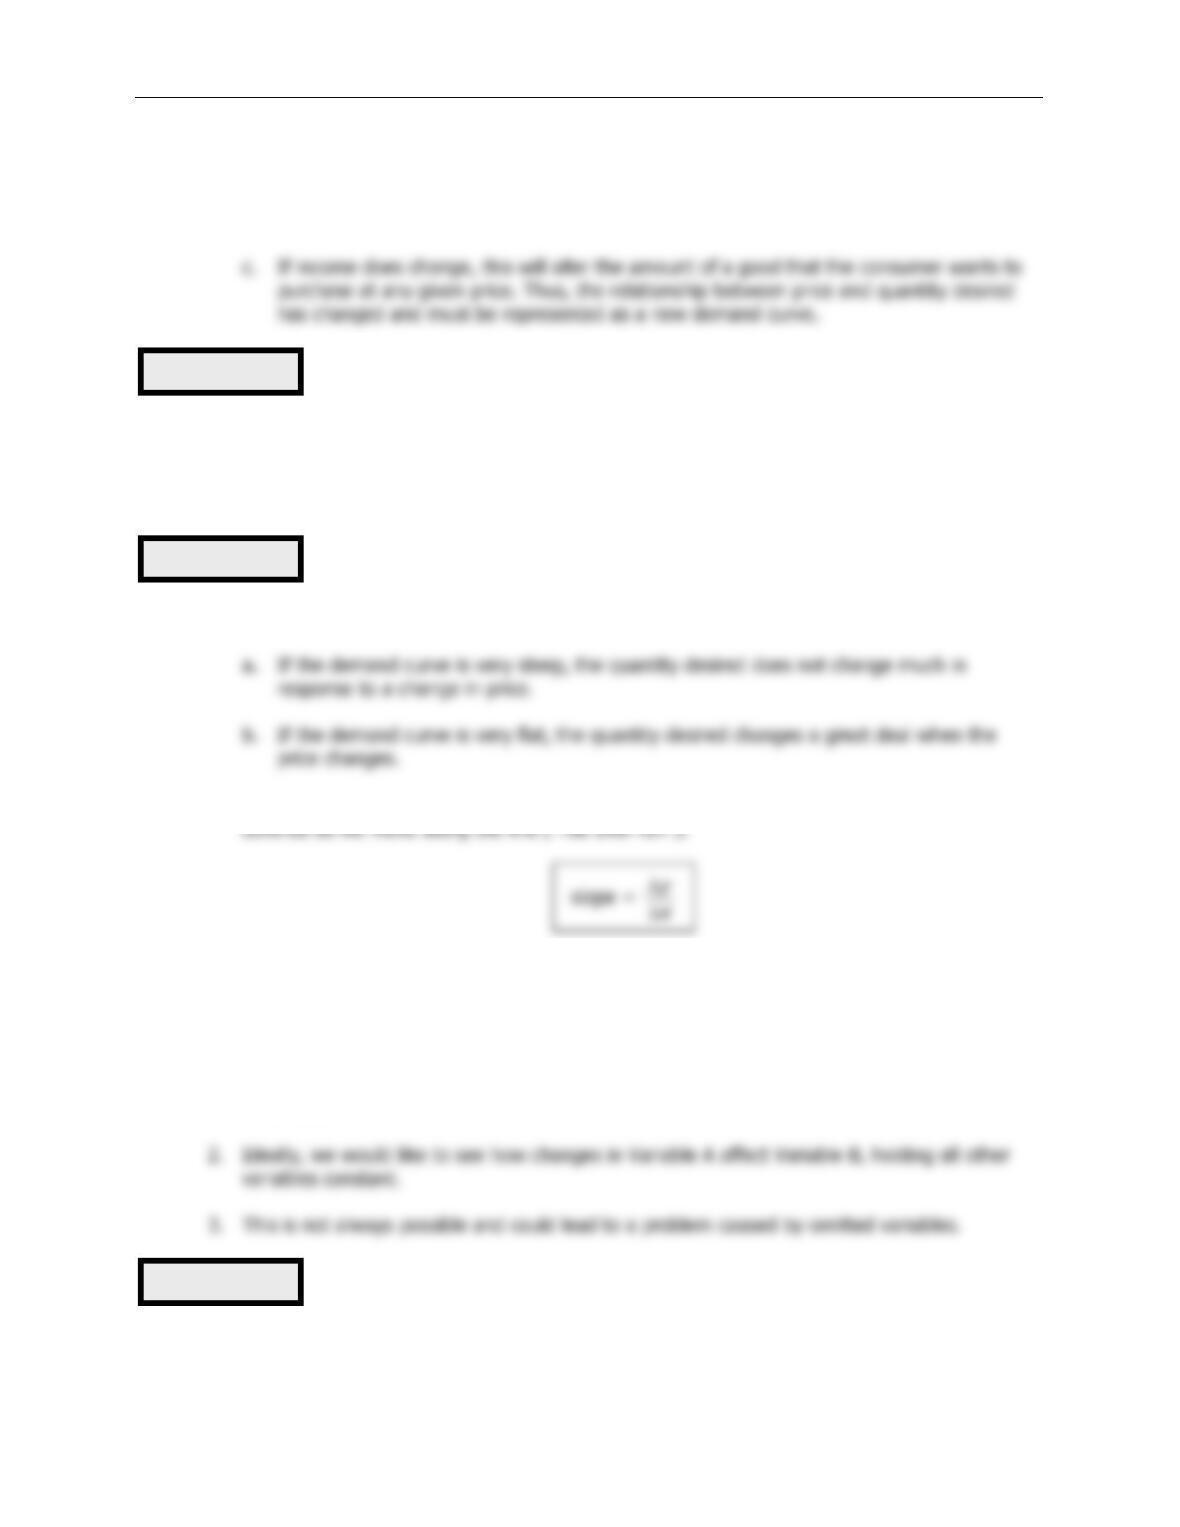
2. a. Figure 6 shows a production possibilities frontier between guns and butter. It is bowed out
because of the law of increasing opportunity costs. As the economy moves from producing many
32 ❖ Chapter 2/Thinking Like an Economist
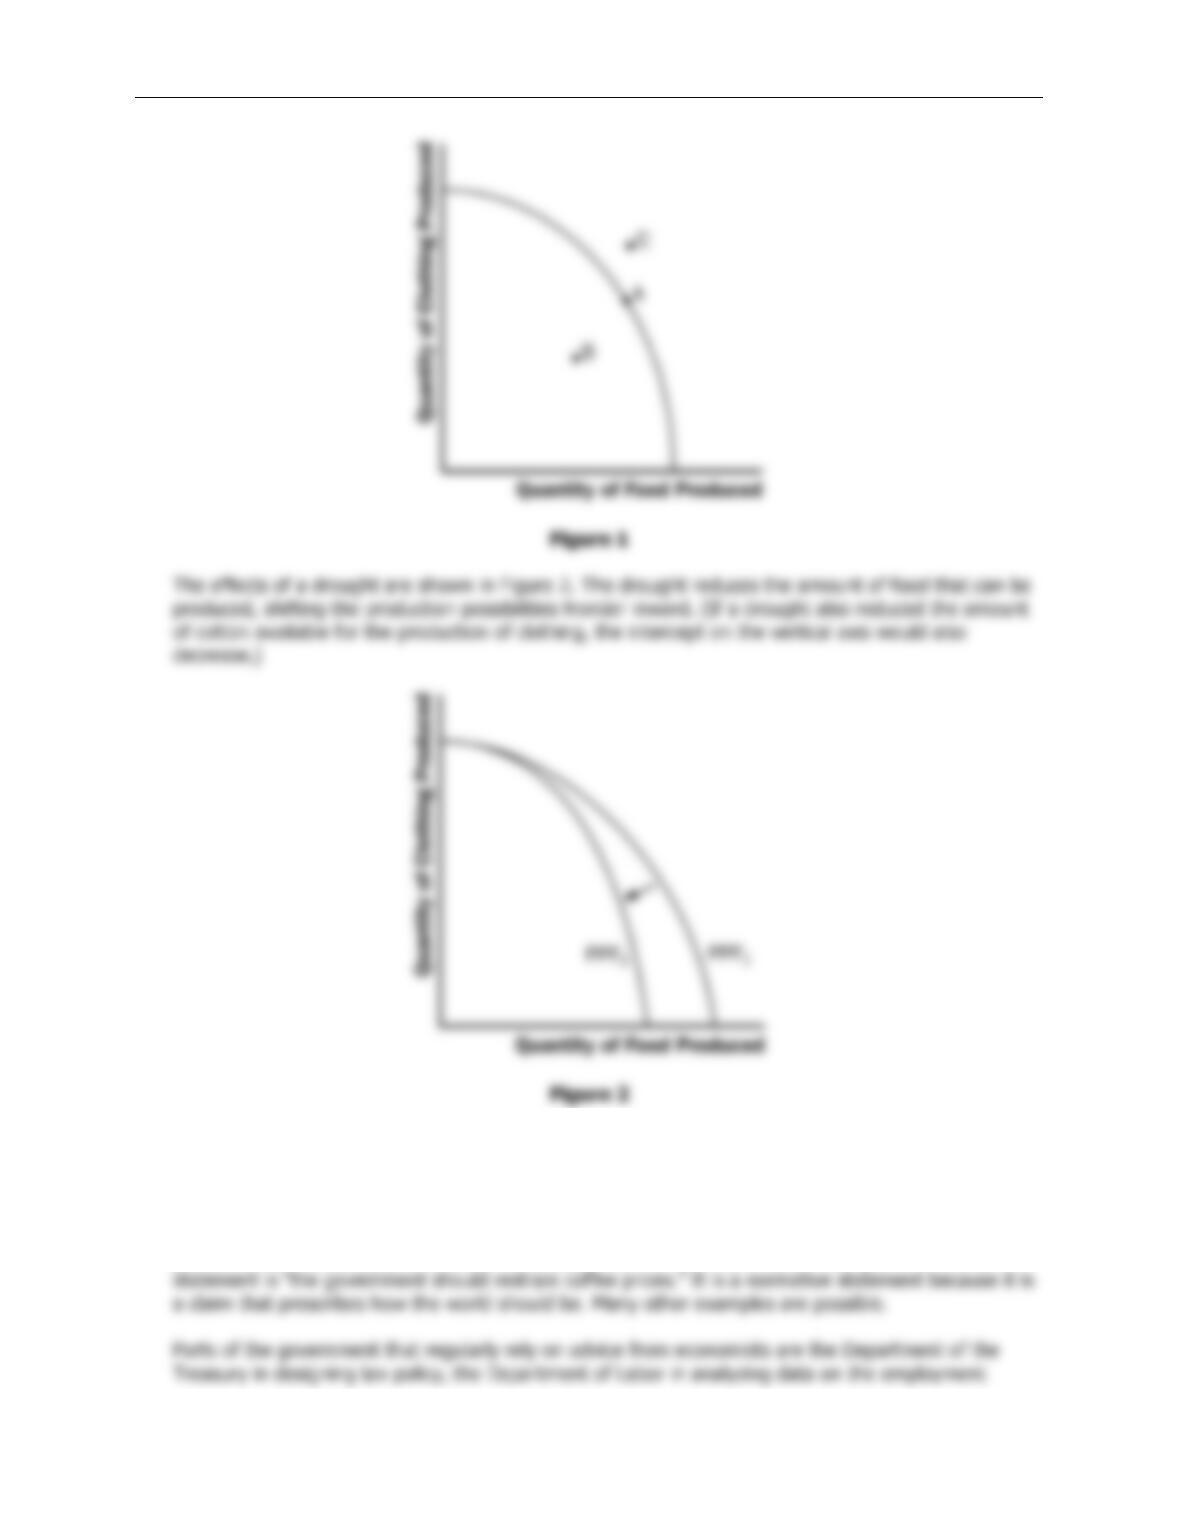
3. See Figure 7. The shape and position of the frontier depend on how costly it is to maintain a clean
4. a. A: 40 lawns mowed; 0 washed cars
b. The production possibilities frontier is shown in Figure 8. Points A, B, and D are on the frontier,
5. a. A family’s decision about how much income to save is related to microeconomics.
6. a. The statement that society faces a short-run trade-off between inflation and unemployment is a
Chapter 2/Thinking Like an Economist ❖ 33