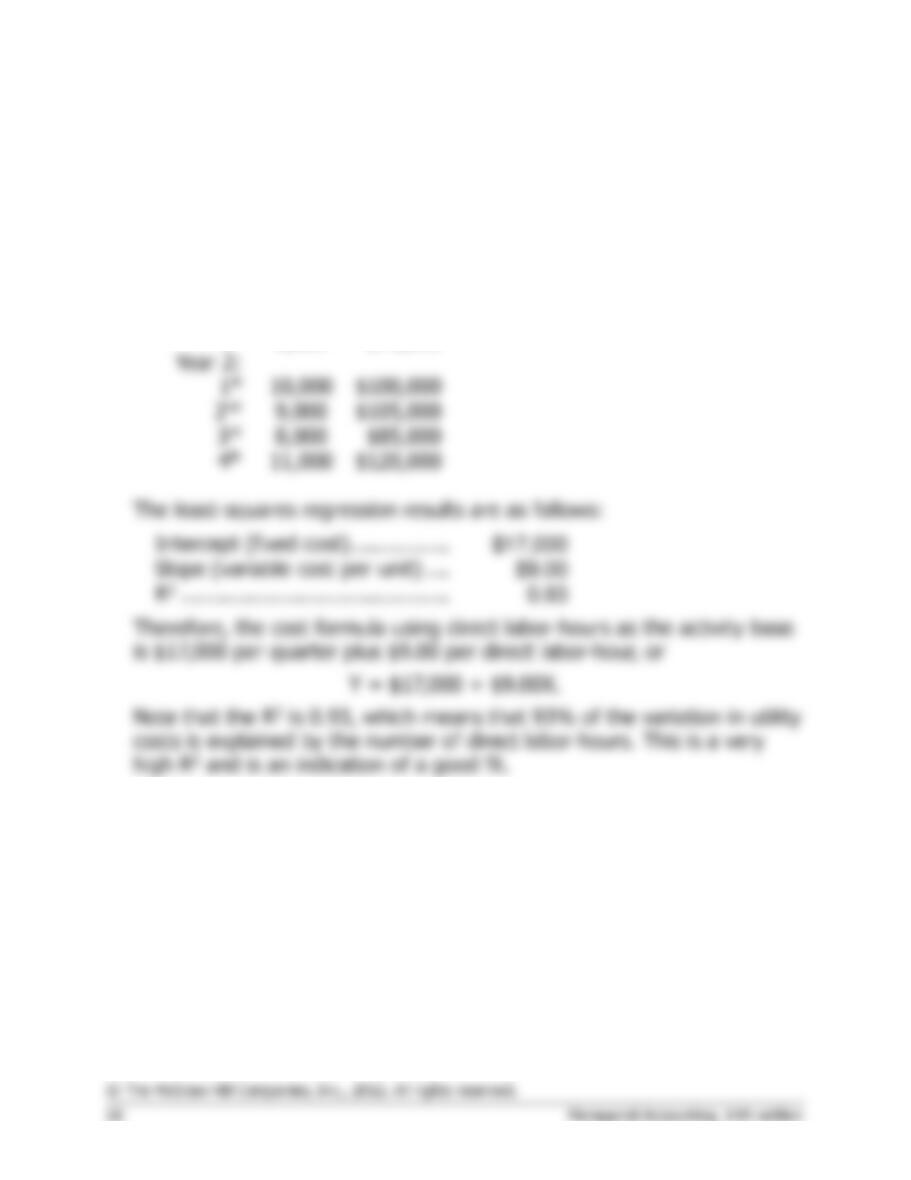
Problem 2A-4 (continued)
2.
a.
Quarter
DLHs
(X)
Utilities
Cost
(Y)
Year 1:
1st
5,000
$50,000
2nd
3,000
$45,000
3rd
4,000
$60,000
4th
6,000
$75,000
9,000
3rd
8,000
$85,000
4th
Intercept (fixed cost) …………….
Slope (variable cost per unit) ….
Problem 2A-4 (continued)
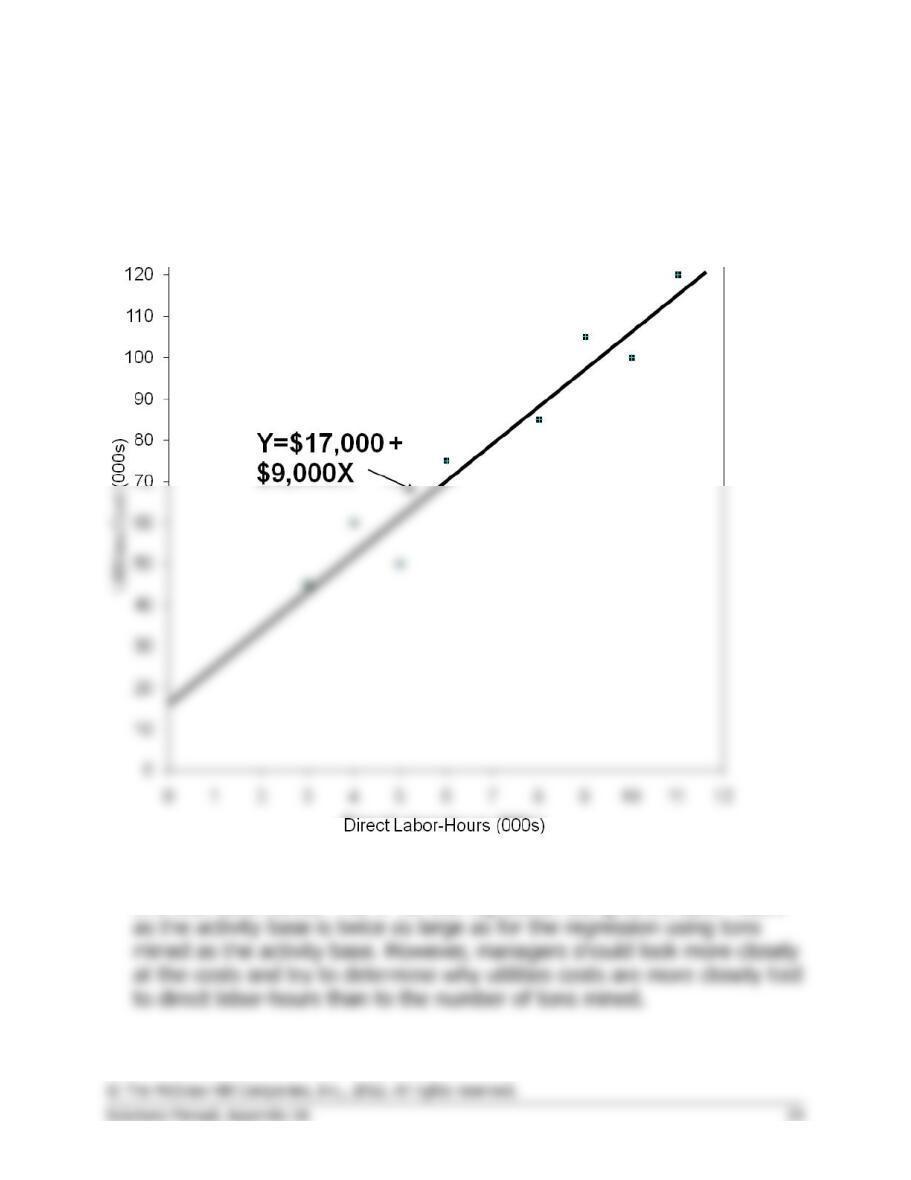
b. The scattergraph plot of utility costs versus direct labor–hours appears
below:
3. The company should probably use direct labor-hours as the activity
base, since the fit of the regression line to the data is much tighter than
it is with tons mined. The R2 for the regression using direct labor-hours
CASE 2A-5 (60 minutes)
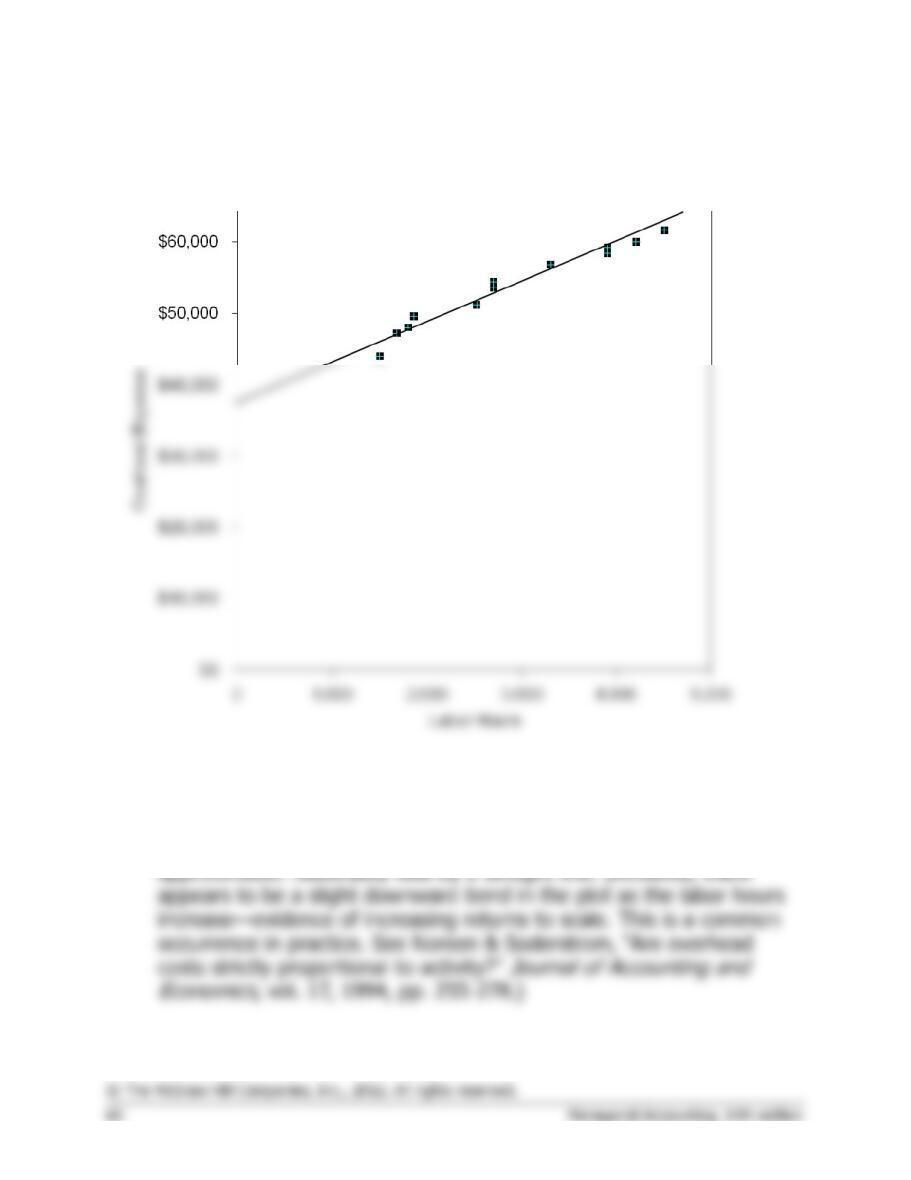
1. The scattergraph is shown below.
The scattergraph reveals several interesting points about the behavior of
overhead costs:
• The relation between overhead expense and labor hours is
CASE 2A-5 (continued)
• The data points are all fairly close to the straight line. This indicates
that most of the variation in overhead expenses is explained by labor
hours. As a consequence, there probably wouldn’t be much benefit to
investigating other possible cost drivers for the overhead expenses.
3. Using the least-squares regression estimate of the variable overhead
cost, the total variable cost per guest is computed as follows:
Food and beverages ………………………..
$17.00
Labor (0.5 hour @ $10 per hour) ……….
5.00
Sales (120 guests @ $45.00 per guest) …………..
Variable cost (120 guests @ $24.64 per guest) …
4. Assuming that no additional fixed costs are incurred as a result of
catering the charity event, any price greater than the variable cost per
guest of $24.64 would contribute to profits.
CASE 2A-5 (continued)
5. We would favor bidding slightly less than $42 to get the contract. Any
bid above $24.64 would contribute to profits and a bid at the normal
price of $45 is unlikely to land the contract. And apart from the
contribution to profit, catering the event would show off the company’s
Appendix 2B
Cost of Quality
Exercise 2B-1 (10 minutes)
1. Quality of conformance
2. Quality of conformance
3. Prevention costs, appraisal costs
4. Internal failure costs, external failure costs
Exercise 2B-2 (15 minutes)
1.
Prevention
Costs
Appraisal
Costs
Internal
Failure
Costs
External
Failure
Costs
a.
Customer returns due to
defects …………………….
X
Maintaining testing
equipment ………………..
Inspecting finished
Downtime caused by
Repairs of goods still
quality problems
X
h.
Debugging errors in
software …………………..
X
i.
Recalls of defective
products …………………..
X
Training quality
typing errors ……………..
X
Inspecting materials
Audits of the quality
system ……………………..
n.
Supervision of testing
X
2. Prevention costs and appraisal costs are incurred to keep poor quality of
conformance from occurring. Internal and external failure costs are
incurred because poor quality of conformance has occurred.
Problem 2B-3 (60 minutes)
1.
Yedder Enterprises
Quality Cost Report (in thousands of dollars)
Last Year
This Year
Amount
(000s)
Percent
of Sales
Amount
(000s)
Percent
of Sales
Prevention costs:
Systems development …………..
$ 120
0.13
%
$ 680
0.68
%
Statistical process control
—
0.00
%
270
0.27
%
Quality engineering ……………..
1,080
1.14
%
1,650
1.65
%
Total prevention cost ……………..
1,200
1.27
%
2,600
2.60
%
Appraisal costs:
Inspection …………………………
1,700
1.79
%
2,770
2.77
%
Supplies used in testing ………..
30
0.03
%
40
0.04
%
Cost of testing equipment
0.28
%
0.39
%
Total appraisal cost ………………..
2,000
2.10
%
3,200
3.20
%
Internal failure costs:
Net cost of scrap …………………
0.84
%
1,300
1.30
%
Rework labor ……………………..
1,400
1.47
%
1,600
1.60
%
0.63
%
1,100
1.10
%
Total internal failure cost …………
2,800
2.94
%
4,000
4.00
%
External failure costs:
Product recalls ……………………
3,500
3.68
%
0.60
%
Warranty repairs …………………
3.47
%
2.80
%
3,200
3.37
%
0.20
%
Total external failure cost ………..
10.52
%
3,600
%
Problem 2B-3 (continued)
2.
Problem 2B-3 (continued)
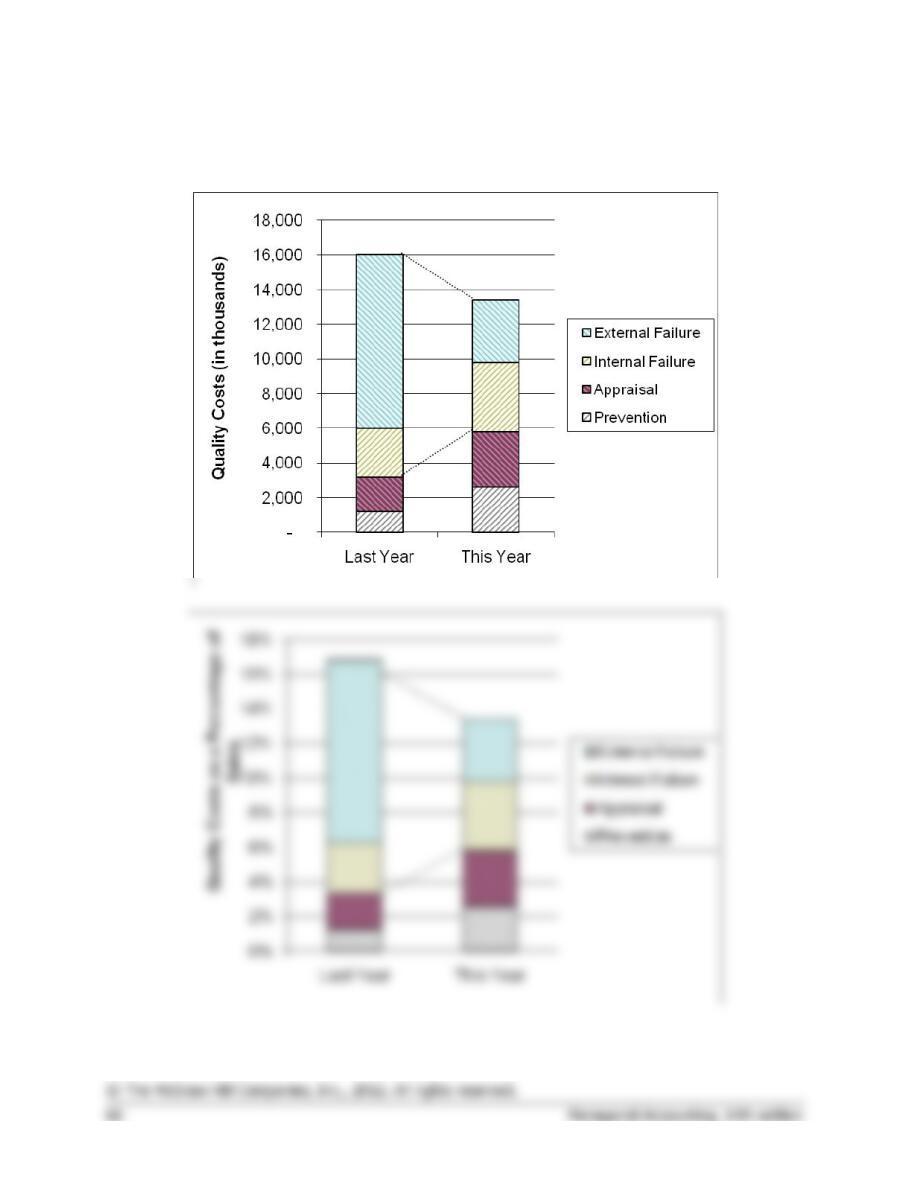
3. During the past year the company has more than doubled its spending
on prevention and it has increased its spending on appraisal activities by
60%. This increased emphasis on prevention and appraisal has resulted
in a decline of total quality costs from 16.84% of sales last year to
13.4% of sales this year. While the situation has improved, internal and
external failure costs still constitute the majority of the quality costs—
and this does not include the lost sales due to customer perceptions of
poor quality. However, if the company continues to emphasize
Problem 2B–4 (60 minutes)
1. A percentage analysis of the company’s quality cost report is presented below:
Year 1
Year 2
Amount
Percentage*
Amount
Percentage*
Prevention costs:
Machine maintenance………
$ 215
5.2
%
22.3
%
$ 160
3.5
%
27.1
%
Training suppliers …………..
5
0.1
0.5
15
0.3
2.5
Design reviews ………………
20
0.5
2.1
95
2.1
16.1
Total prevention cost …………
240
5.8
24.9
270
6.0
45.7
Appraisal costs:
0.5
Final testing …………………..
160
3.9
16.6
94
2.1
15.9
Total appraisal cost …………..
205
5.0
21.3
116
2.6
19.6
Rework ………………………..
2.9
12.4
62
1.4
10.5
7.1
6.8
Total internal failure cost ……
External failure costs:
Warranty repairs …………….
1.7
7.2
23
0.5
3.9
Customer returns ……………
262
6.4
27.2
80
1.8
13.5
Total external failure cost ……
331
8.0
34.3
103
2.3
17.4
Total quality cost ………………
%
100.0
%
13.1
%
100.0
%
Total production cost …………
Problem 2B-4 (continued)
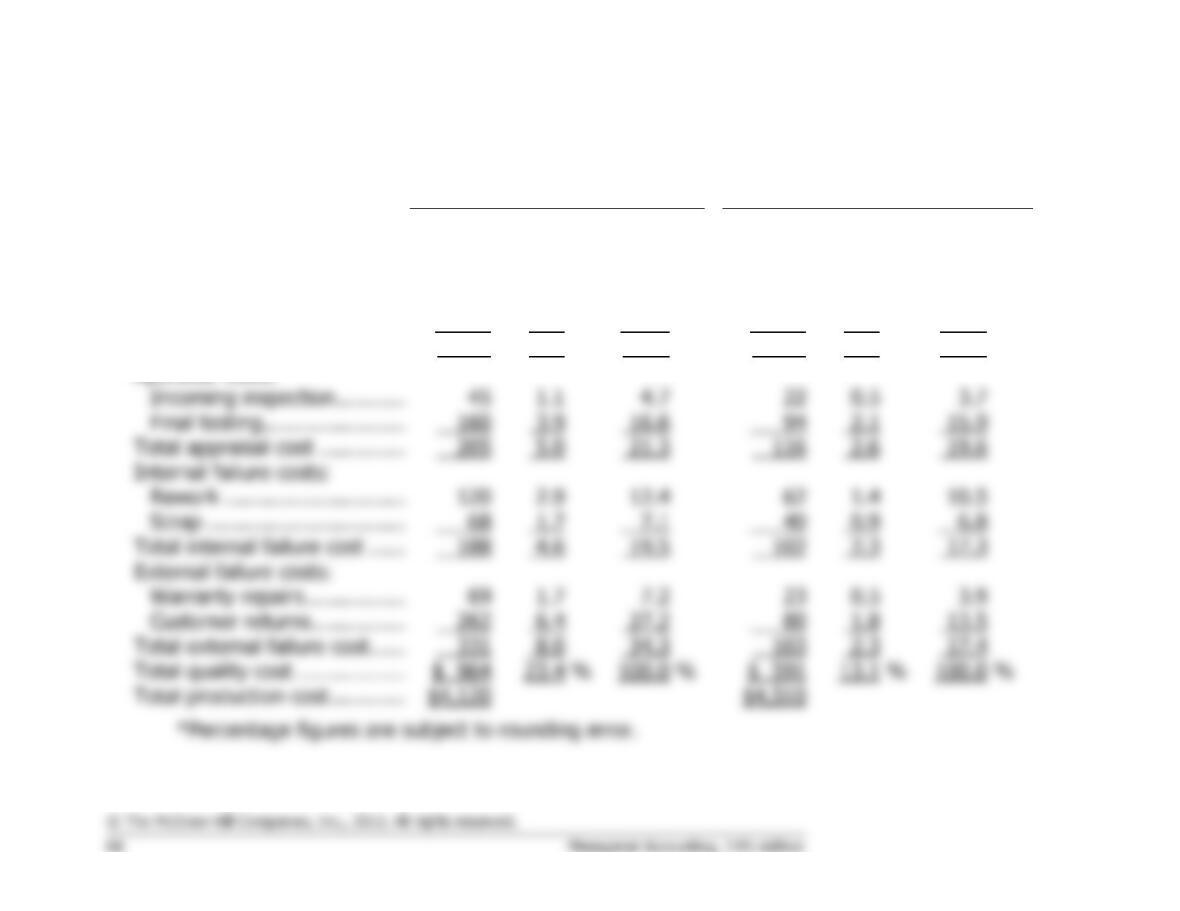
From the above analysis it would appear that Bergen, Inc.’s program
has been successful, because:
• total quality costs as a percentage of total production have declined
from 23.4% to 13.1%.
• external failure costs, those costs signaling customer dissatisfaction,
2. Tony Reese’s current reaction to the quality improvement program is
more favorable as he is seeing the benefits of having the quality
3. To measure the opportunity cost of not implementing the quality
program, Bergen Inc. could assume that:
• sales and market share would continue to decline and then calculate
the revenue and income lost.
• the company would have to compete on price rather than quality and
calculate the impact of having to lower product prices.