Case Solutions
Input boxes in tan
Output boxes in yellow
Given data in blue
Calculations in red
Answers in green
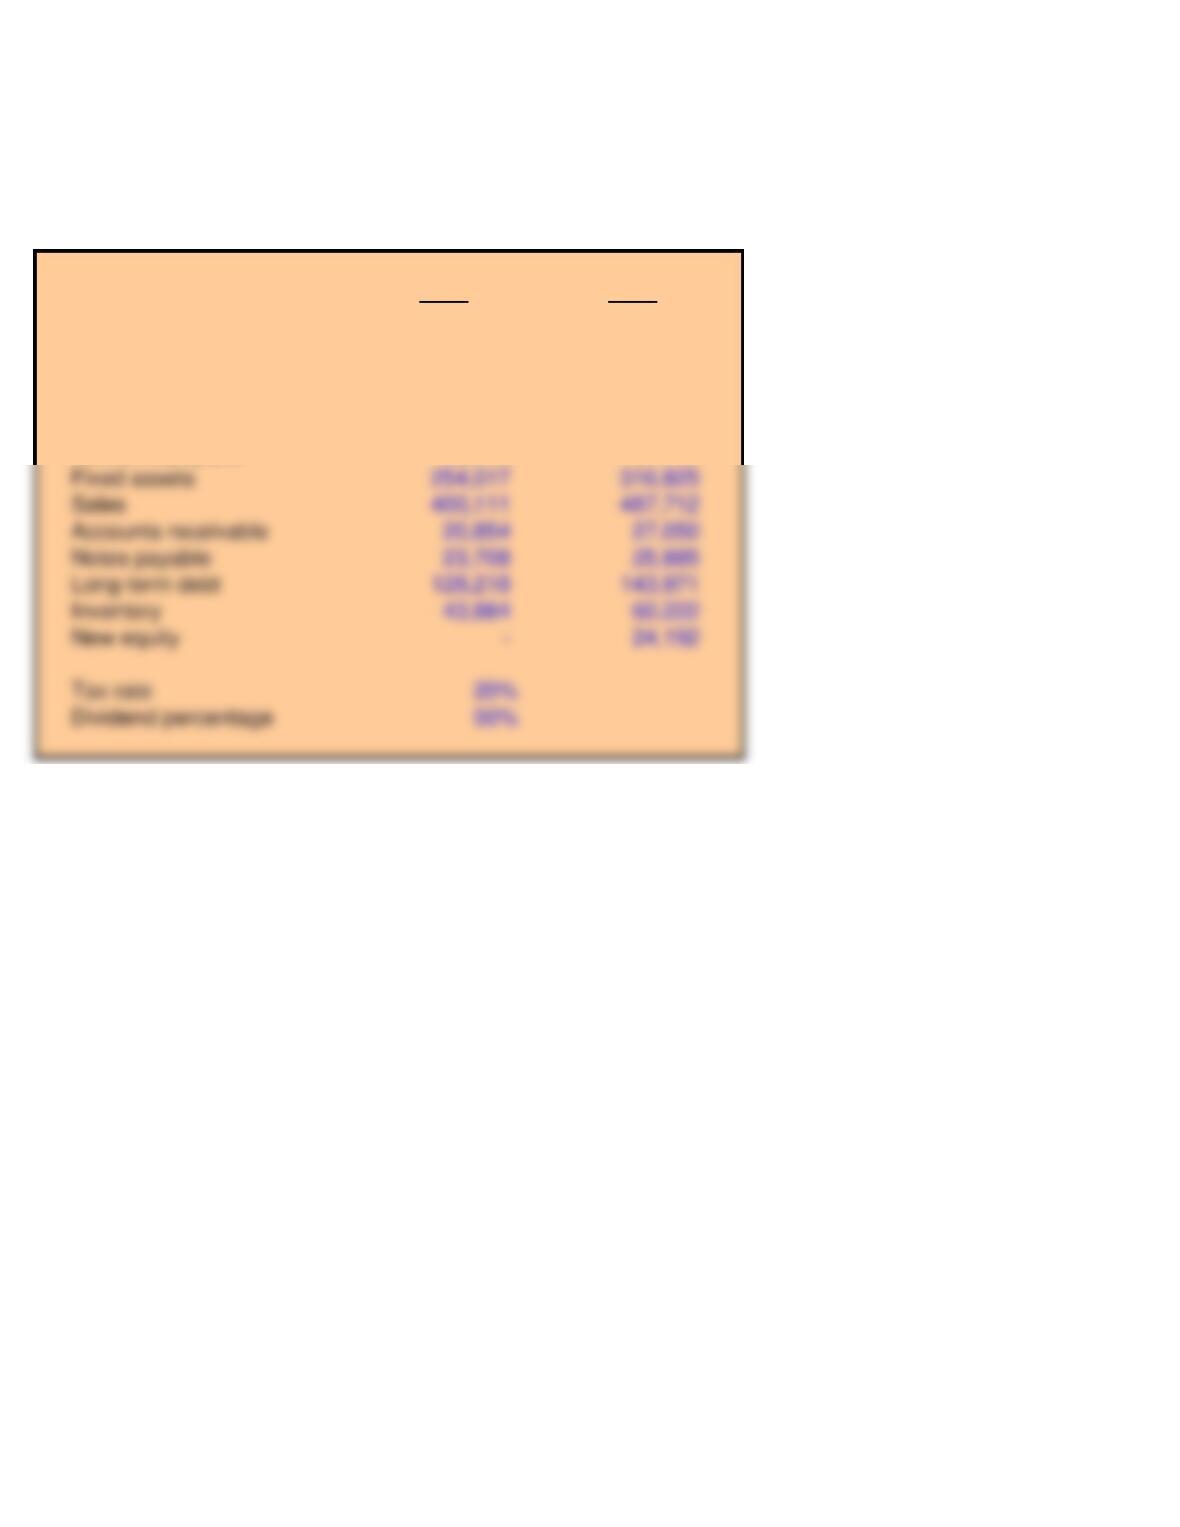
Input area:
2015 2016
Cost of goods sold 203,963$ 257,528$
Cash 29,429 31,267
Depreciation 57,576 65,076
Interest expense 12,530 14,345
Selling & Administrative 40,110 52,351
Accounts payable 52,015 57,708
Output area:
Chapter 2
Cash Flows and Financial Statements at Sunset Boards
Fixed assets 254,017 316,825
Accounts receivable 20,854 27,050
Notes payable 23,708 25,885
Long-term debt 128,218 143,971
New equity – 24,192
Tax rate 20%
Dividend percentage 50%
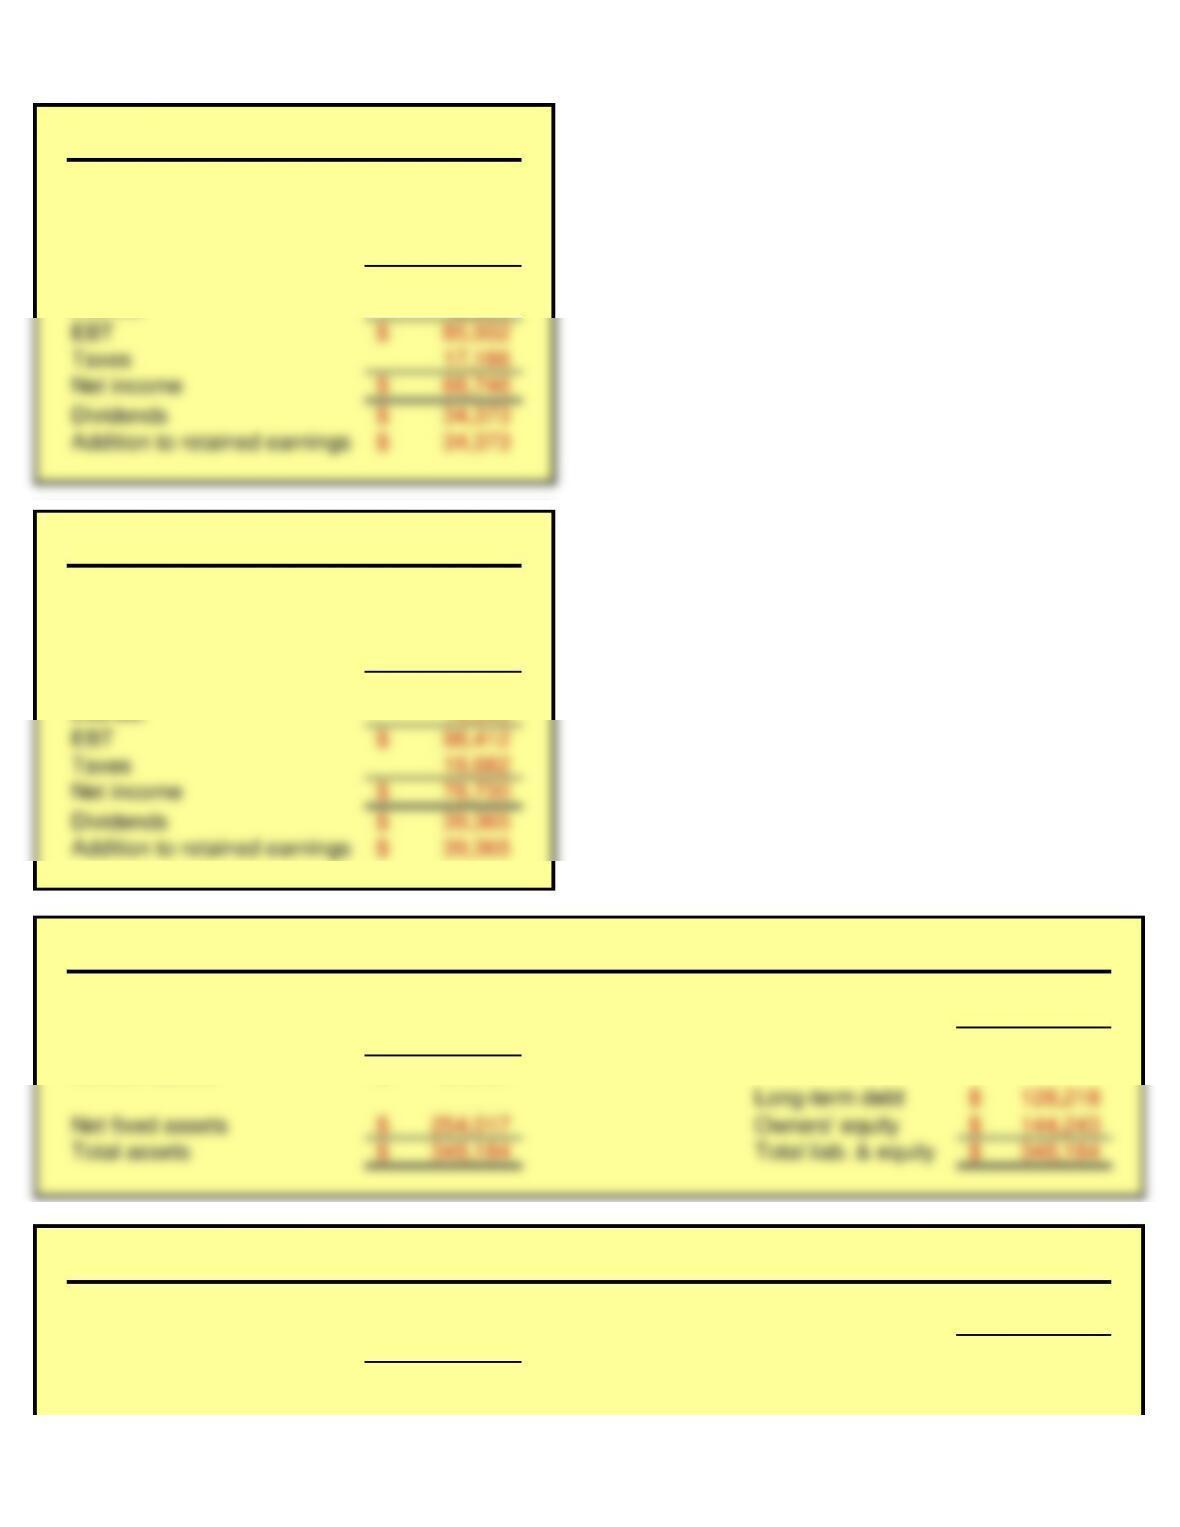
Sales 400,111$
Cost of goods sold 203,963
Selling & Administrative 40,110
Depreciation 57,576
EBIT 98,462$
Interest 12,530
Sales 487,712$
Cost of goods sold 257,528
Selling & Administrative 52,351
Depreciation 65,076
EBIT 112,757$
Cash 29,429$ Accounts payable 52,015$
Accounts receivable 20,854 Notes payable 23,708
Inventory 43,884 Current liabilities 75,723$
Current assets 94,167$
Cash 31,267$ Accounts payable 57,708$
Accounts receivable 27,050 Notes payable 25,885
Inventory 60,222 Current liabilities 83,593$
Current assets 118,539$ Long-term debt 143,971$
Balance sheet as of Dec. 31, 2016
2015 Income Statement
2016 Income Statement
Balance sheet as of Dec. 31, 2015
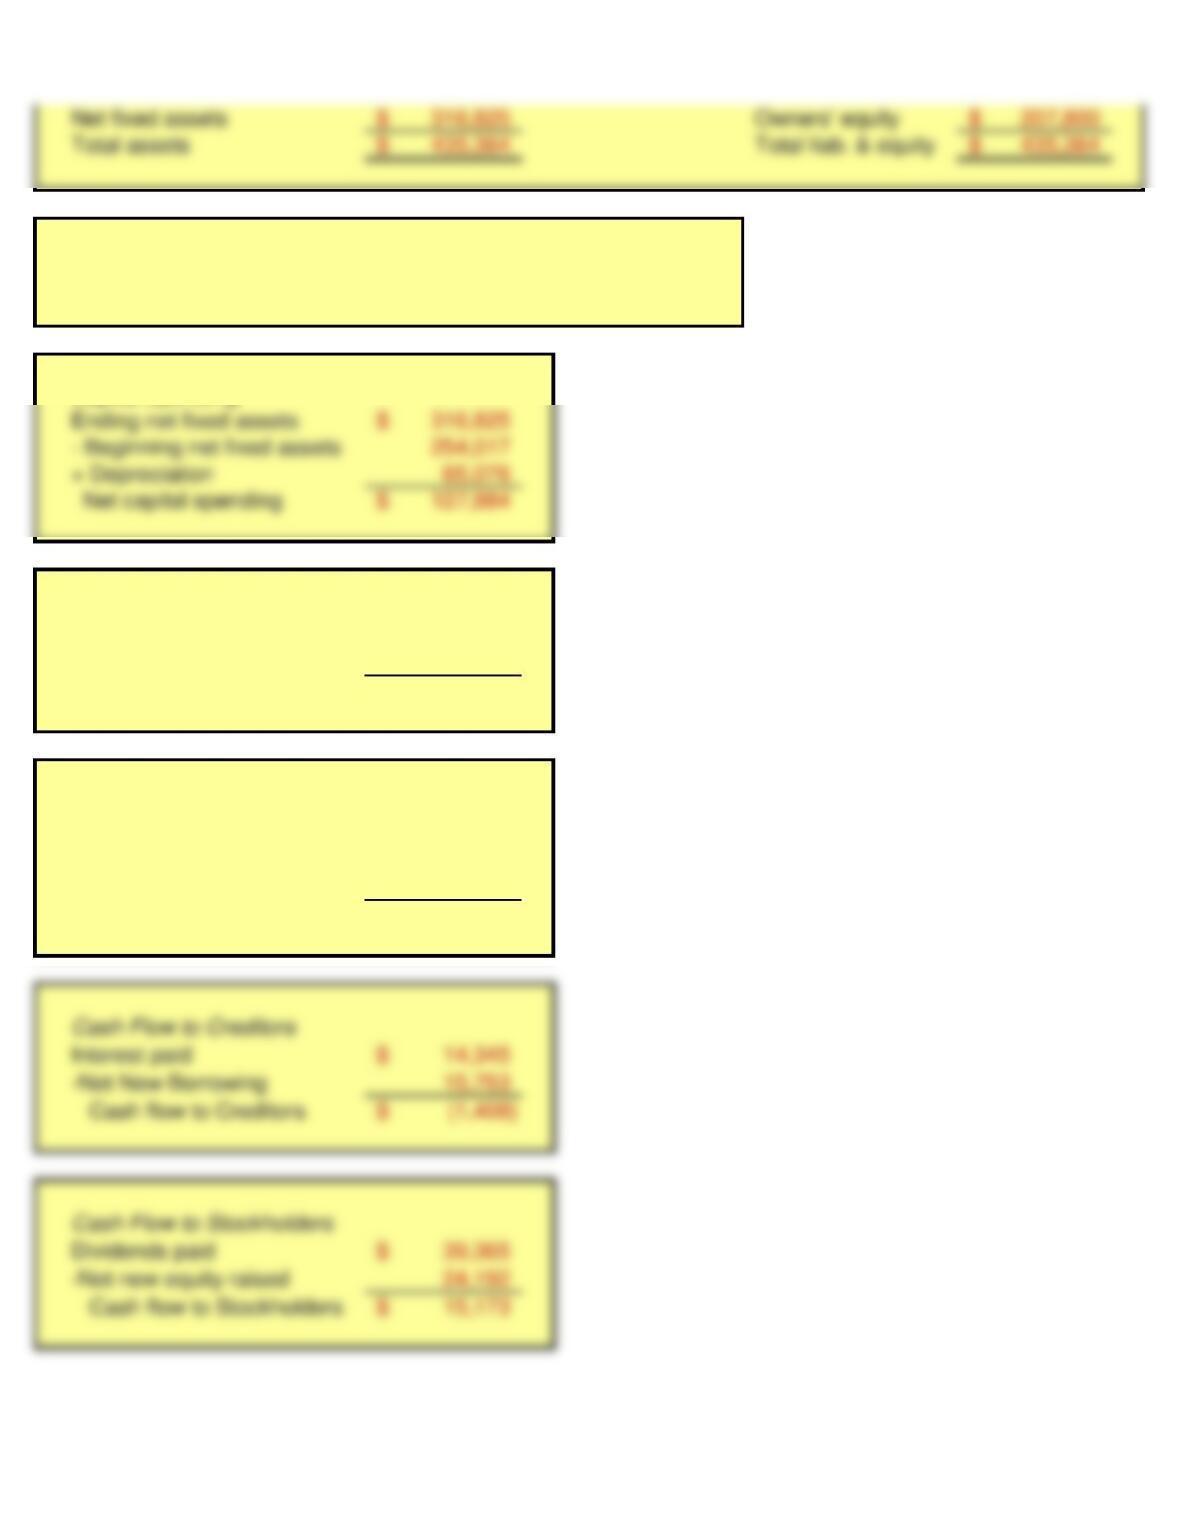
2015 2016
Operating cash flow 138,852$ 158,151$
Capital Spending
Change in Net Working Capital
Ending NWC 34,946$
-Beginning NWC 18,444
Change in NWC 16,502$
Cash Flow from Assets
Operating cash flow 158,151$
– Net capital spending 127,884
-Change in NWC 16,502
Cash flow from assets 13,765$