Chapter 2
Managerial Accounting and Cost Concepts
Solutions to Questions
2-1 The three major elements of product
costs in a manufacturing company are direct
materials, direct labor, and manufacturing
overhead.
2-2
a. Direct materials are an integral part of a
finished product and their costs can be
conveniently traced to it.
b. Indirect materials are generally small
items of material such as glue and nails. They
may be an integral part of a finished product but
their costs can be traced to the product only at
great cost or inconvenience.
2-3 A product cost is any cost involved in
purchasing or manufacturing goods. In the case
of manufactured goods, these costs consist of
direct materials, direct labor, and manufacturing
overhead. A period cost is a cost that is taken
directly to the income statement as an expense
in the period in which it is incurred.
2-4
a. Variable cost: The variable cost per unit is
constant, but total variable cost changes in
direct proportion to changes in volume.
b. Fixed cost: The total fixed cost is constant
within the relevant range. The
average
fixed
cost per unit varies inversely with changes
in volume.
c. Mixed cost: A mixed cost contains both
variable and fixed cost elements.
2-5
a. Unit fixed costs decrease as volume
increases.
about variable and fixed cost behavior are
valid.
2-7 An activity base is a measure of
whatever causes the incurrence of a variable
cost. Examples of activity bases include units
produced, units sold, letters typed, beds in a
hospital, meals served in a cafe, service calls
made, etc.
2-9 A discretionary fixed cost has a fairly
short planning horizon—usually a year. Such
costs arise from annual decisions by
2-10 Yes. As the anticipated level of activity
changes, the level of fixed costs needed to
support operations may also change. Most fixed
costs are adjusted upward and downward in
large steps, rather than being absolutely fixed at
one level for all ranges of activity.
2-11 The high-low method uses only two
points to determine a cost formula. These two
points are likely to be less than typical because
they represent extremes of activity.
2-13 The term “least–squares regression”
means that the sum of the squares of the
deviations from the plotted points on a graph to
expenses to obtain net operating income. The
traditional approach organizes costs by function,
such as production, selling, and administration.
Within a functional area, fixed and variable costs
are intermingled.
2-15 The contribution margin is total sales
revenue less total variable expenses.
2-16 A differential cost is a cost that differs
between alternatives in a decision. An
opportunity cost is the potential benefit that is
given up when one alternative is selected over
Exercise 2-1 (10 minutes)
1. The wages of employees who build the sailboats: direct labor cost.
3. The cost of an aluminum mast installed in a sailboat: direct materials
cost.
5. Rent on the boathouse: a combination of manufacturing overhead,
6. The wages of the company’s bookkeeper: administrative cost.
8. Depreciation on power tools: manufacturing overhead cost.
Exercise 2-2 (15 minutes)
Product
Cost
Period
Cost
1.
The cost of the memory chips used in a
radar set ……………………………………………
X
2.
Factory heating costs ……………………………..
X
3.
Factory equipment maintenance costs ………..
X
4.
Training costs for new administrative
X
X
6.
salespersons ………………………………………
X
7.
Wages and salaries of factory security
personnel …………………………………………..
X
8.
The cost of air-conditioning
executive offices ………………………………….
X
9.
Wages and salaries in the department that
handles billing customers ………………………
X
10.
Depreciation on the equipment in the
fitness room used by factory workers ……….
X
Telephone expenses incurred by factory
management ………………………………………
X
The costs of shipping completed radar sets
X
The wages of the workers who assemble
the radar sets ……………………………………..
X
X
Health insurance premiums for factory
personnel …………………………………………..
X
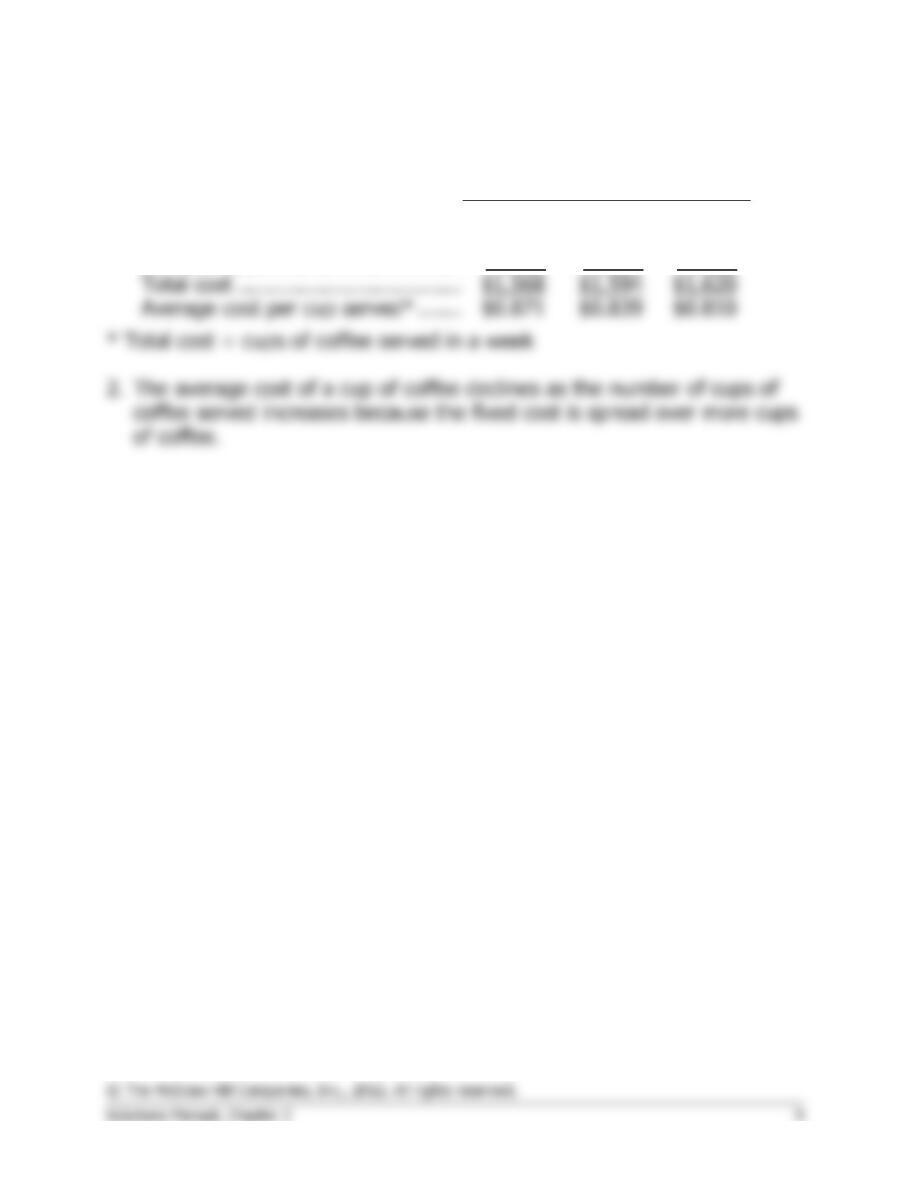
Exercise 2-3 (15 minutes)
1.
Cups of Coffee Served
in a Week
1,800
1,900
2,000
Fixed cost ……………………………………………………….
$1,100
$1,100
$1,100
Variable cost …………………………..
468
494
520
Total cost ……………………………………………………….
$1,568
$1,594
$1,620
Average cost per cup served* …………………………..
$0.871
$0.839
$0.810
Exercise 2-4 (20 minutes)
1.
Occupancy-
Days
Electrical
Costs
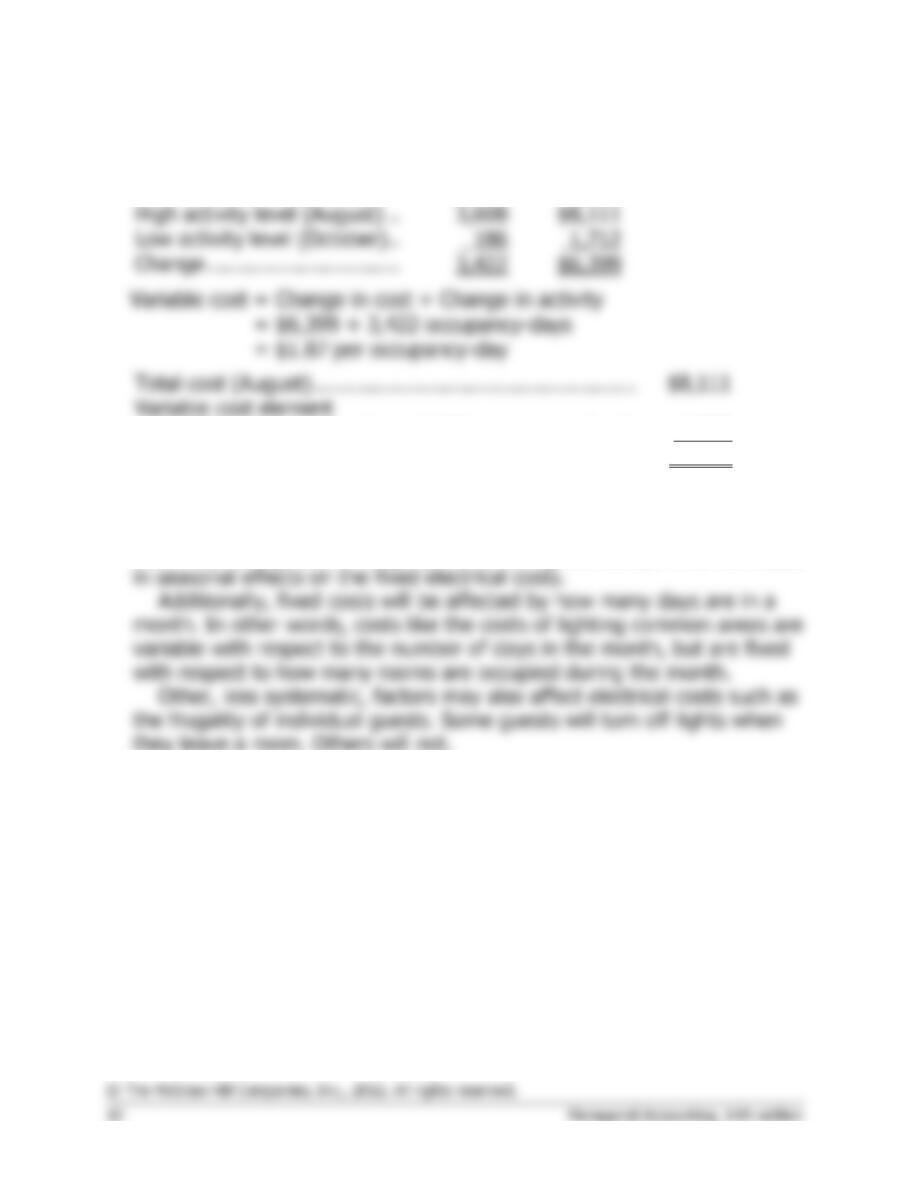
High activity level (August) ..
Total cost (August) …………………………………………….
$8,111
($1.87 per occupancy-day × 3,608 occupancy-days)
6,747
Fixed cost element …………………………………………….
$1,364
2. Electrical costs may reflect seasonal factors other than just the variation
in occupancy days. For example, common areas such as the reception
area must be lighted for longer periods during the winter. This will result
Exercise 2-5 (15 minutes)
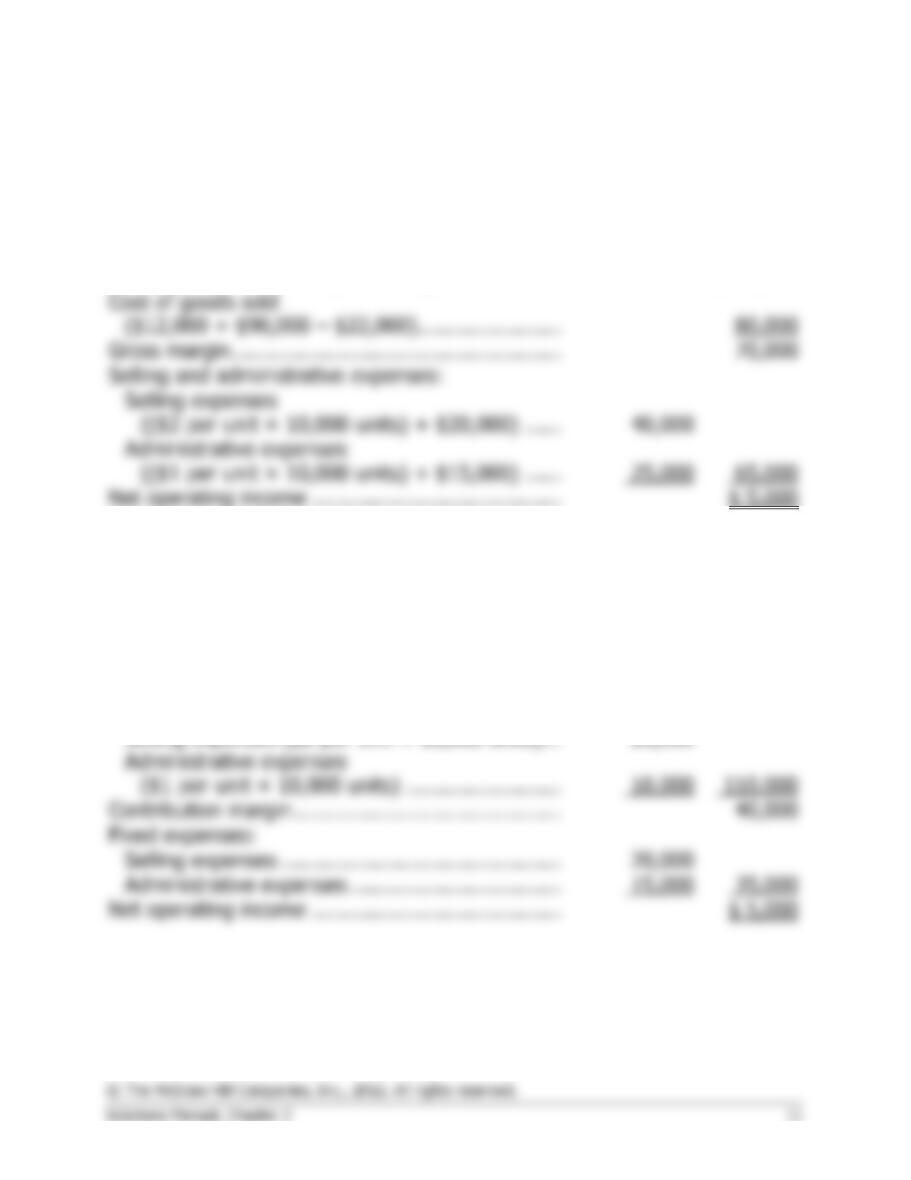
1. Traditional income statement
Redhawk, Inc.
Traditional Income Statement
Sales ($15 per unit × 10,000 units) ………………..
$150,000
Gross margin ……………………………………………..
Selling and administrative expenses:
Administrative expenses
(($1 per unit × 10,000 units) + $15,000) ……
Net operating income ………………………………….
2. Contribution format income statement
Redhawk, Inc.
Contribution Format Income Statement
Sales ……………………………………………………….
$150,000
Variable expenses:
Cost of goods sold
($12,000 + $90,000 – $22,000) ………………..
$80,000
Administrative expenses
Contribution margin …………………………………….
Fixed expenses:
Net operating income ………………………………….
Exercise 2-6 (15 minutes)
Direct
Indirect
Cost
Cost Object
Cost
Cost
1.
The salary of the head
chef
The hotel’s restaurant
X
2.
The salary of the head
chef
A particular restaurant
customer
X
3.
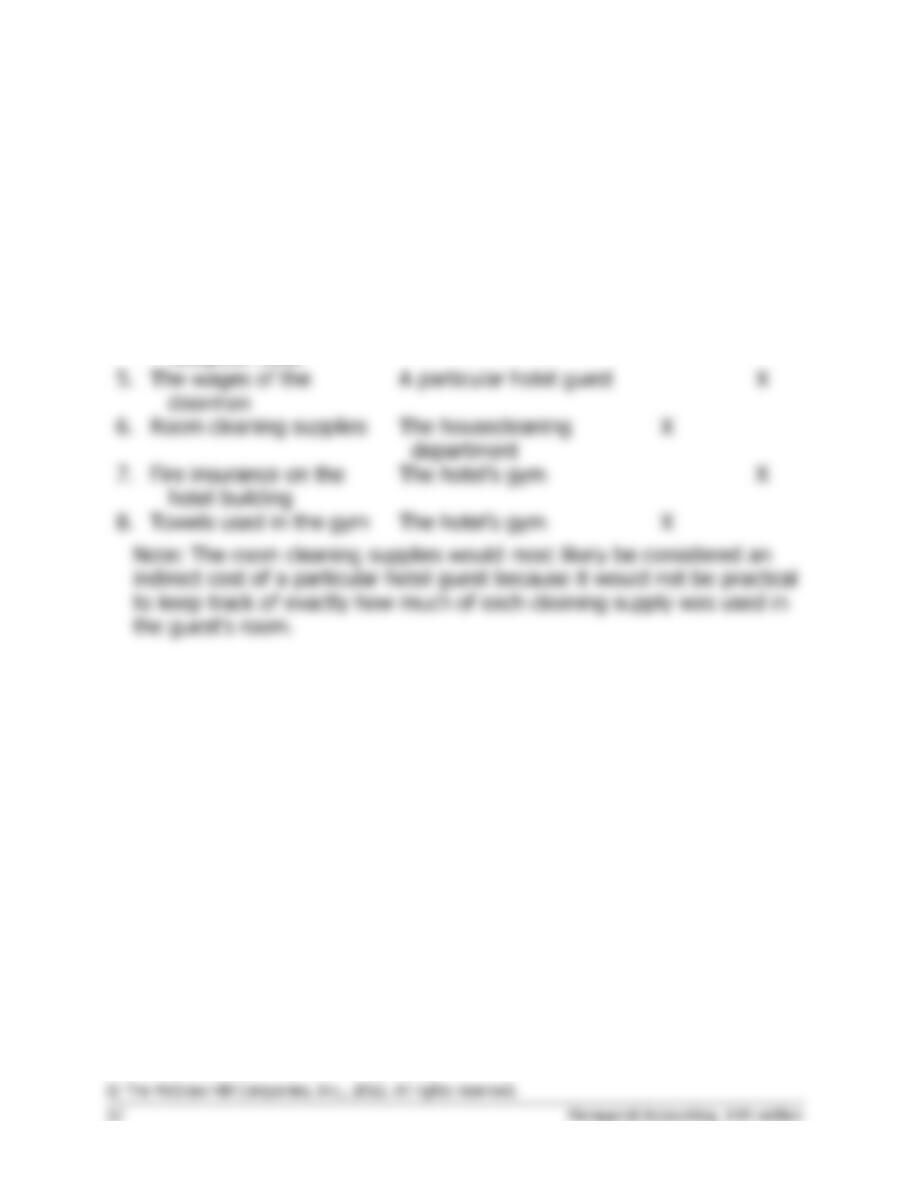
Room cleaning supplies
A particular hotel guest
X
4.
Flowers for the
reception desk
A particular hotel guest
X
6.
Room cleaning supplies
The housecleaning
X
7.
Fire insurance on the
hotel building
The hotel’s gym
X
8.
Towels used in the gym
Exercise 2-7 (15 minutes)
Differential
Opportunity
Sunk
Item
Cost
Cost
Cost
1.
Cost of the new flat-panel
displays …………………………..
X
2.
Cost of the old computer
terminals …………………………
X
3.
Rent on the space occupied by
the registration desk ………….
personnel ………………………..
6.
Costs of maintaining the old
computer terminals ……………
X
7.
Cost of removing the old
8.
Cost of existing registration
X
Exercise 2-8 (20 minutes)
1. The company’s variable cost per unit would be:
$150,000 =$2.50 per unit.
60,000 units
In accordance with the behavior of variable and fixed costs, the
completed schedule is:
Units produced and sold
60,000
80,000
100,000
Total costs:
Variable costs …………………..
$150,000
$200,000
$250,000
Fixed costs ………………………
Total costs …………………………
$510,000
$560,000
$610,000
Cost per unit:
Fixed cost ………………………..
Total cost per unit ……………….
2. The company’s income statement in the contribution format is:
Sales (90,000 units × $7.50 per unit) ……………………….
$675,000
Variable expenses (90,000 units × $2.50 per unit) ………
225,000
Contribution margin………………………………………………
Fixed expenses ……………………………………………………
360,000
Net operating income ……………………………………………
$ 90,000
Exercise 2-9 (30 minutes)
Name of the Cost
Variable
Cost
Fixed
Cost
Product Cost
Period
(Selling and
Admin.) Cost
Opportunity
Cost
Sunk
Cost
Direct
Materials
Direct
Labor
Mfg.
Overhead
Rental revenue forgone, $40,000
per year ………………………………
X
Direct materials cost, $40 per unit .
X
X
Supervisor’s salary, $2,500 per
month …………………………………
X
X
Direct labor cost, $18 per unit …….
X
X
per month …………………………...
X
per month …………………………...
X
X
Depreciation of the building,
X
Electrical costs, $2 per unit …………
X
Exercise 2-10 (45 minutes)
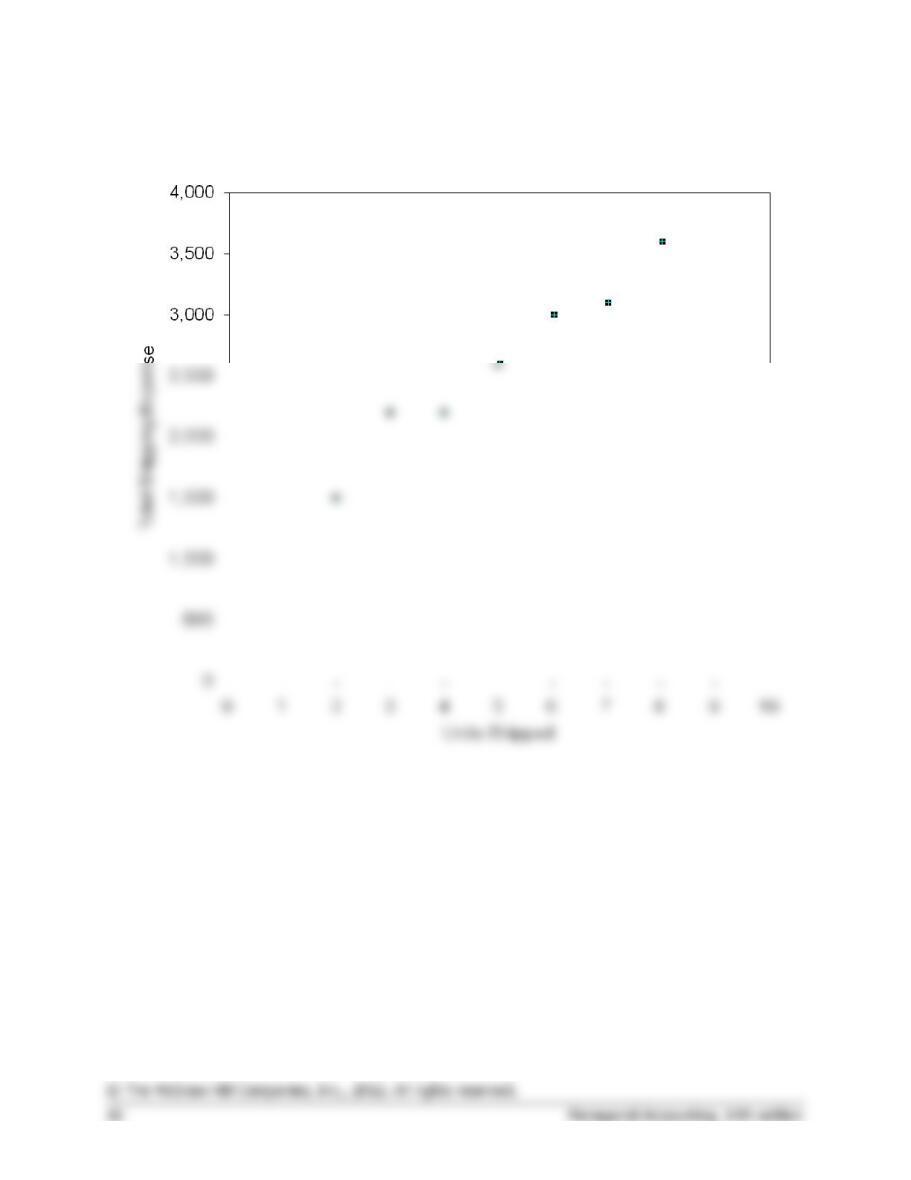
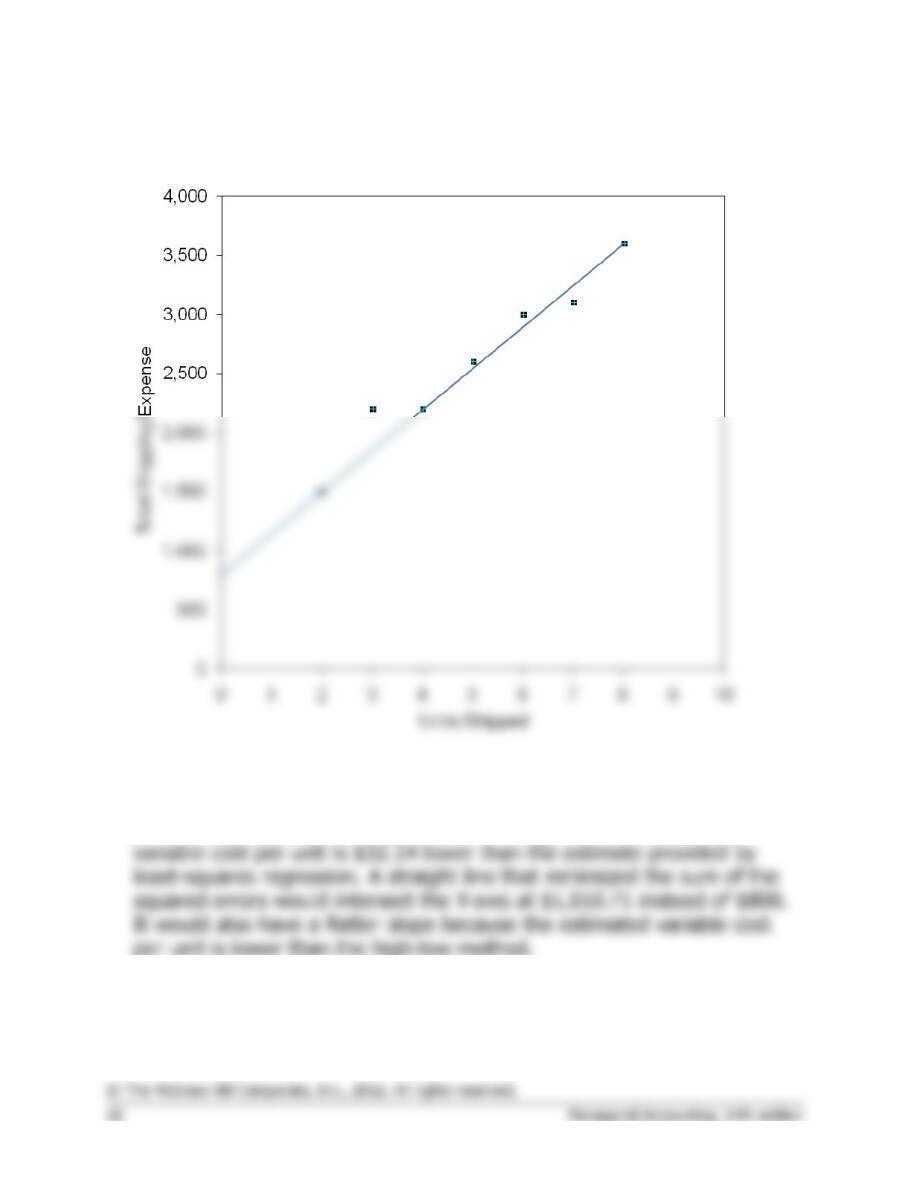
1. The scattergraph appears below:
Yes, there is an approximately linear relationship between the number of
units shipped and the total shipping expense.
Exercise 2-10 (continued)
2.
Units Shipped
Shipping Expense
High activity level …………
8
$3,600
Low activity level ………….
2
1,500
Change ……………………..
6
$2,100
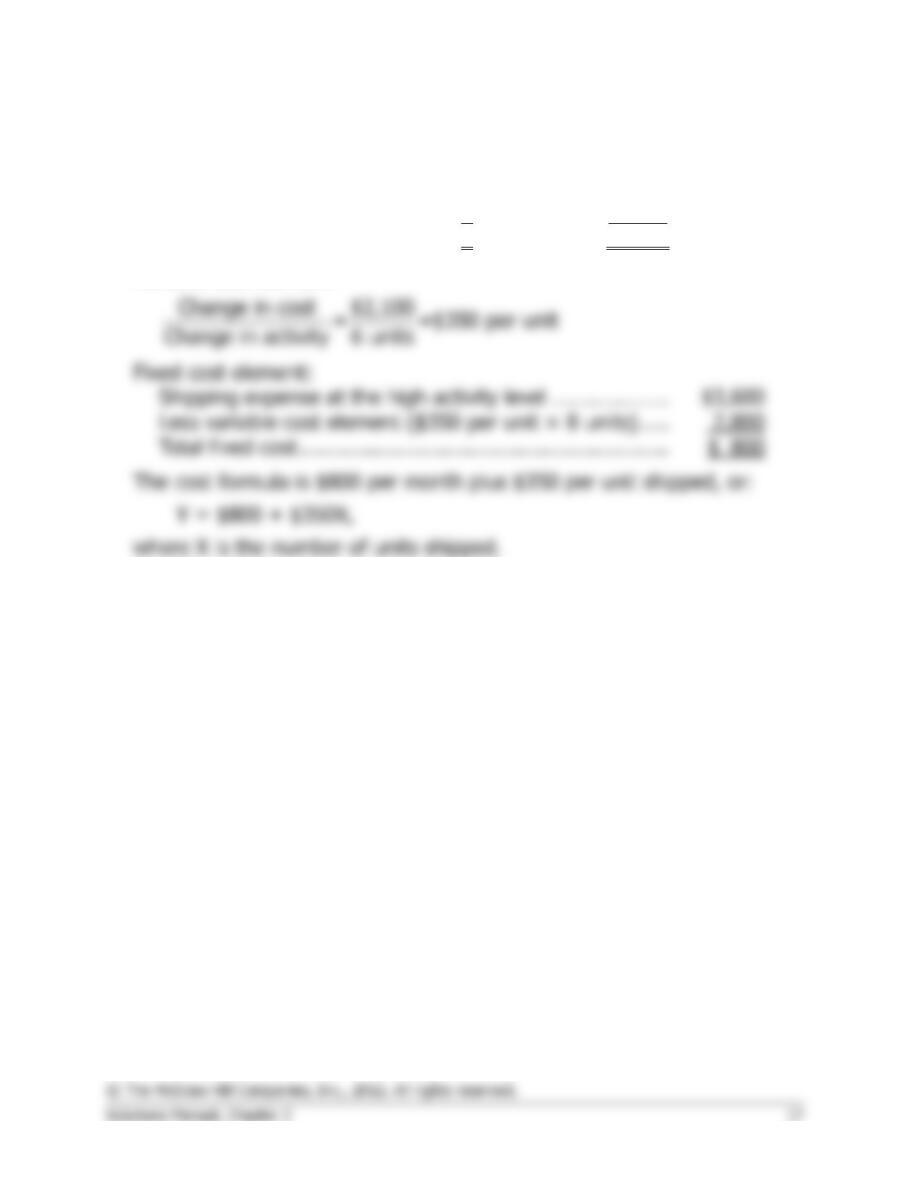
Variable cost element:
Shipping expense at the high activity level ……………….
Less variable cost element ($350 per unit × 8 units)…..
Total fixed cost …………………………………………………..
The scattergraph on the following page shows the straight line drawn
through the high and low data points.
Exercise 2-10 (continued)
3. The high-low estimate of fixed costs is $210.71 lower than the estimate
provided by least-squares regression. The high-low estimate of the
4. The cost of shipping units is likely to depend on the weight and volume
of the units shipped and the distance traveled as well as on the number
of units shipped. In addition, higher cost shipping might be necessary to
Exercise 2-11 (20 minutes)
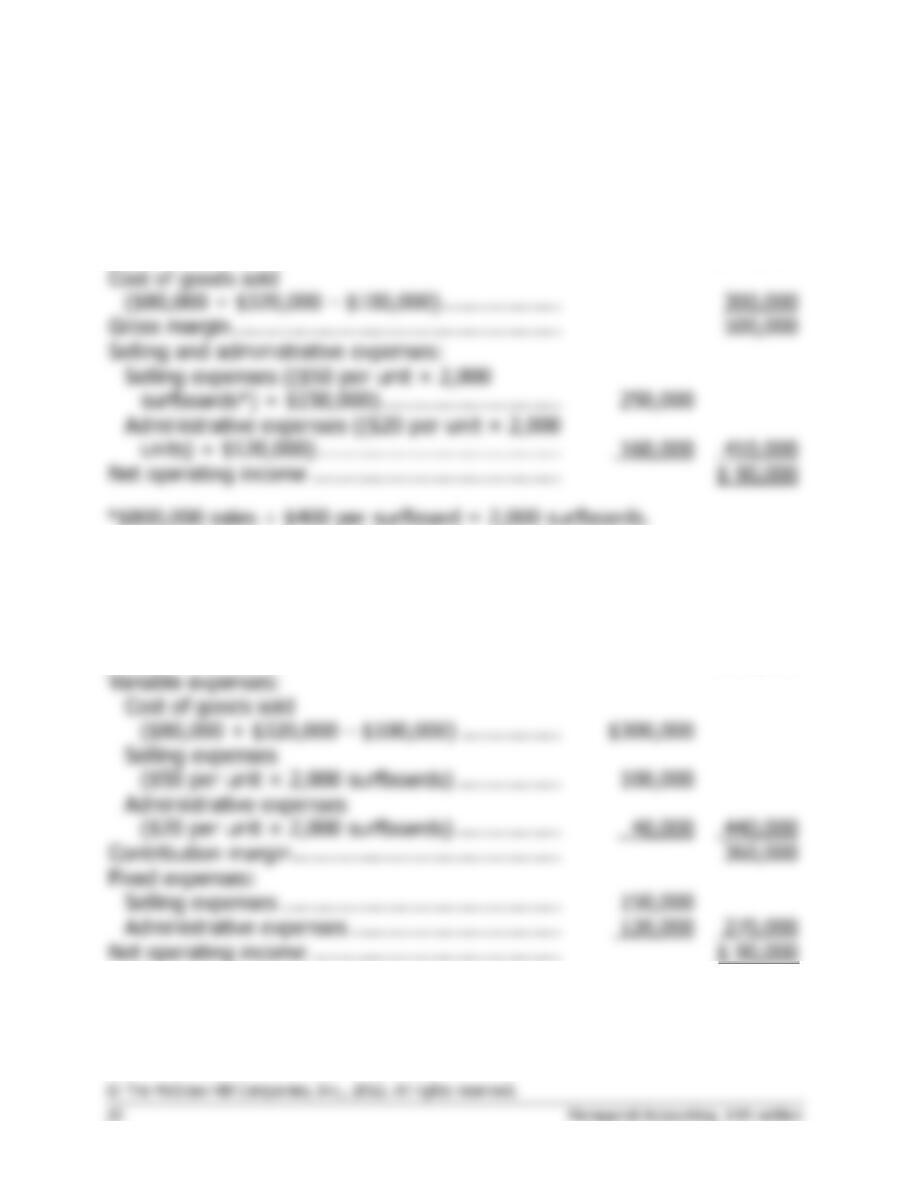
1. Traditional income statement
Haaki Shop, Inc.
Traditional Income Statement
Sales ……………………………………………………….
$800,000
Gross margin ……………………………………………..
Selling and administrative expenses:
Net operating income ………………………………….
2. Contribution format income statement
Haaki Shop, Inc.
Contribution Format Income Statement
Sales ……………………………………………………….
$800,000
Variable expenses:
$300,000
Contribution margin …………………………………….
Fixed expenses:
Net operating income ………………………………….

Exercise 2-11 (continued)
2. Since 2,000 surfboards were sold and the contribution margin totaled
$360,000 for the quarter, the contribution of each surfboard toward
fixed expenses and profits was $180 ($360,000 ÷ 2,000 surfboards =
$180 per surfboard).
Exercise 2-12 (20 minutes)
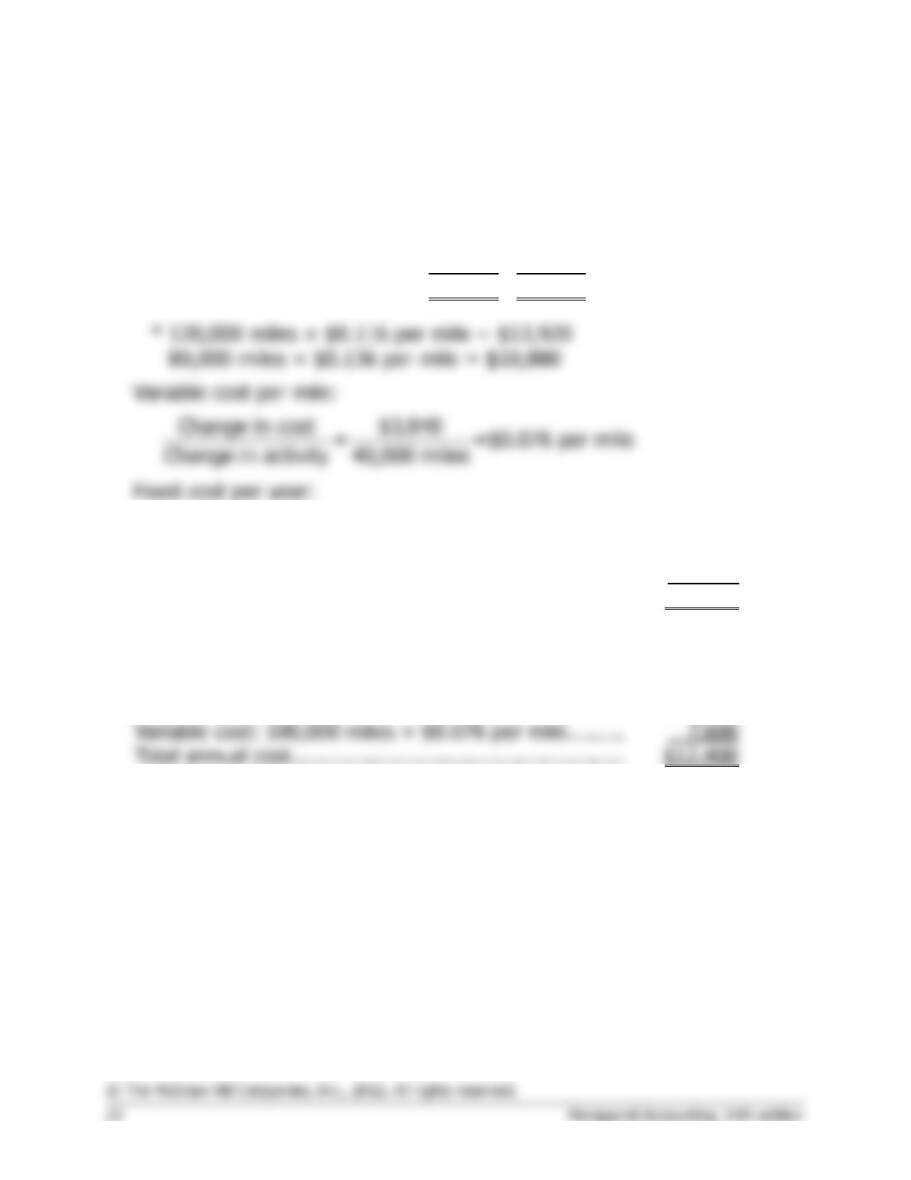
1.
Miles
Driven
Total
Annual
Cost*
High level of activity …………
120,000
$13,920
Low level of activity ………….
80,000
10,880
Change ………………………….
40,000
$ 3,040
120,000 miles × $0.116 per mile = $13,920
80,000 miles × $0.136 per mile = $10,880
Total cost at 120,000 miles …………………………….
$13,920
Less variable cost element:
120,000 miles × $0.076 per mile …………………..
9,120
Fixed cost per year …………………………..…………..
$ 4,800
2. Y = $4,800 + $0.076X
3.
Fixed cost ………………………………………………………
$ 4,800
Variable cost: 100,000 miles × $0.076 per mile ………
Total annual cost ……………………………………………..
$12,400
1.
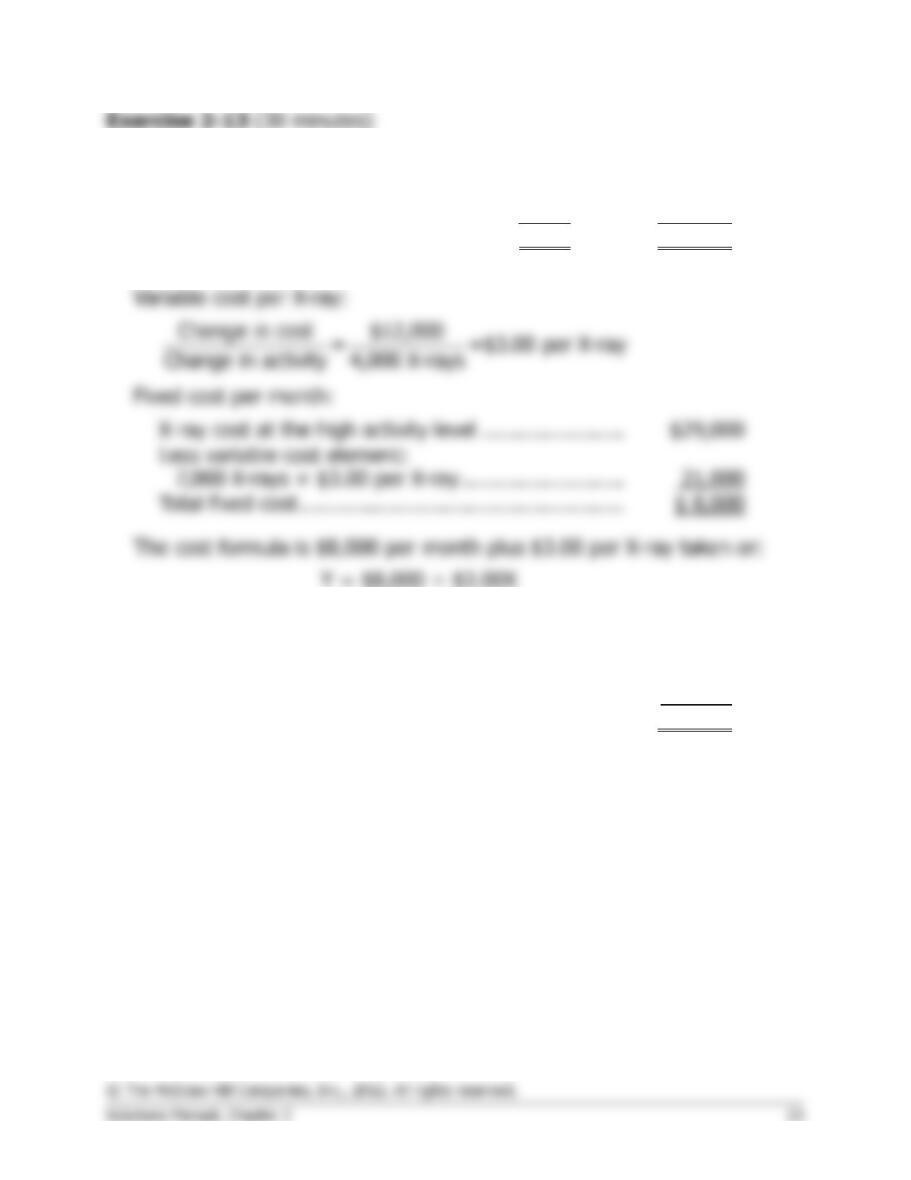
X-rays Taken
X-ray Costs
High activity level (February)……..
7,000
$29,000
Low activity level (June) …………..
3,000
17,000
Change …………………………………
4,000
$12,000
X-ray cost at the high activity level …………………..
Total fixed cost …………………………………………….
2. Expected X–ray costs when 4,600 X-rays are taken:
Variable cost: 4,600 X-rays × $3.00 per X-ray …………
$13,800
Fixed cost ………………………………………………………
8,000
Total cost ……………………………………………………….
$21,800
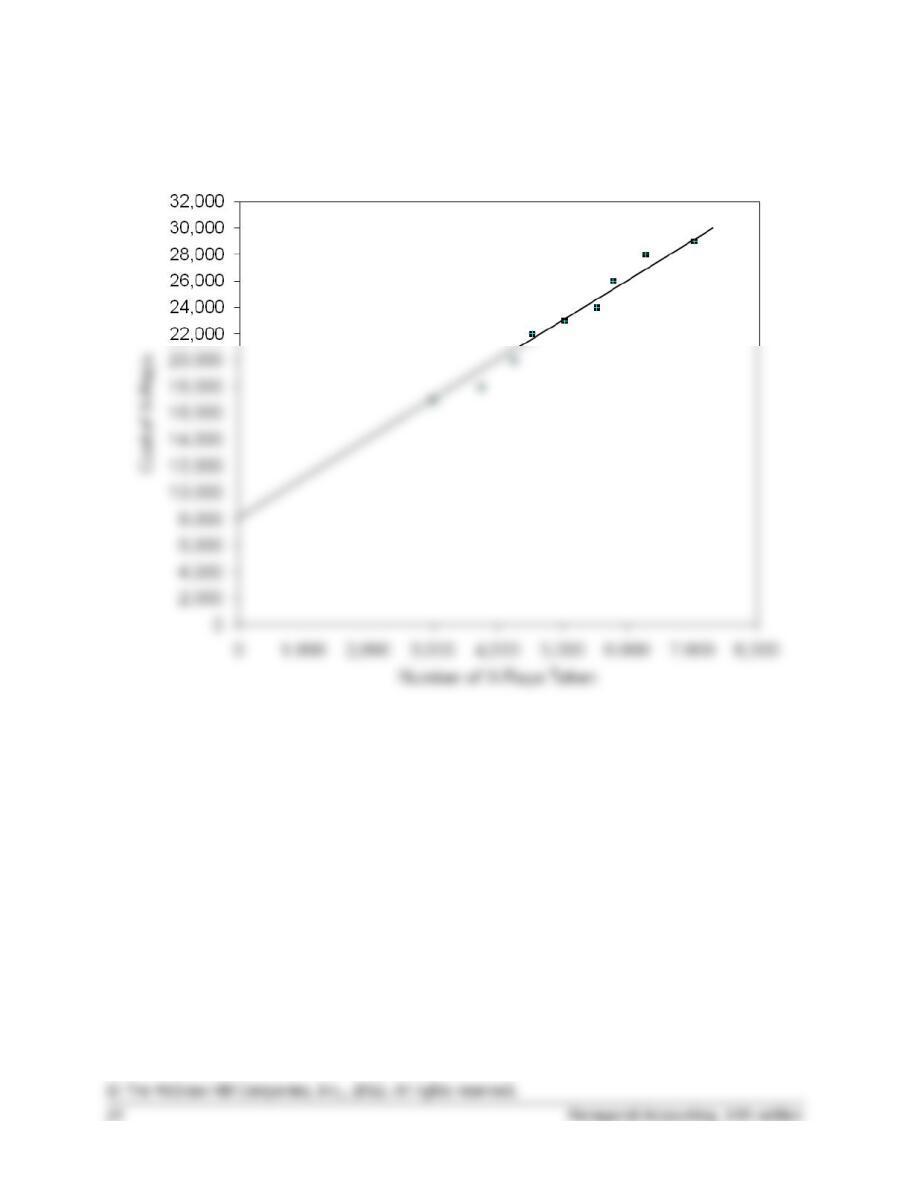
Exercise 2-13 (continued)
3. The scattergraph appears below.