25-1
Morrissey Forgings, Inc.
Teaching Commentary
OVERVIEW
This is a very rich case that will easily support a full class period (ninety minutes) of good discussion. On the surface,
the issue is “ABC.” The company proposes to drop the stoves product line for 1986 because their accounting reports
ANSWERS TO ASSIGNMENT QUESTIONS
Question 1
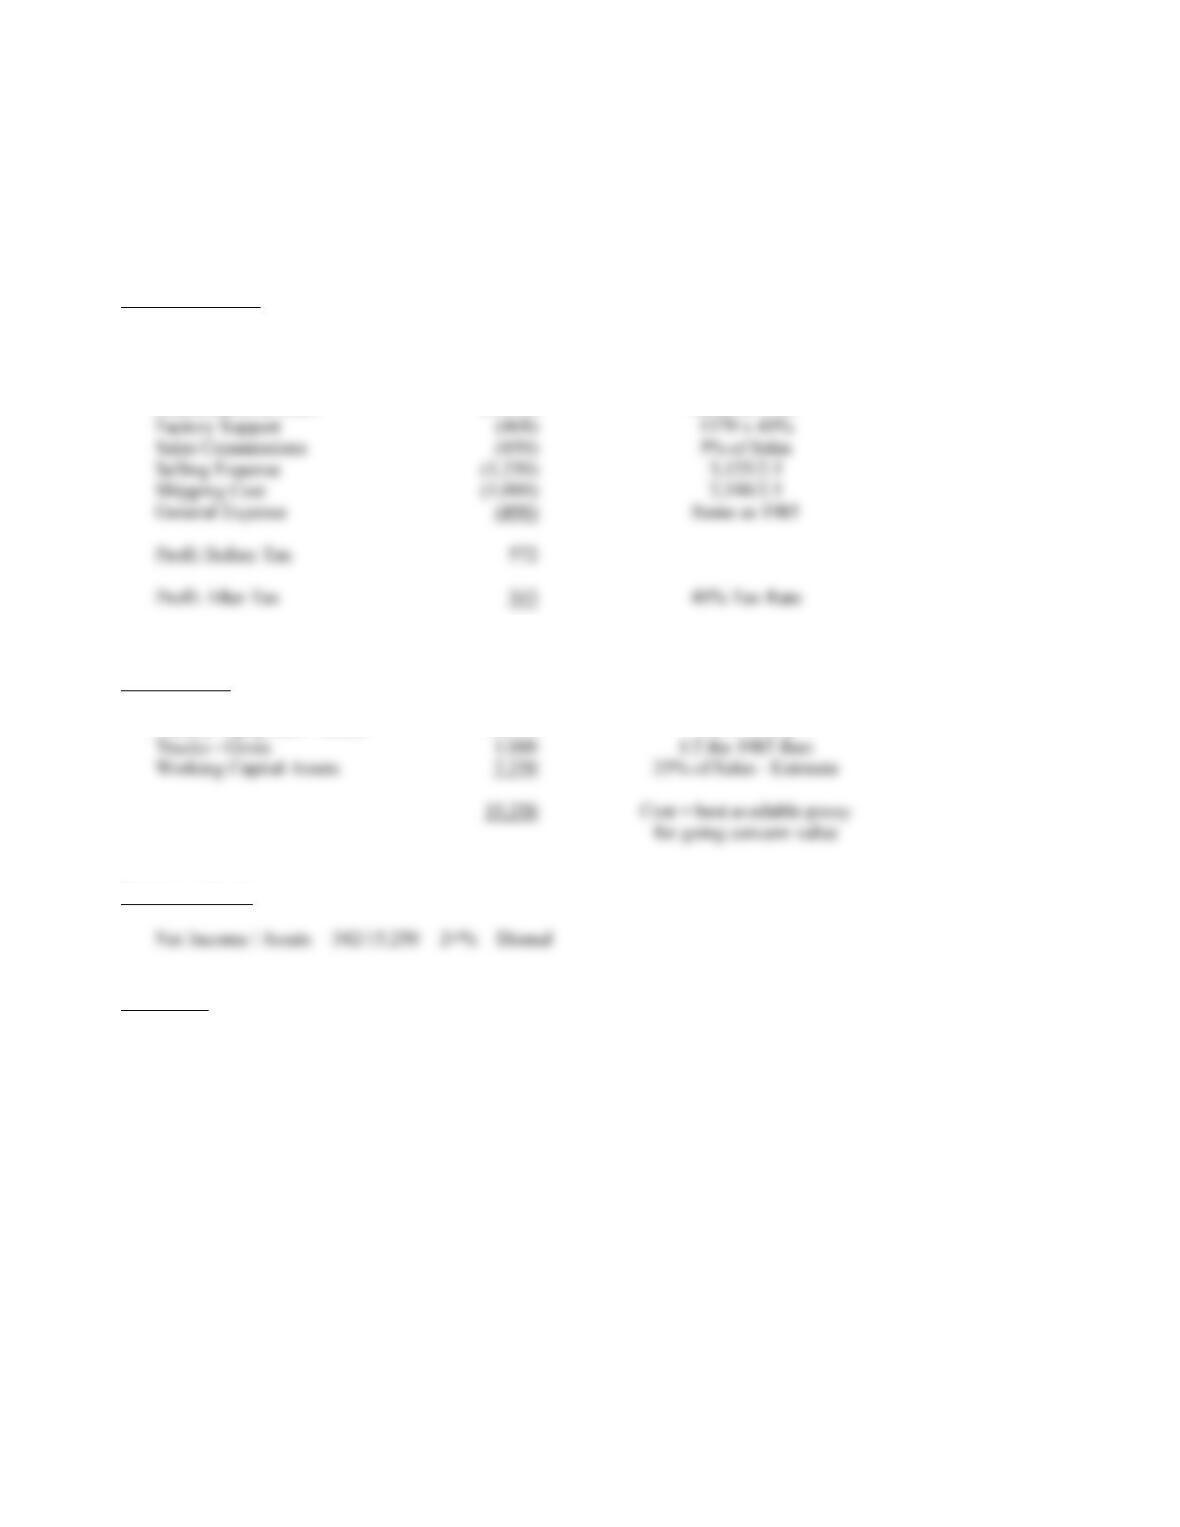
The idea here is to force students to estimate the financial statements for the year before the oven product line
was introduced. Exhibit A shows our estimate, with explanations. The conclusion is that the business was definitely in
trouble in 1983. It clearly needed some kind of major boost.
Question 2
The idea here is to take a closer look at the product line profitability breakdown from Exhibit 1 of the case using
ABC.
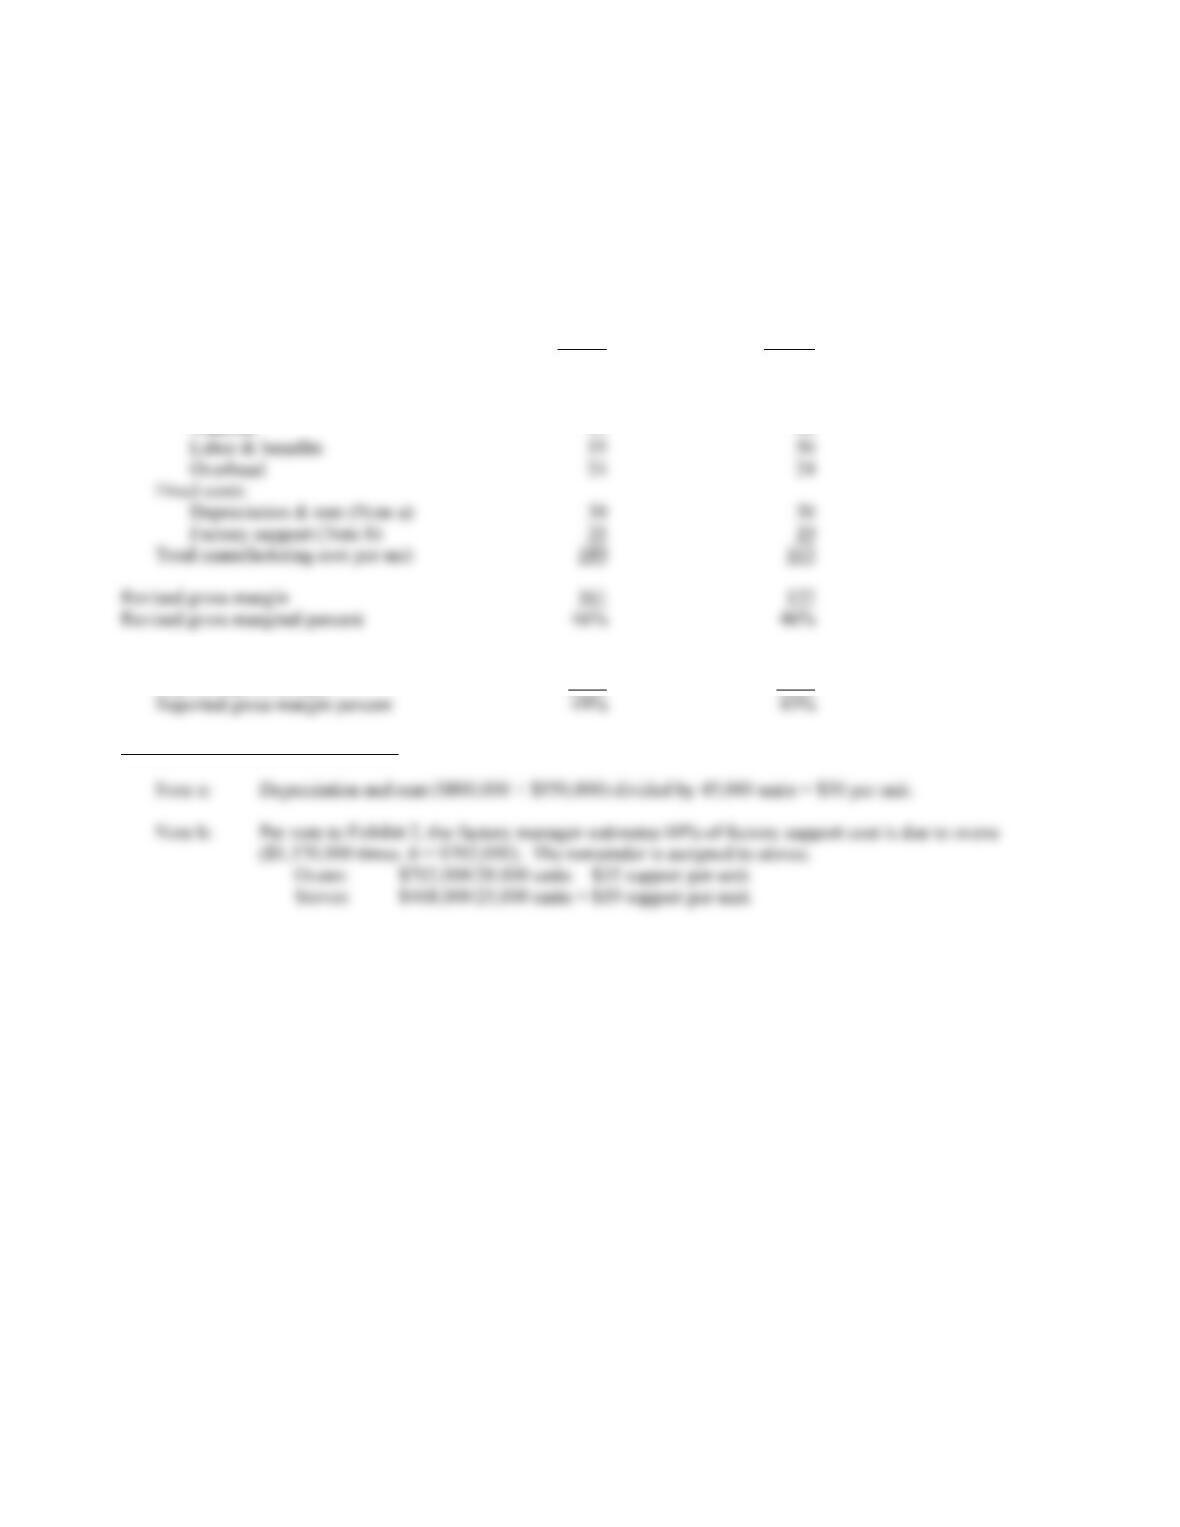
A. Activity Analysis of Manufacturing Costs
The cost system being used by MFI is a traditional full-absorption system in which all manufacturing costs are
treated as product costs. Fixed factory overhead costs are allocated equally over all production units. Within fixed
B. Activity Analysis of Nonmanufacturing Costs
A “full cost” approach to cost allocation considers all costs, manufacturing and nonmanufacturing. The latter
consists of operating expenses such as design, marketing, selling, distribution, service costs, and administrative costs. In
25-2
and shipping costs. An estimation of the activities that
drive selling and shipping costs can identify a more
suitable base for assigning these costs.
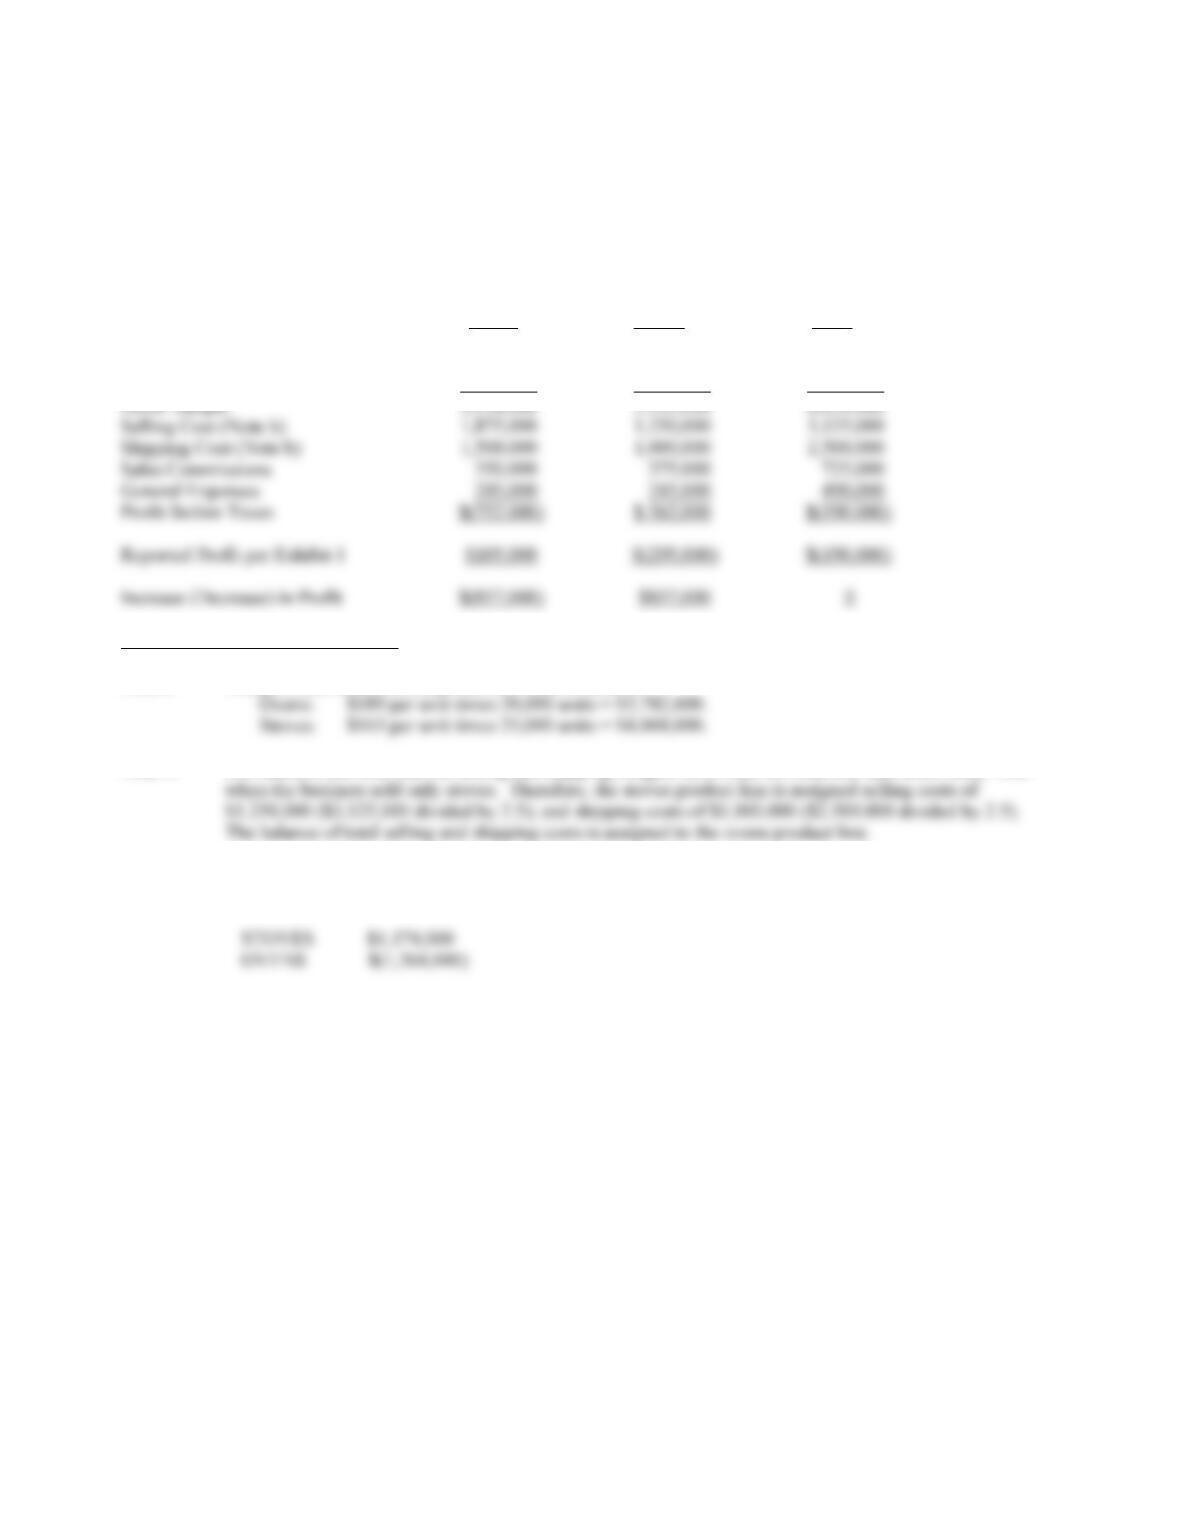
In contrast to Exhibit 1 in the case, the profit and
loss by product line in Exhibit C shows ovens with a loss
of $752,000 and stoves with a $562,000 profit. This is a
direct reversal of profit and loss position between the two
Question 3
Morrissey believes this strategic change would
return MFI to profitability in 1986 based on the
information from Exhibit 1. He wants to drop the losing
line and expand the profitable line. But, as shown in
Question 2, he has the profit or loss position reversed.
Also, cutting back from 45,000 total units to 30,000 units
Question 4
In 1983, MFI shipped 30,000 stoves, all in the
to ship ovens in the core area as to ship stoves in the core
area. Ovens will just be added on to the same trucks
going to the same destinations. Total unit shipments in
allocation of shipping cost between stoves and ovens from
Question 2:
Per Question 2
Total
Stoves $.833 million
Ovens $1.667 million
Question 5
Total selling cost in 1983 was $1,250,000. Of
this total, $540,000 (6% $9 million) was for the dealer
By subtraction, we can now calculate the total
cost of “order getting” outside the core area for 1985:
25-3
Per Question 2
A Closer Look Outside
In the Core the Core
Stoves Ovens Ovens
Question 6
Let’s start this question by recalculating the
product line profitability numbers, under ABC, as refined
further in Questions 4 and 5:
Outside
In the Core the Core Ovens
Stoves Ovens Ovens Total
We can then convert all these costs to per unit
amounts before considering ordering costs, as follows:
Core Outside the Core
Stoves Ovens Stoves Ovens
Price $ 300 $ 350 $ 300 $ 350
COST PER ORDER: $142 $206
expect to get big enough orders to make it worthwhile to
do business there. This means we really should stop
trying to do business in the broader market area outside
line. This is a good idea.
Should we worry about cannibalization of stoves
in the core? Not really. If a customer who otherwise
would not buy a stove buys an oven, we have gained an
extra customer. If a customer switches from our stove to
our oven, we gain $18 per unit in net margin (before order
costs). Either way we win.
Some students will be inclined to stop here (if
they get this far). But, as is typical in this book, the
Promotional Allowance 315 (6% x 5,250)
Shipping 1,500
“Order Getting” 1,545
Variable Manufacturing 1,860 (124 x 15,000)
Factory Support 527 (1,170 x 60% x 3/4)
Revised PBT 569
25-4
$341/15,300 = 2+% = dismal!
This looks a lot like the situation MFI faced in
1983. So, after all the adding and dropping of products
and market areas, we are right back where we started—in
deep trouble.
Based on case information, it really isn’t clear if
Maybe the best bet is a strategic “merger,” unless
Morrissey can come up with new products to make with
TEACHING STRATEGY
In class, we go through the assignment questions, one at a
time, trying to follow the logic outlined in the suggested
answers here. Students generally don’t have much trouble
getting through Questions 1, 2, and 3.
Question 4 is tougher, but not too bad.
Questions 5 and 6 are challenging and will cause
a lot of questions, disagreement, and confusion. They are
Question 7 is a “throw away” since we really
don’t have any rabbits to pull out of the hat! It is worth
25-5
Exhibit A
1983
Estimated Financial Statement
(000)
Income Statement
Sales 9,000 30,000 x $300
Var. Mfg. Cost (3,420) $114 x 30,000
Depreciation & Rent (1,350) Same as 1985
Balance Sheet
Factory Equipment – Gross 12,000 800 x 15 yrs.
Return on Assets
Conclusion — The business was slowly “liquidating” in 1983 and definitely needed something new.
25-6
Exhibit B
Activity Analysis of Manufacturing Costs
20,000 25,000
Ovens Stoves
Manufacturing cost per unit:
Variable costs:
Material 45 40
Per Exhibit 1:
Reported gross margin $170 $130
25-7
Exhibit C
ABC Summary with
Activity Analysis of Nonmanufacturing Costs
Ovens Stoves Total
Sales $7,000,000 $7,500,000 $14,500,000
Cost of Goods Sold (Note a) 3,782,000 4,068,000 7,850,000
Note a: Using revised manufacturing unit cost from Exhibit 2:
Note b: It is stated in the case that the selling and shipping budgets have risen two and one-half times since 1983
USING THE REFINEMENTS FROM QUESTIONS 4 AND 5, ESTIMATED PRODUCT LINE PROFIT IS:
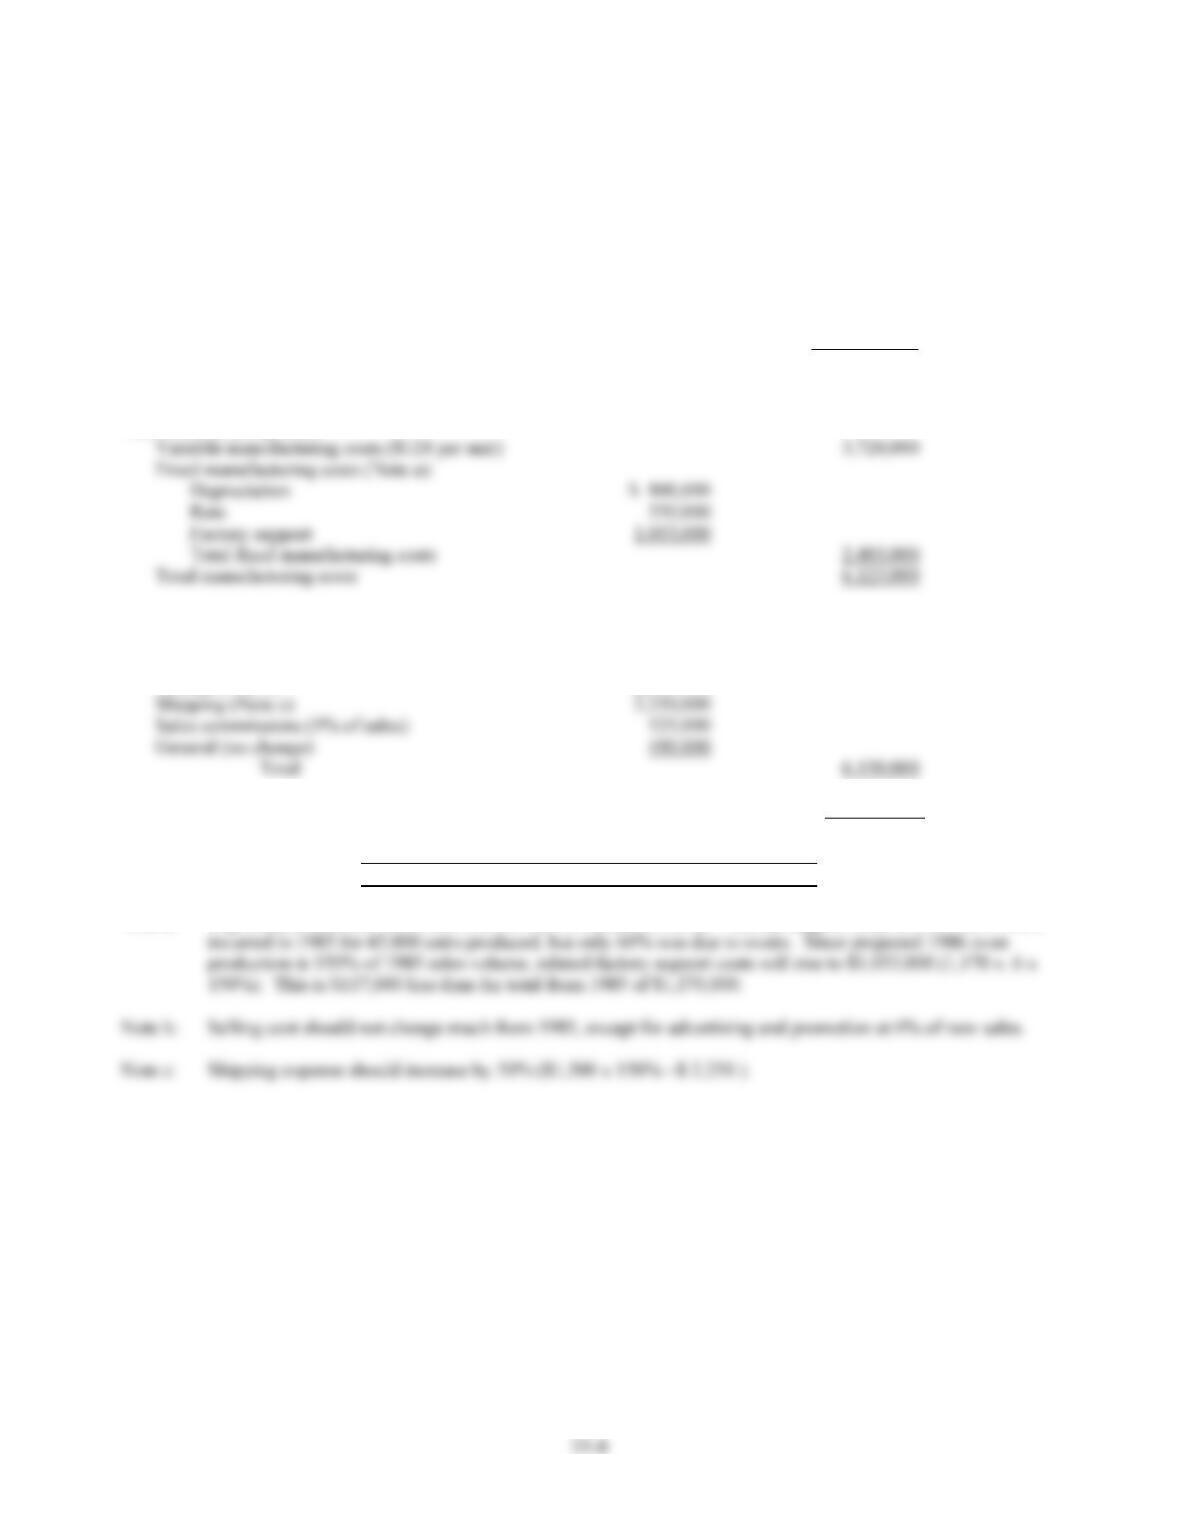
Exhibit D
An ABC Look at the Management Decision to Drop Stoves
Projected 1986 Profit or Loss – Ovens Only
30,000 Ovens
Sales revenue ($350 per unit) $10,500,000
Less manufacturing costs:
Gross margin (42% of sales) 4,377,000
Other expenses:
Selling (Note b) 2,885,000
Loss from operations $(1,773,000)
IN SHORT, A DISASTER!
Note a: Depreciation and rent ($800,000 and $550,000) remain the same. Factory support costs of $1,170,000 were