1-1
American Investment Management Services
(AIMS)
Teaching Commentary
OVERVIEW
This case deals with customer profitability analysis in the retail investment services business in the year 2000. It is
based on a large and well-known firm that prefers to remain anonymous.
There are three distinct “layers” to the case. At the first level, the issue is ABC analysis for selected
“problem customers.” The case illustrates a simplified version of an ABC system actually installed at the company
in 2000. Students typically are able to handle this level of the analysis relatively easily.
ANSWERS TO ASSIGNMENT QUESTIONS
Question 1
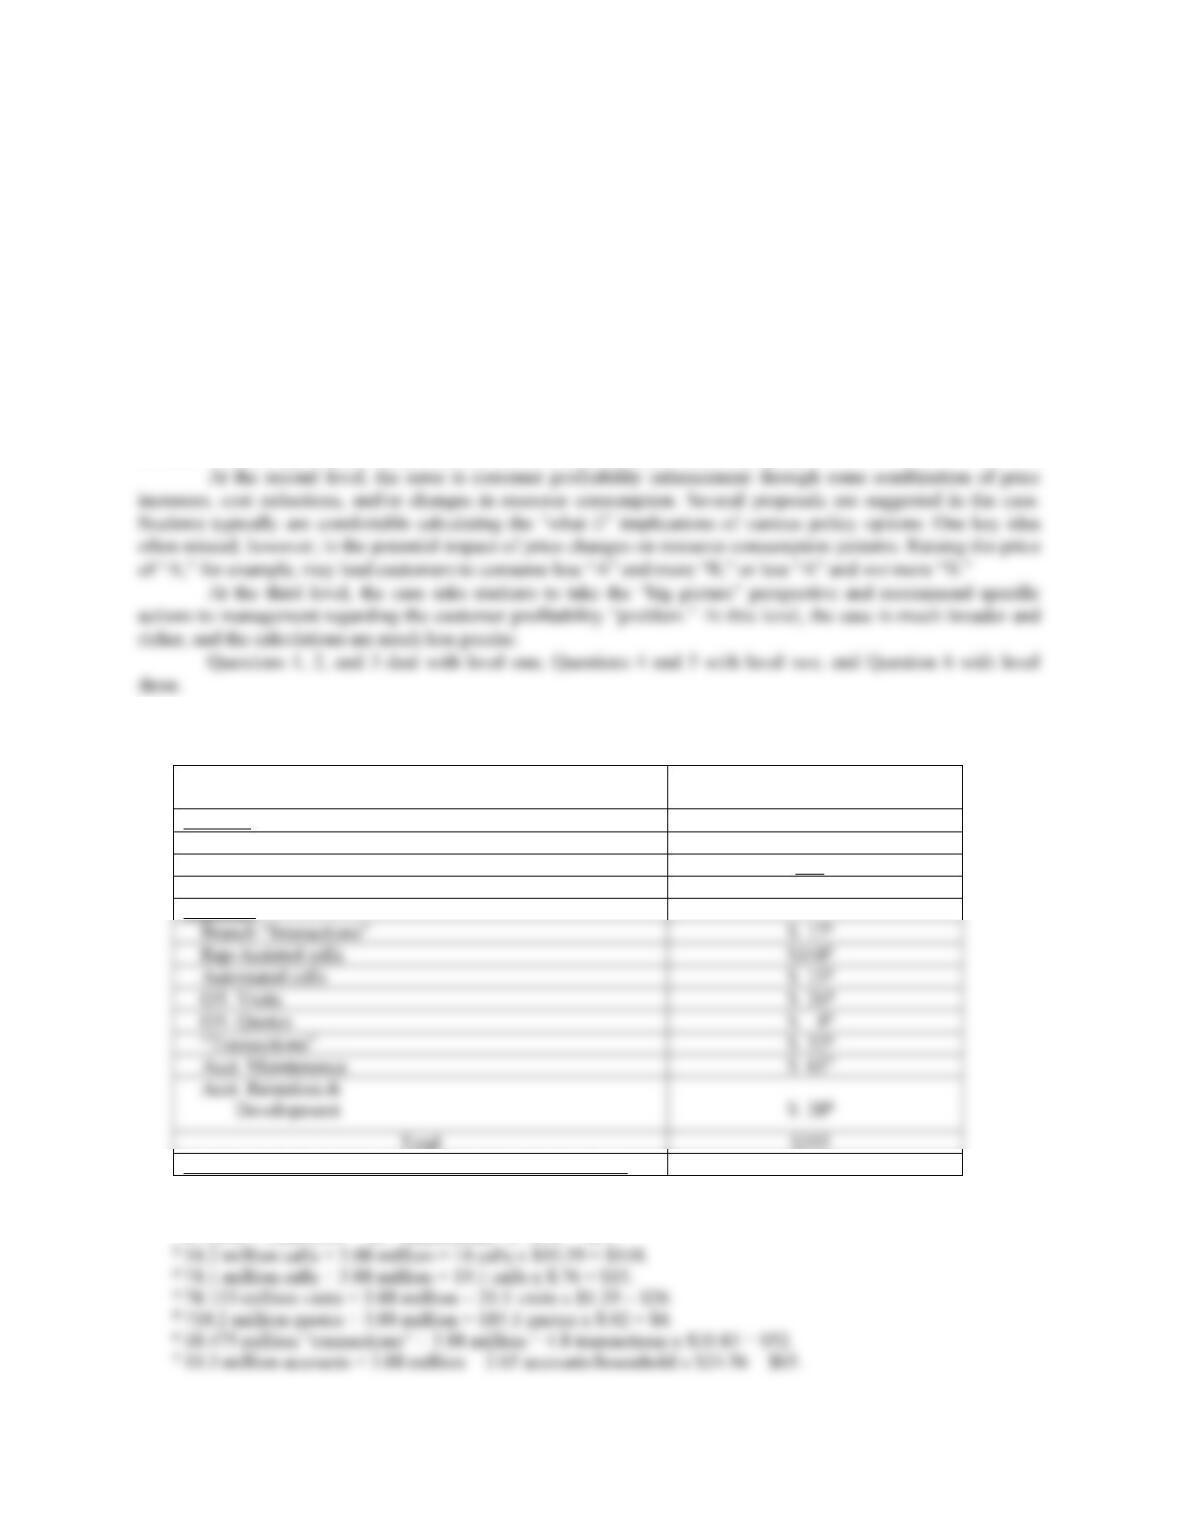
Overall Average
Household
Revenue
MF Fees
320
Brokerage Fees
240
Total
$560*
Expenses
Rep-Assisted calls
O/L Visits
Acct. Maintenance
$355
Net Margin before Acquisition and Account Set-up Costs
$205
*$2.173 Billion ÷ 3.88 million = $560/household.
1 875,000 ÷ 3,880,000 = .23 “Interactions” x 74.51 = $17.
1-2
8 $560. revenue/household x 5% = $28.
Question 2
1) The profit potential from the 389,000 tenth decile-losing customers is huge at $124 million for 1999.
4) The per household magnitude of high profitability and unprofitability (the two tails of the distribution)
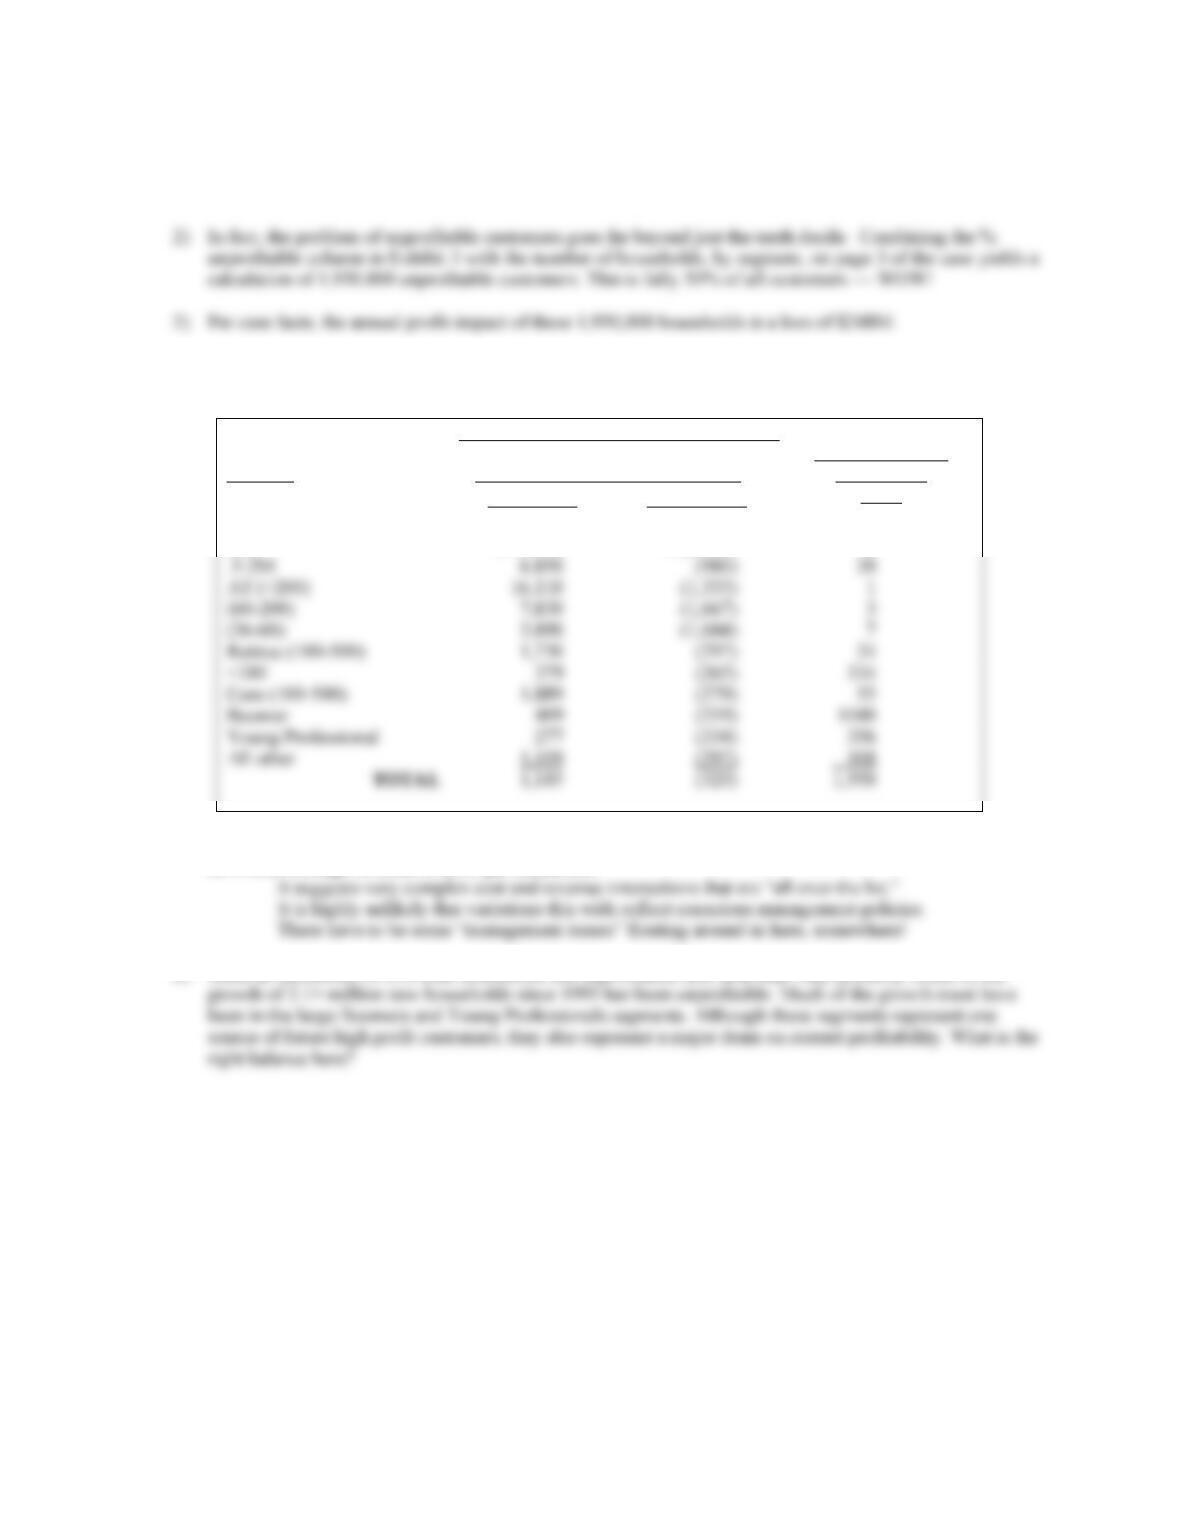
varies widely across the eleven customer segments, as shown below.
Per Household Profit and Loss
Segment
1999 .
# of Unprofitable
Households
(000)
First Decile
Tenth Decile
2M+
$ 38,900
$ (2,187)
2
AT (>200)
1
(60-200)
3
(36-60)
7
<100
Core (100-500)
Young Professional
All other
5) This variability is incredible — from almost 39,000 positive profit to more than $2,100 loss, per household,
on overall average revenue of $560 per household!
6) Since an incredible 50% of total households are unprofitable, also note that, very probably, much of the
1-3
Question 3
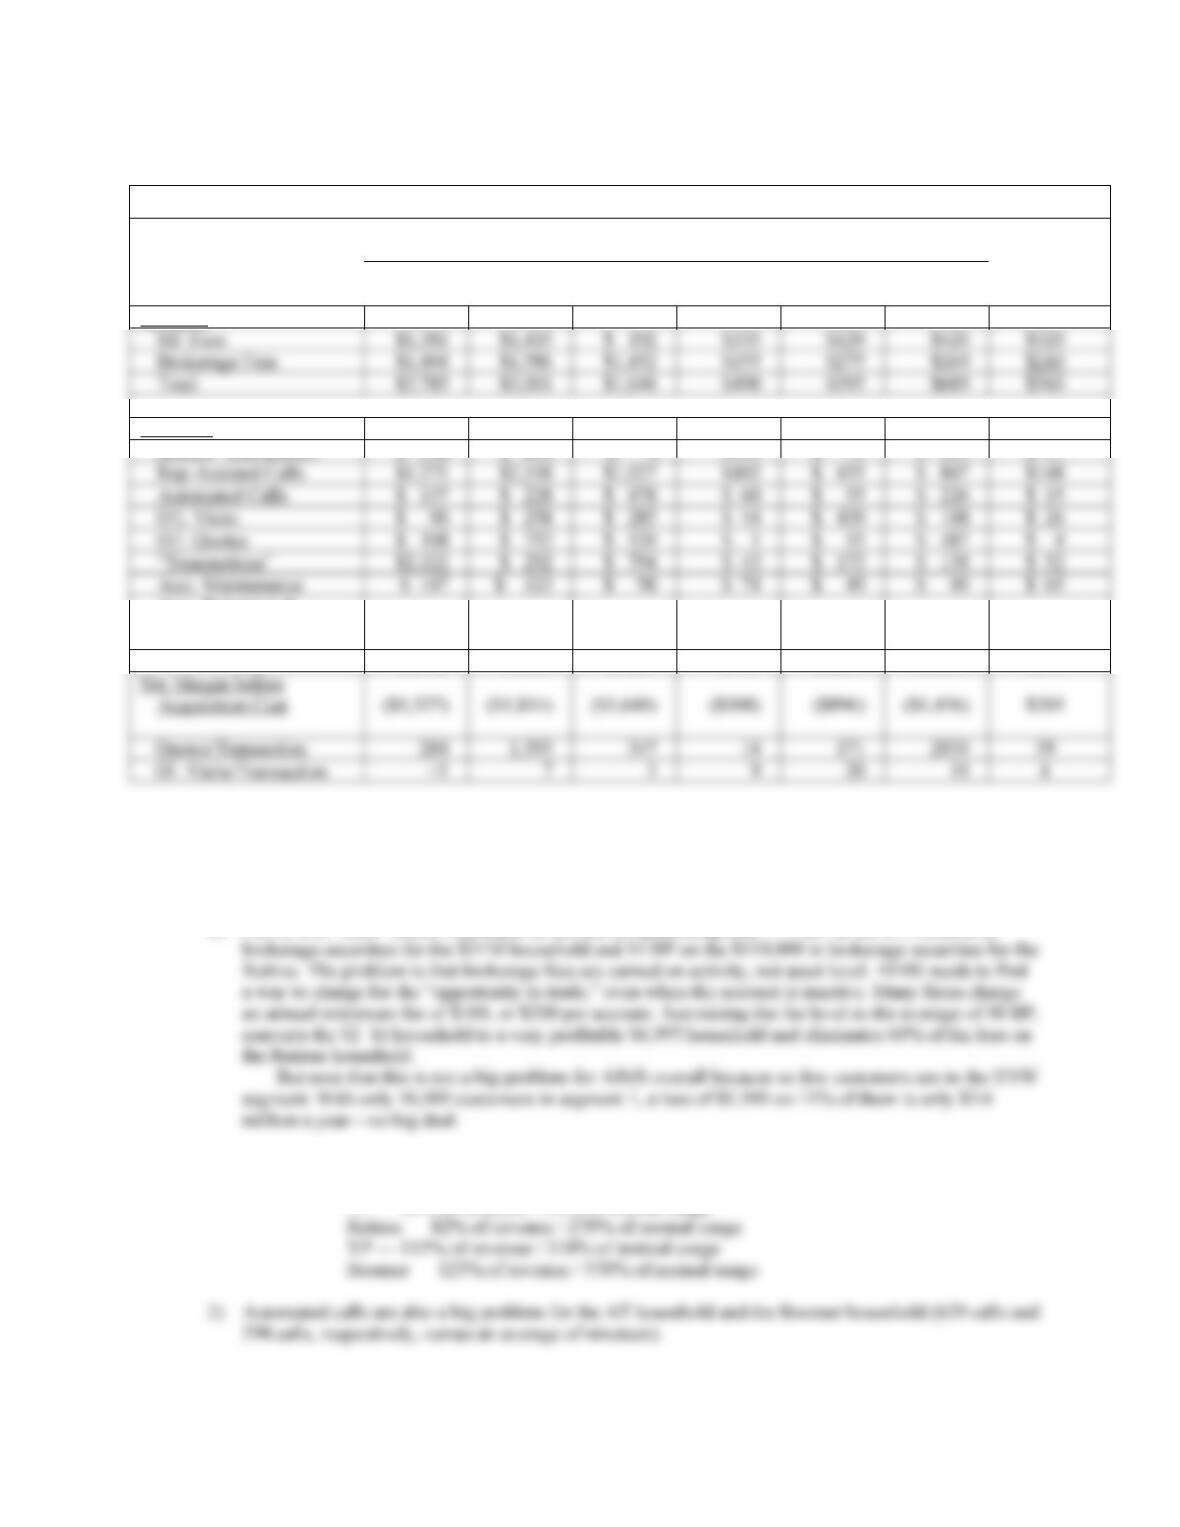
Household Profitability
Selected 10th Decile Customers – By Segment Overall
2+M
.5M-2M
AT
(60-200)
Retiree
(100-500)
YP
Boomer
Average
Household
Revenue
Expenses
Branch “Interactions”
$ 298
$ 894
$ 0
$149
$ 75
$ 224
$ 17
$ 137
$ 228
$ 478
$ 55
$ 15
$ 108
$ 752
$ 520
$ 55
$ 487
$2,122
$ 292
$ 794
$ 173
$ 130
$ 52
$ 98
$ 49
$ 49
Acct. Retention &
Development
$ 139
$ 150
$ 82
$ 25
$ 20
$ 34
$ 28
Total
$4,312
$4,815
$3,284
$798
$1,291
$2,145
$355
Question 4
Some of the problem in the tenth decile is revenue, rather than cost.
1) Part of this is just not enough assets under management in relation to servicing cost — $143K for the
Active Trader, $48K for the Young Professional, and $58K for the Boomer.
2) Part of it is “dead” assets, which just sit around not generating fees — 4 BP on the $3.3 million in
On the cost side:
1) One issue is call volume through Reps—Rep-assisted calls for several of the households:
AT — 62% of revenue / 700% of normal usage
$1,381
$1,415
$ 192
$335
$120
$420
$1,404
$1,586
$1,452
$155
$275
$269
$2,785
$1,644
$490
$395
$689
1-4
3) Even though web visits are much cheaper than calls or branch interactions, they are still a problem for
5) There is no explicit evidence in the case about cost levels for AIMS versus “benchmarked norms” (best
in class) for various processes. My bet, however, is that their positioning as a full-line service provider
The basic theme on profit per household is that different items are most important for different households — the
story is different for each segment:
• pricing
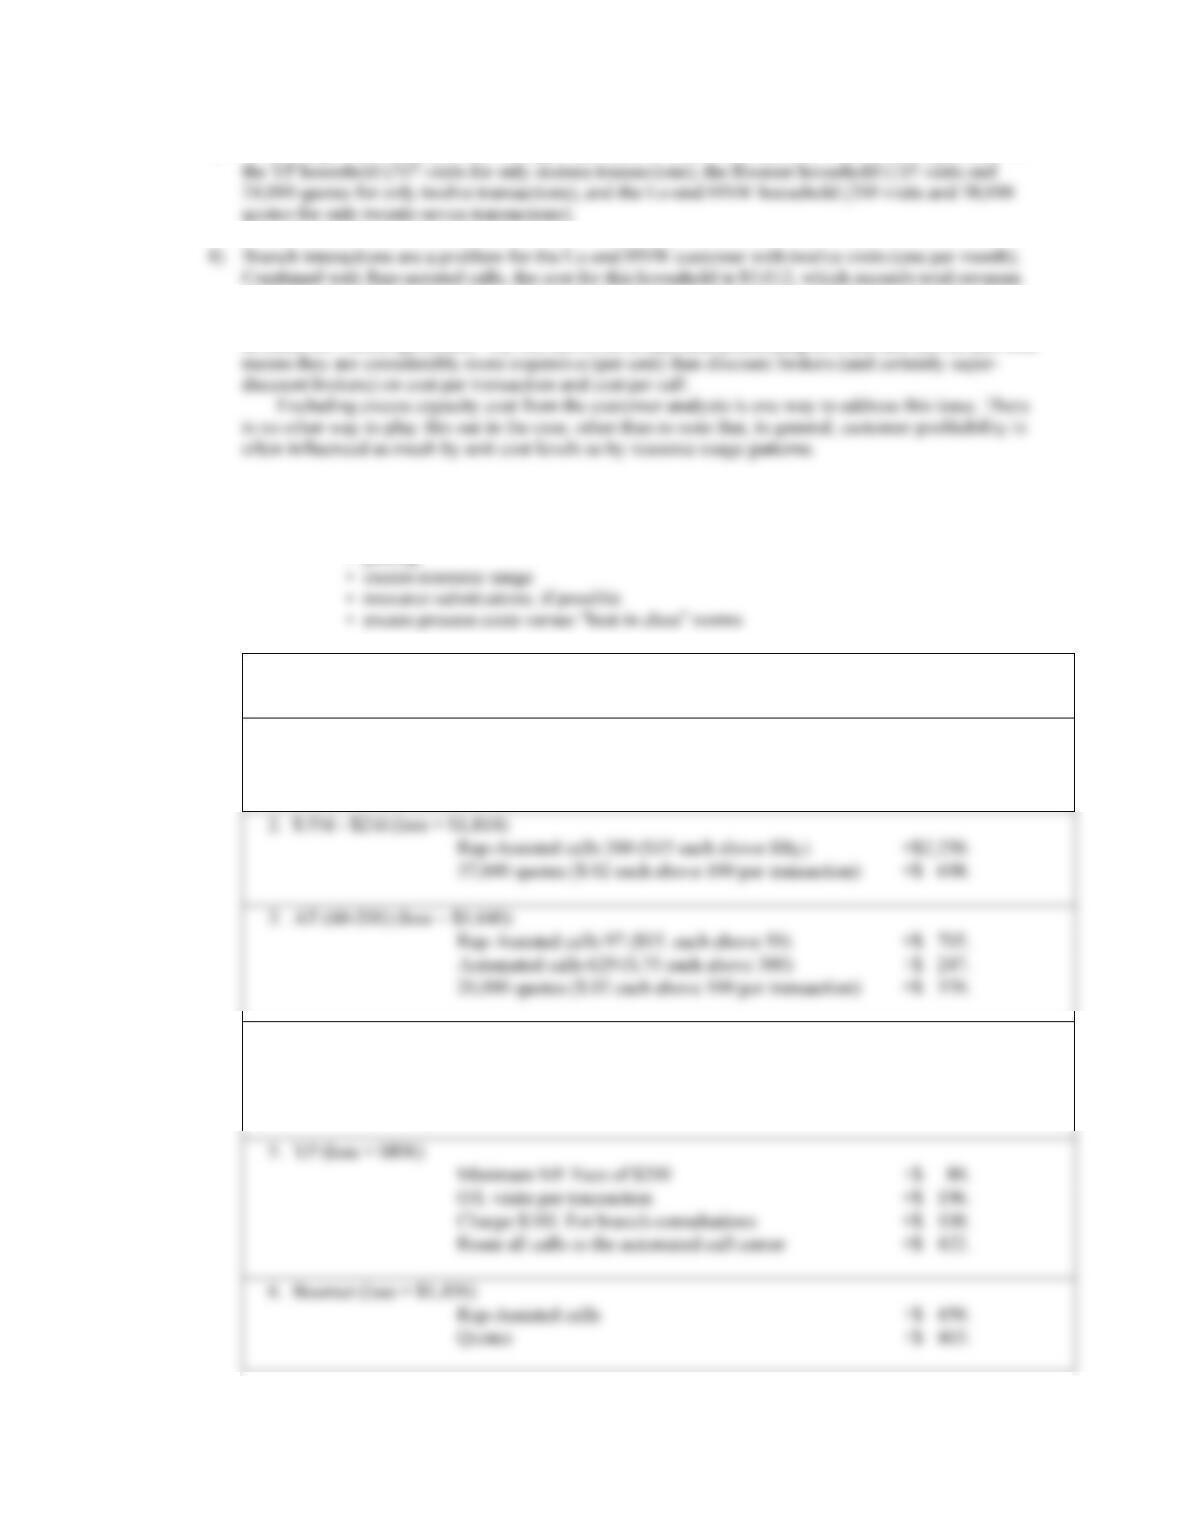
Some specific remedies for the loss situation for each of the six selected households:
1. $2M + (loss = $1,527)
Rep-Assisted calls 120 ($15 each over fifty calls)
+$1,050.
Minimum fee on brokerage assets (20 BP)
+$5,160.
2. $.5M – $2M (loss = $1,814)
Rep-Assisted calls 200 ($15 each above fifty)
+$2,250.
3. AT (60-200) (loss = $1,640)
Rep-Assisted calls 97 ($15. each above 50)
+$ 705.
Automated calls 629 ($.75 each above 300)
+$ 247.
4. Retiree (100-500) (loss = $308)
Lo Brokerage revenue ($200 minimum)
+$ 45.
5. YP (loss = $896)
Minimum MF Fees of $200
+$ 80.
O/L visits per transaction
+$ 196.
Charge $100. For branch consultations
+$ 100.
6. Boomer (loss = $1,456)
Rep-Assisted calls
+$ 450.
Rep-Assisted calls seventy-nine ($15. each above
fifty)
+$ 435.

1-5
As shown on the previous page, these proposals could eliminate most (or even all) of the loss on the selected
Question 5
If AIMS cut back to three million active households by eliminating the 880,000 most unprofitable
households, and retained a 10% excess capacity cushion for future growth, 30% of current cost could be eliminated:
1) 1995 excess capacity = 10%, per the case. With 1.8 households, capacity was 2M (1.8 ÷ .9).
With higher than average resource usage for these 880,000 households, the potential cost saving is even larger. This
calculation assumes “average” resource consumption for all households, which is clearly wrong. Taking
Question 6
My assessment of the overall situation is that AIMS lacks a sufficiently clear strategic focus to guide
growth and to monitor pricing decisions and customer resource consumption patterns. Phenomenal growth and
unrelenting prosperity in the capital markets in the last half of the 1990s have masked a fundamental problem in the
customer set.
It is not healthy when 50% of the customers are unprofitable — 59% of the huge Boomer segment and 86%
of the YP segment. It is easy to say that these customers represent future HNW households on which AIMS earns

1-6
someday. AIMS provides a slate of services that are designed to make it the vendor of choice. In my view, the
current situation involves probably a million or more households for whom offering the slate of services constitutes
I also believe that AIMS should reduce the level of excess capacity to reduce the drain on current
profitability. At a minimum, don’t charge excess capacity to current customers. Show it in aggregate as a corporate–
level expense each month and stop asking current customers to subsidize it. The current total is about $409 million
—160% of profit! Showing this, explicitly, every month will call lots of attention to the profit impact of the
commitment. My bet is that highlighting it explicitly would lead to a serious reconsideration of its appropriateness.
Burying it diffuses the issue by removing it from management consciousness.
I don’t see AIMS as a conduit for middle-class Americans to become “investors.” I see it as a vehicle
created to generate wealth for HNW Americans, at a price. PricewaterhouseCoopers notes that there are currently
twenty-two large firms in the United States chasing that same “dream.” I think AIMS has lost critical focus on that
target audience. This admittedly cold-hearted assessment of the current strategic misalignment goes a long way in
explaining why AIMS gives back almost half of its potential profit each year ($248M loss included in $251M
overall margin).