14 Solutions for Chapter 17
ANS. Deteriorated vendor relations may result from non-timely payment of bills.
SP 17-3 ANS. a. Because the parallel approach affords more control than the other
approaches, it might be used when the organization considers it
particularly important to ensure the integrity of the new system. Also,
because the old system and new system must both be operated, there must
Problems
P 17-1 ANS. Each student will likely provide a different solution to the problem. Frequently,
the failure manifests in the implementation phase but occurs much earlier in the
Accounting Information Systems, 10e 15
P 17-2 ANS. Students may identify any of a wide variety of sources of software do not require
heavy investment in hardware and/or software. One example that students are
usually familiar with is Google Documents. In addition to Google providing the
P 17-3 a. ANS.
1. To determine the underlying causes of JW Office Supplies’ problems. For
example:
• Is the company’s high customer turnover caused by dissatisfaction with
quality of goods, with frequent shipping delays, or with too stringent a
credit policy?
2. To determine the scope of the identified problems. For example, is the
customer turnover problem confined to Order Entry/Sales (credit policies) or
does poor product quality require that purchasing policies and procedures be
examined?
16 Solutions for Chapter 17
cost-benefit analysis will be performed? By what date should the
specifications be completed?
b. ANS. Costs and benefits are dependent on the solution chosen. Some costs that must be
quantified for determining the economic feasibility of a computerized solution
include the following:
• Hardware rental, lease, or purchase
Some quantifiable benefits that may pertain include the following:
• Reduction in clerical expense
• Savings due to better control in purchasing
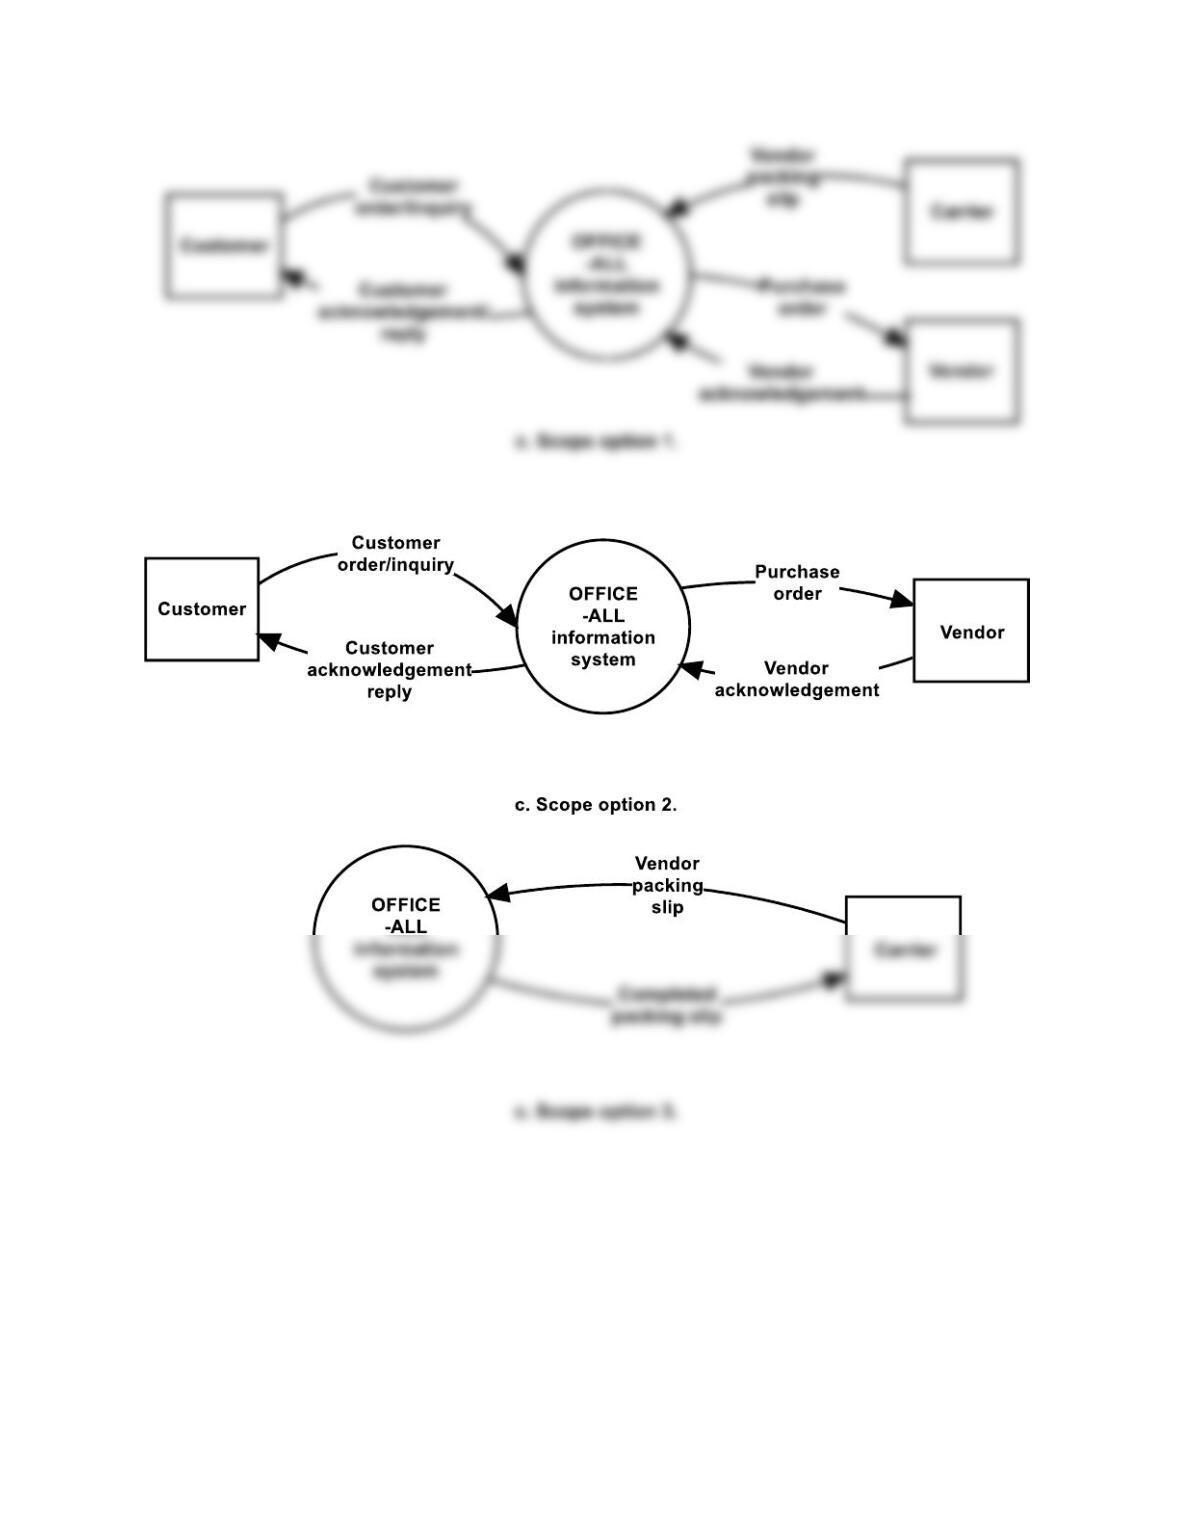
c. ANS. The three scopes for the systems analysis are depicted in Figure SM-17.1. Scope
option 1 assumes that the problem involves excessive stock-outs and poor vendor
selection. Scope option 2 assumes that there is inadequate market analysis leading
Accounting Information Systems, 10e 17
FIGURE SM-17-1 Problem 17-3, Part c, Solution
18 Solutions for Chapter 17
P 17-4 a. ANS.
1. Graphs depicting population trends over the past several years and projections
over the relevant time horizon, say five years. The statistics, available from
census compilations, should be broken down by geographical region. If the
2. Graphs showing admissions trends at other colleges. The institutions studied
should be those that service the same segment of the student population in
terms of academic focus, perceived quality, location, and/or cost. This
approach may support a hypothesis that the problem is not confined to the
particular university or may indicate a direction for further inquiry.
3. Compilation of surveys sent to alumni to determine areas that may need
bolstering. The answers may be formatted on a numerical scale according to
4. Compilation of questionnaires sent to high school guidance counselors. The
focus is on the counselors’ specific bases of recommendation for choosing a
college for their advisees. Again, the survey should be structured to allow both
numerically scaled responses and narrative.
5. Study of the college’s admissions office. This may be done on a
supplementary basis or if the preceding steps did not yield clear results.
Among the many areas that may be looked into are the following:
Accounting Information Systems, 10e 19
b. ANS 1. Questionnaires sent to those students opting to attend other colleges. From
these, the following may be assembled:
• List of colleges chosen
2. Profiles of the incoming freshman class and of accepted students who went
elsewhere. The source of this information is the application form. Presentation
of the results may include the following:
• Thematic maps showing distribution of home towns
c. ANS 1. To examine the situation in the widest context, graphs showing nationwide
trends in employment and earnings. Finer tuning may be achieved by first
focusing on the economic condition of the company’s target market and then
on the company’s actual clientele.
20 Solutions for Chapter 17
d. ANS. 1. Line graphs showing class signup and college enrollment patterns. These may
be plotted either separately or against each other to show whether the decline
is part of an overall drop in attendance at the college.
2. Graphs showing patterns of participation in the major in which the course is
situated and in the economic health of the major’s related industries.
P 17-5 NOTE: The provided solution has the detail that can be used in a basic spreadsheet
format. Alternatively, students may use spreadsheet formulas to compute items such as
the discount factors and NPV.
a. ANS. Outright Purchase
Time
Item Description
Cash Flow in
Nominal $
Discount Factor
@ 12%
Discounted Present
Value
0
UPP
($120,000)
0
Sales tax
0
Installation
Accounting Information Systems, 10e 21
Time
Item Description
Cash Flow in
Nominal $
Discount Factor
@ 12%
Discounted Present
Value
1–5
Annual cash flows:
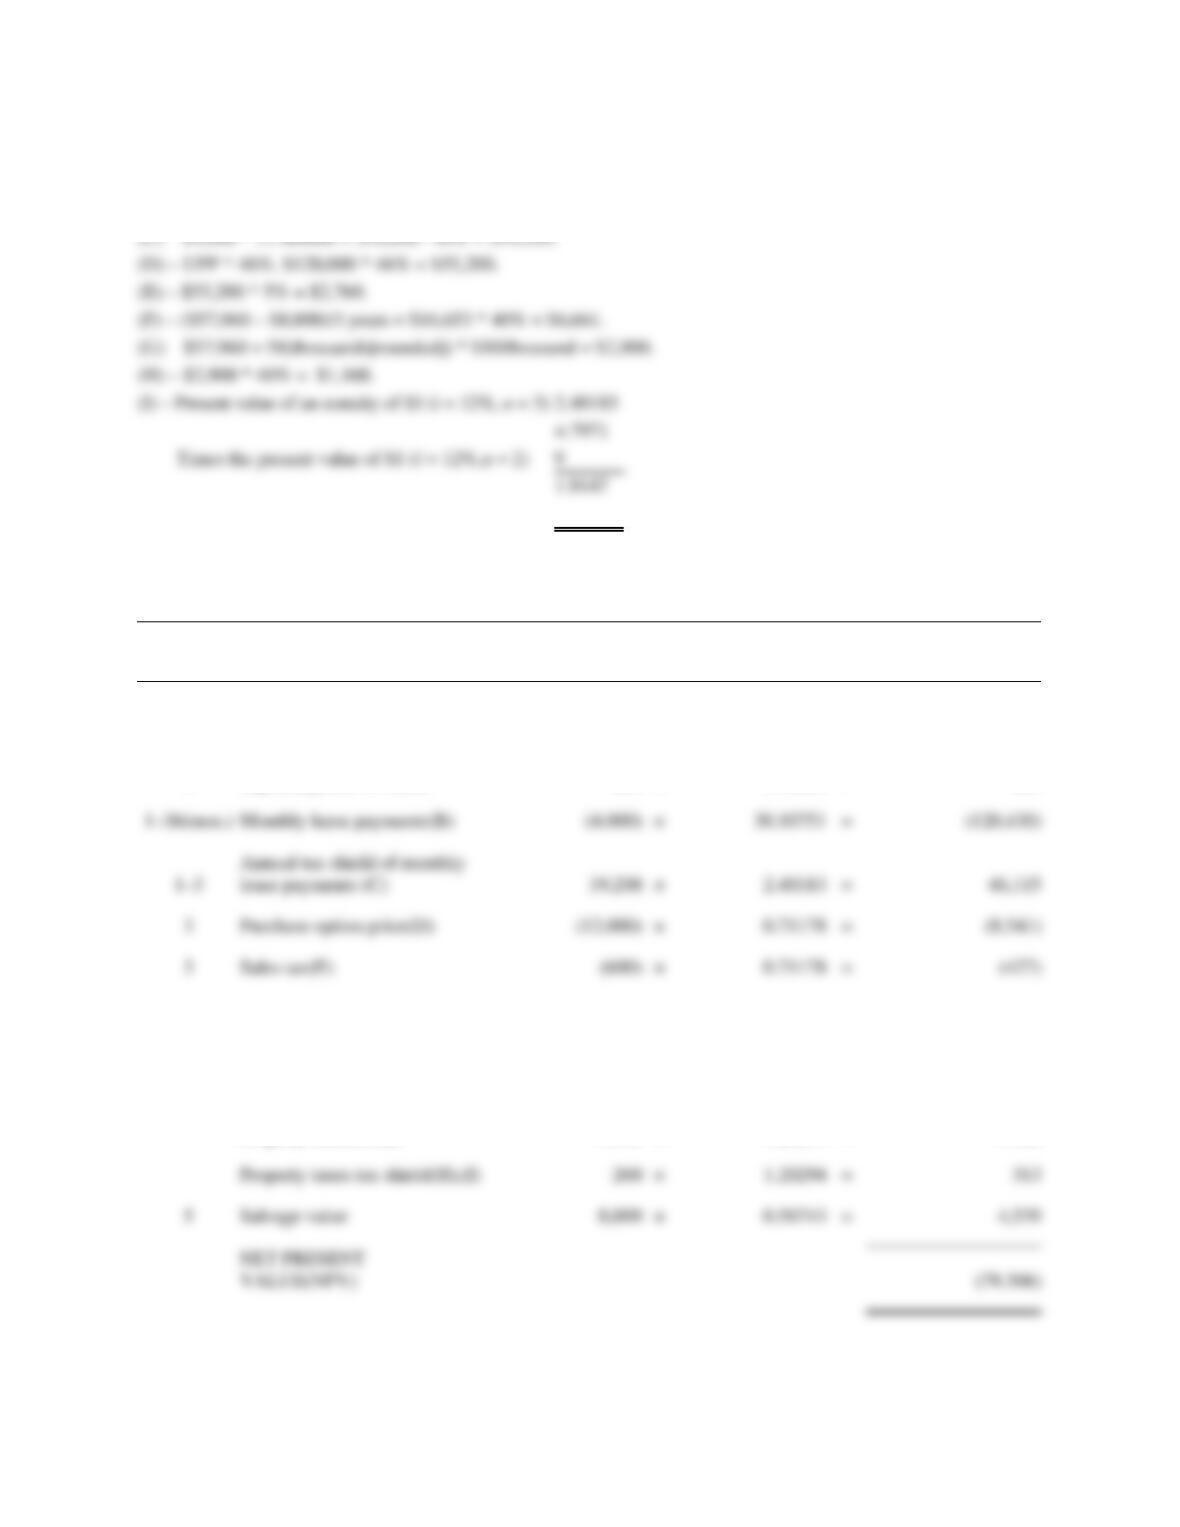
b. ANS. Lease with Exercise of Option to Purchase at End of Year 2
Time
Item Description
Cash Flow in
Nominal $
Discount Factor
@ 12%
Discounted Present
Value
0
Destination, unpacking, and
so on
(2,000)
×
1.00000
=
(2,000)
0
Tax shield of destination,
unpacking, and so n(A)
×
1.00000
=
Monthly lease payments(B)
(4,000)
×
=
1–2
Annual tax shield of
monthly lease payments (C)
×
1.69005
=
32,449
2
Purchase option price(D)
×
0.79719
=
2
Sales tax(E)
(2,760)
×
0.79719
=
(2,200)
3–5
Annual cash flows:
Dep,n. tax shield(F),(I)
6,661
×
1.91471
=
12,754
Property taxes(G),(I)
(2,900)
×
1.91471
=
(5,553)
Property taxes tax
shield(H),(I)
1,160
×
1.91471
=
2,221
5
Salvage value
×
0.56743
=
4,539
VALUE(NPV)
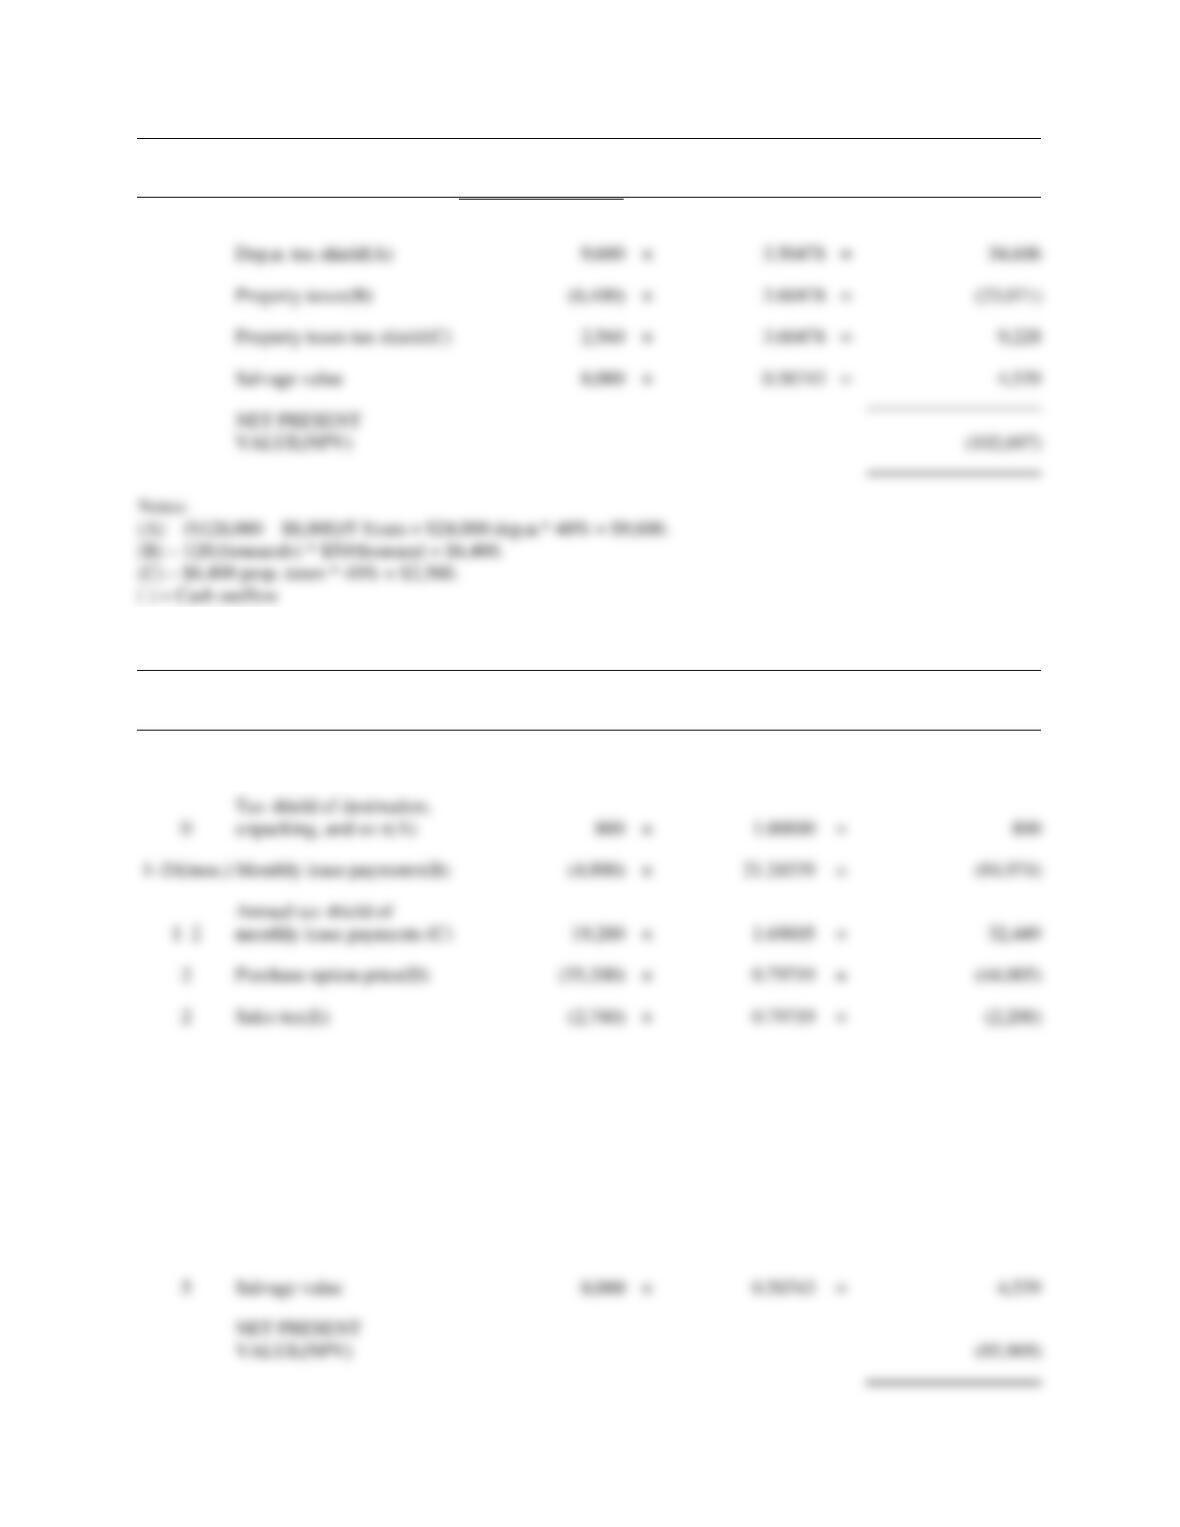
Dep,n. tax shield(A)
Property taxes(B)
(6,400)
×
Property taxes tax shield(C)
2,560
×
9,228
Salvage value
×
4,539
NET PRESENT
VALUE(NPV)
22 Solutions for Chapter 17
Notes:
(A) – $2,000 * 40% = $800.
(B) – Discount factor is for an annuity of 24 periods @ 1% per period.
( ) = Cash outflow.
c. ANS Lease with Exercise of Option to Purchase at End of Year 3
Time
Item Description
Cash Flow in
Nominal $
Discount Factor
@ 12%
Discounted Present
Value
0
Destination, unpacking, and so
on
(2,000)
×
1.00000
=
(2,000)
0
Tax shield of destination,
unpacking, and so on(A)
800
×
1.00000
=
800
Monthly lease payments(B)
(4,000)
×
=
1–3
Annual tax shield of monthly
lease payments (C)
×
2.40183
=
3
Purchase option price(D)
×
0.71178
=
(8,541)
4–5
Annual cash flows:
Dep,n. tax shield(F),(I)
920
×
1.20294
=
1,107
Property taxes(G),(I)
(650)
×
1.20294
=
(782)
Property taxes tax shield(H),(I)
260
×
1.20294
=
313
NET PRESENT
VALUE(NPV)
(C) – $4,000 * 12 months = $48,000* 40% = $19,200.
(D) – UPP * 46%. $120,000 * 46% = $55,200.
(F) – ($57,960 – $8,000)/3 years = $16,653 * 40% = $6,661.
(G) – $57,960 = 58(thousands[rounded]) * $50/thousand = $2,900.
(H) – $2,900 * 40% = $1,160.
2.40183
×.7971
Times the present value of $1 (i = 12%,n = 2)
9
1.9147

Accounting Information Systems, 10e 23
d. ANS Lease with Renewal at the End of Year 3 and Second Renewal at the End of
Year 4
Time
Item Description
Cash Flow in
Nominal $
Discount Factor
@ 12%
Discounted Present
Value
0
Destination, unpacking, and so on
(2,000)
×
1.00000
=
(2,000)
3
Year 4 (C)
(6,000)
×
0.71178
=
(4,271)
5
Year 5 (G)
×
0.56743
=
NET PRESENT VALUE(NPV)
Notes:
(A) – $2,000 * 40% = $800.
(B) – Discount factor is for an annuity of 36 periods @ 1% per period.
(C) – UPP * 5%. $120,000 * 5% = $6,000.
(D) – UPP * 3.5%. $120,000 * 3.5% = $4,200.
24 Solutions for Chapter 17
P 17-6 ANS. Over time, information continues to expand on the Internet. Using the resources in
Technology Summary 17.2, students should have no trouble finding detailed
information on virtually any package of interest. Each student will likely select
different software or hardware sites to compare. Historically, a company would
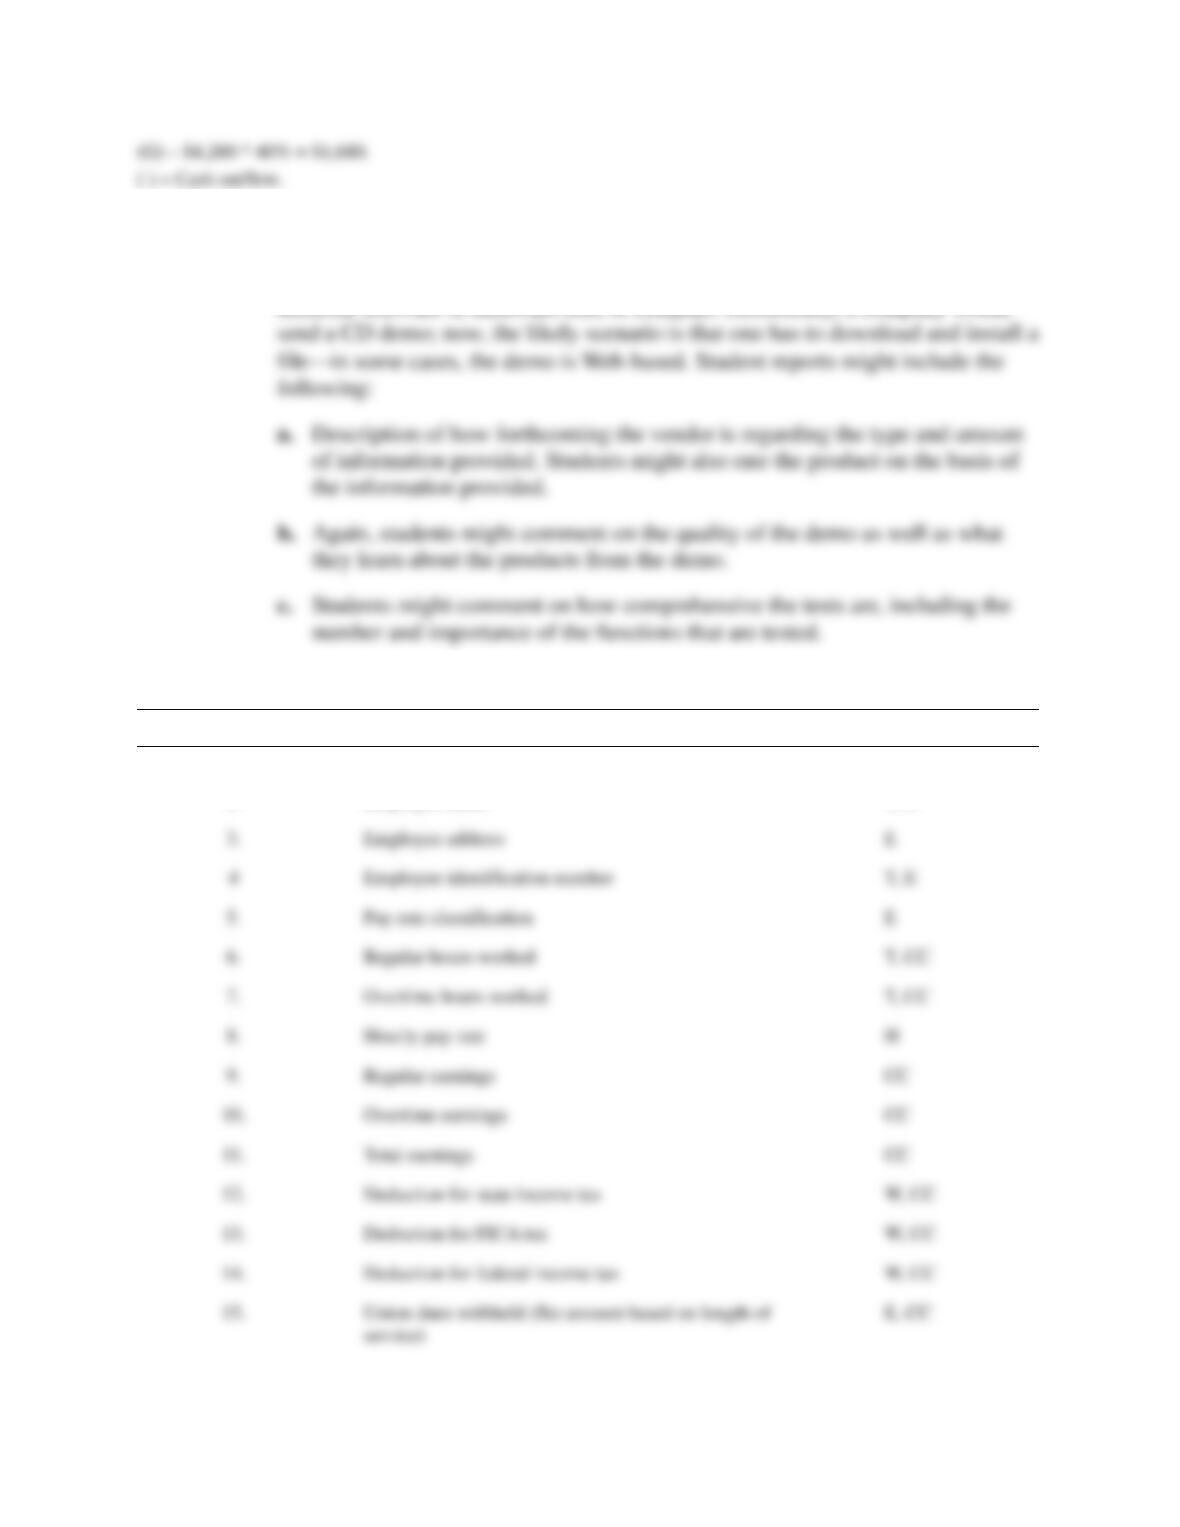
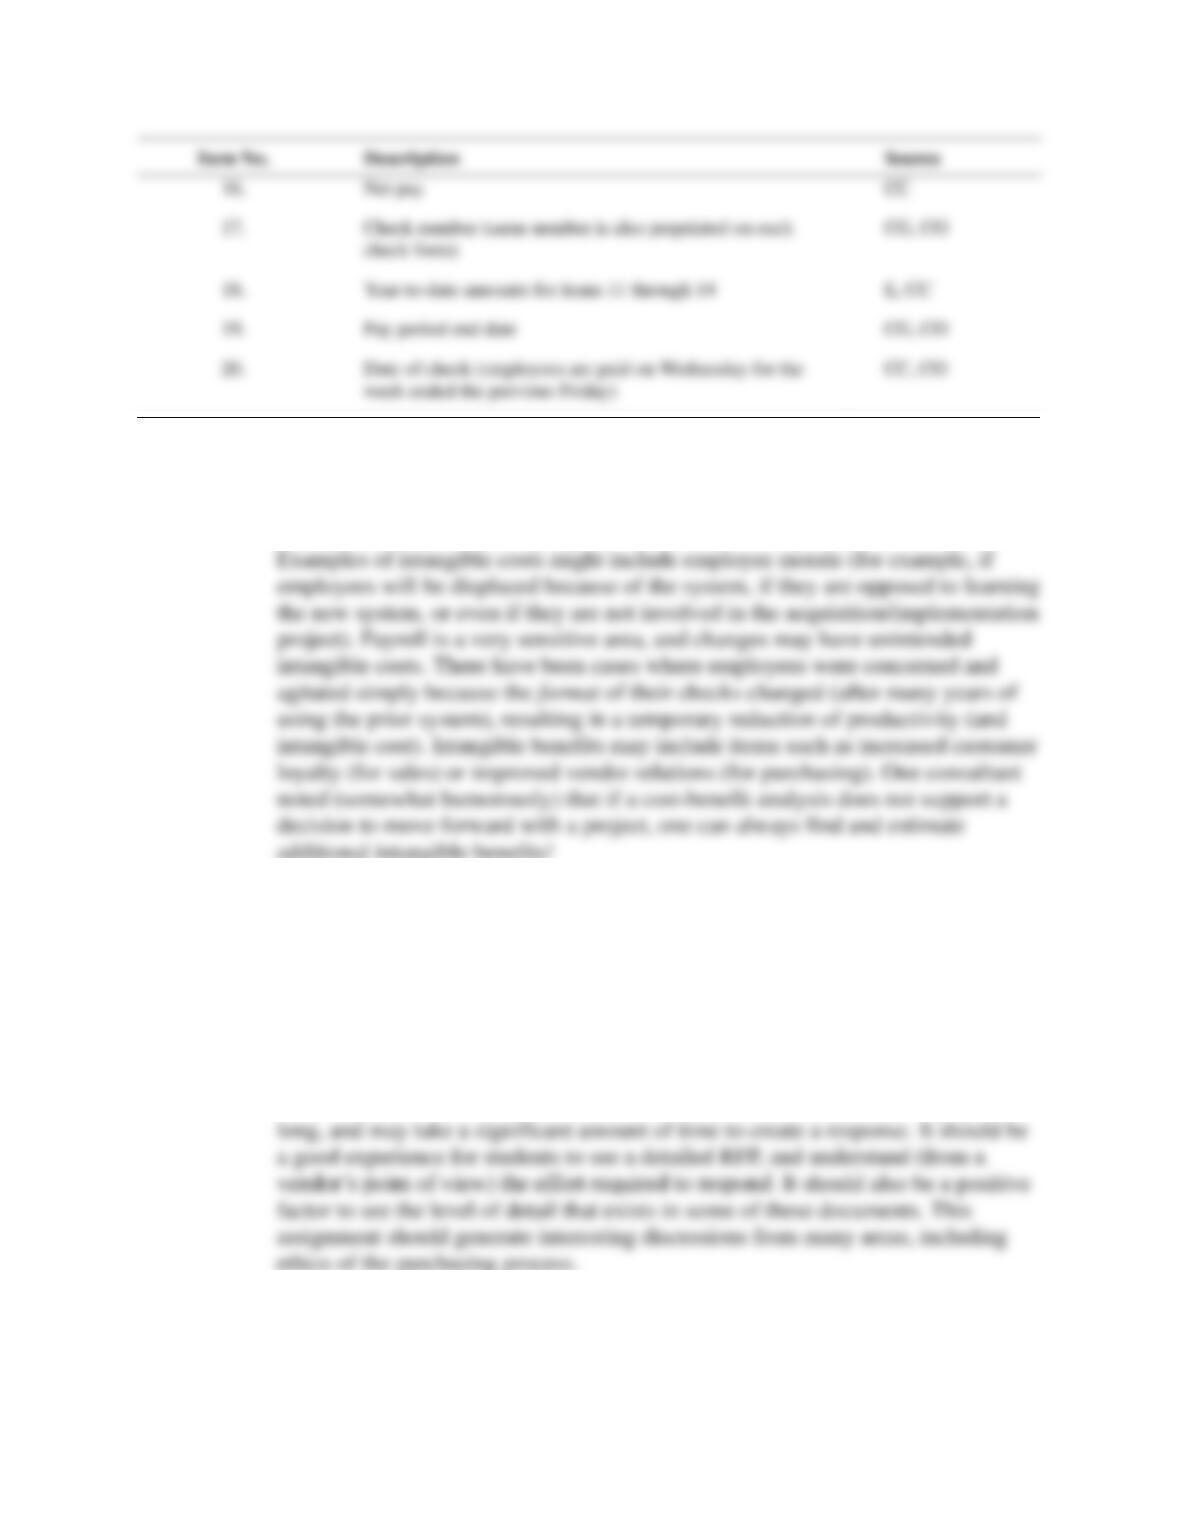
P 17-7 ANS.
Item No.
Description
Source
1.
Social security number
E
2.
Employee name
T, E
3.
Employee address
E
Employee identification number
T, E
6.
Regular hours worked
T, CC
7.
Overtime hours worked
T, CC
8.
Hourly pay rate
H
9.
Regular earnings
Deduction for state income tax
W, CC
Deduction for FICA tax
W, CC
Deduction for federal income tax
W, CC
service)
Accounting Information Systems, 10e 25
P 17-8. ANS. Although the answers may vary based on the system segment selected, there will
be obvious components of each answer. Tangible costs will include hardware,
software, installation, training, and those costs that are easily quantifiable and
directly associated with the purchase, installation, and operation of the system.
P 17-9. ANS. Answers will vary based on the student and the role selected. Generally, each
student will indicate the ways to get knowledge through coursework, training,
self-study, and experience. Typically, each student/role will require project-
management skills, as well as an in-depth knowledge of information systems and
technology. Some roles will require more specific knowledge, whereas others will
require a broad, general knowledge.
P 17-10 ANS. The answers to the problem will vary widely. The Fed Biz Opps site is updated
constantly with new information. These documents can be hundreds of pages