11-1
Chalice Wines
Teaching Commentary
OVERVIEW
This case provides a “fun” industry setting—premium California wines—for a cost analysis problem. The case deals
explicitly with activity-based costing and value chain analysis. First, the value chain is developed using conventional
industry norms for allocating product costs. Then the ABC approach is applied, which is challenging because of the
CASE ANALYSIS
The Chalice Wine Group. The first section of the case develops a picture of a company facing negative
financial trends, as shown in case Exhibit 3. Total sales are increasing, but cost of sales is increasing faster, and average
revenue per case has declined. In addition, CWG has experienced a significant increase in interest expense. Over two
years, Net Income has deteriorated from plus 5% to minus 4% of sales. Exhibit A is a condensed summary of the
11-2
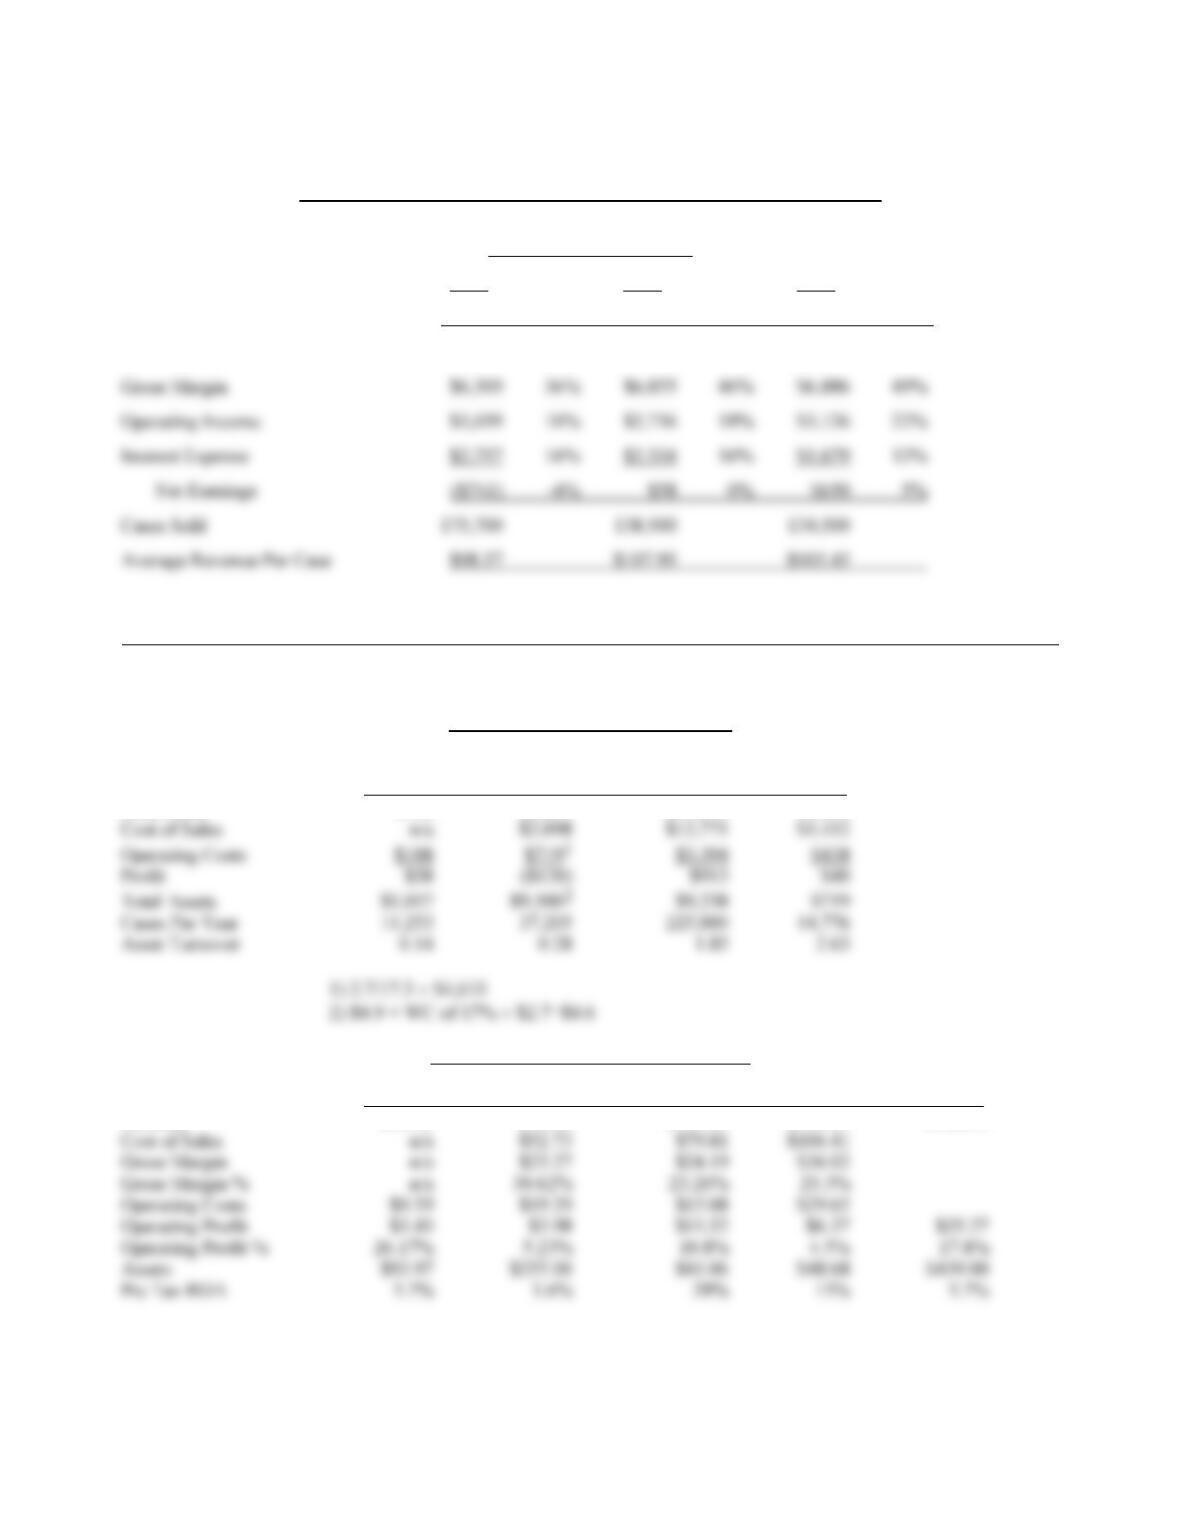
Exhibit A
Condensed Comparative Income Statements, The Chalice Wine Group
(Dollar Amounts in Thousands Except Per Share)
Year Ended December 31,
1992 1991 1990
Dollars % Sales Dollars % Sales Dollars % Sales
Wine Sales $17,319 100% $14,951 100% $14,182 100%
Exhibit B
Value Chain Profitability Analysis
(Aggregate Dollar Amounts in Thousands)
Vineyard Winery Distributor Retailer
Total Sales $146 $2,697 $17,078 $1,890
Per Case 1991 Cimarron Meritage White
Vineyard Winery Distributor Retailer Overall
Revenue $12.99 $76.00 $106.41 $142.43 $142.43
11-3
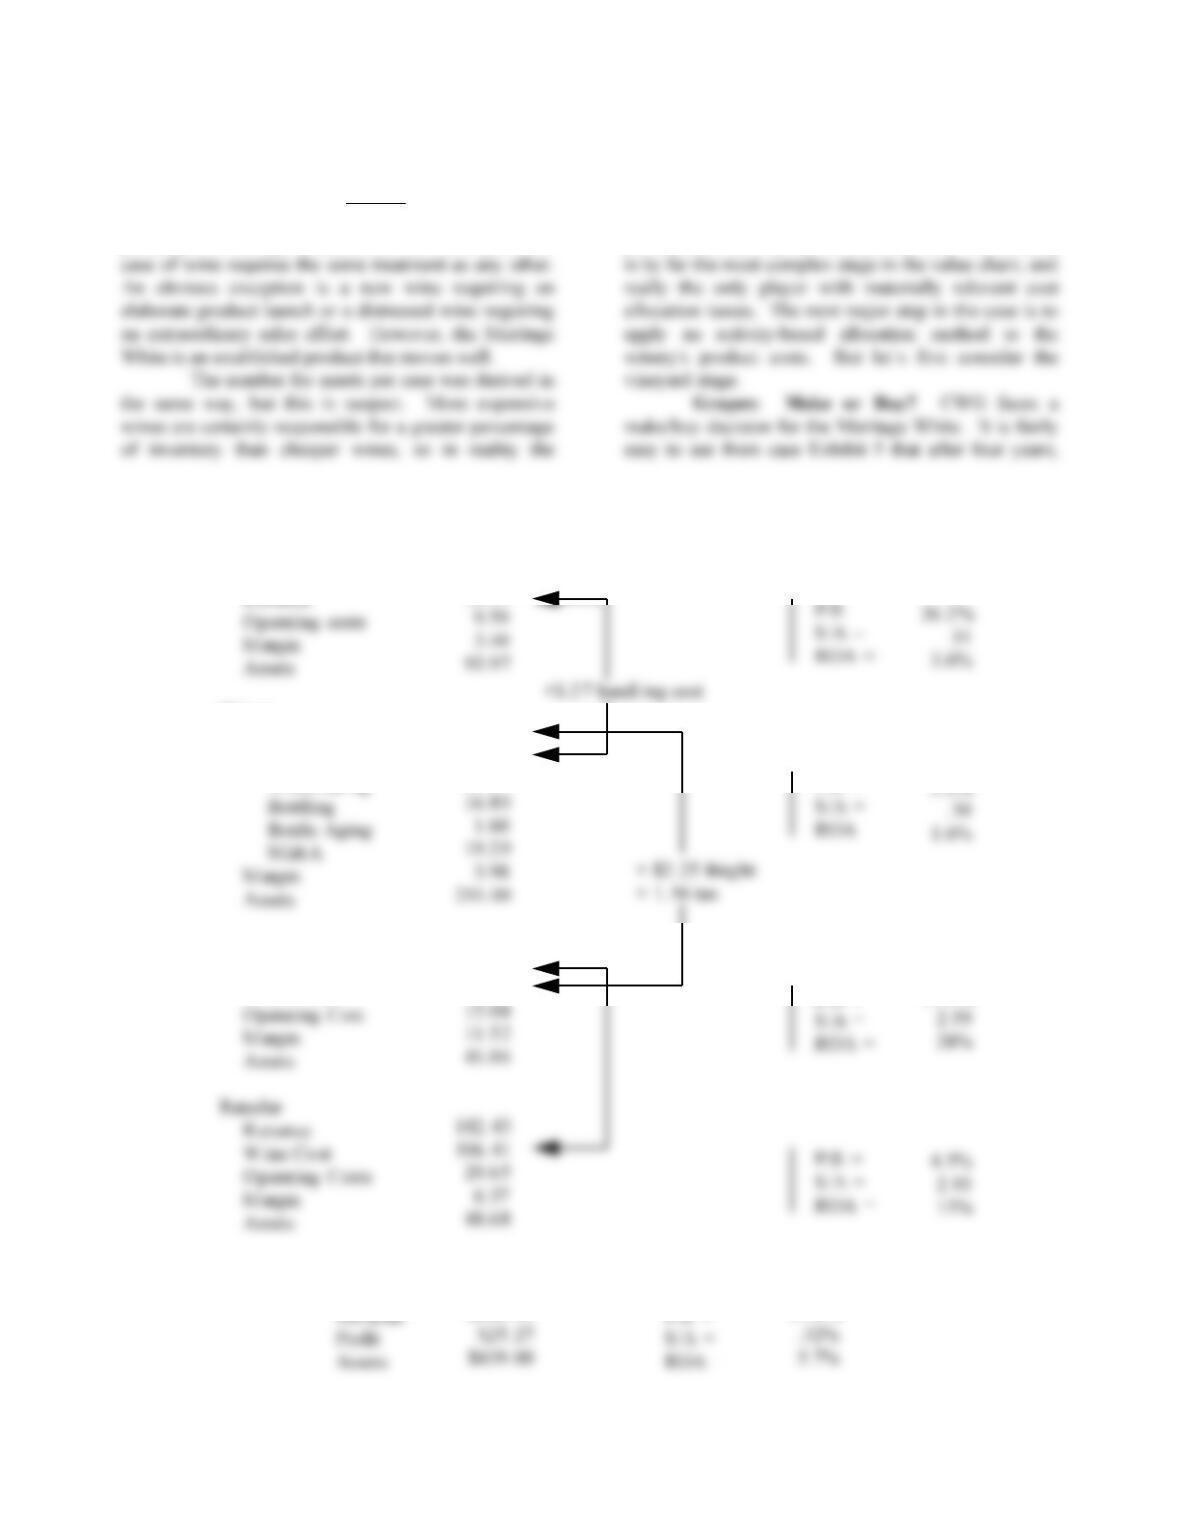
Exhibit C reorganizes the value in flow chart
format. For all players, the average per-case operating
cost number is used for the Meritage White. This is
probably fair enough because, for the most part, one
Meritage White may be even less profitable than it
appears.
This profitability analysis assumes that the
product cost used by the winery is correct. The winery
Exhibit C
The Value Chain—1991 Cimarron Meritage White
(per case)
Vineyard
Winery
R evenue
Grapes
Winemaking
Dist ributor
R evenue
W ine Cost
P/S =
P/S =
The Overal l Value Chain
12.9 9
76.0 0
13.2 6
21.0 7
106. 41
79.8 1
$143.43
17.8 %
10.8 %
11-4
without financing costs, CWG can get its grape costs
down to around $600/ton. It is currently paying
Meritage White. The extra grapes could be of any
variety and be sold on the open market. Exhibit 7 in the
case is intended to show the volatility of the market for
wine grapes. A grower must commit to a variety
What Exhibit 7 doesn’t show is the variability
of vineyard yields relative to a completely
uncontrollable element: the weather. No decision to
were much greater.
ABC Allocation of Winemaking Costs. The
first step in assigning the periodic winemaking costs
into the activities that cause them is to assign all the
winery assets to production stages. Three discrete
(1991 Meritage White)
ABC for Winemaking
Stage 1 $285,000 (1991) 18% = $51,300
Stage 2 $559,000 (1992) 15% = $83,850
Stage 3 $56,000 (1992) 28% = $15,680
(Including Barrel Depreciation
account explicitly for barrel depreciation. By using the
ratio of stage 1 barrel depreciation to total depreciation
Barrel Costs per ABC Analysis
% ‘91 M.W. in ‘91 Stage 1 18%
Barrel Depreciation in ‘91 Stage 1 $12,700
A more realistic and wine-specific approach
would consider the “fair value” of barrel costs for the
1991 Meritage White. Two depreciation schemes may
be explored that are equivalent if barrel prices are
year, 50% of the remainder (another 25% of the cost) is
consumed. And so on through four years, after which
the barrel is worth $40.
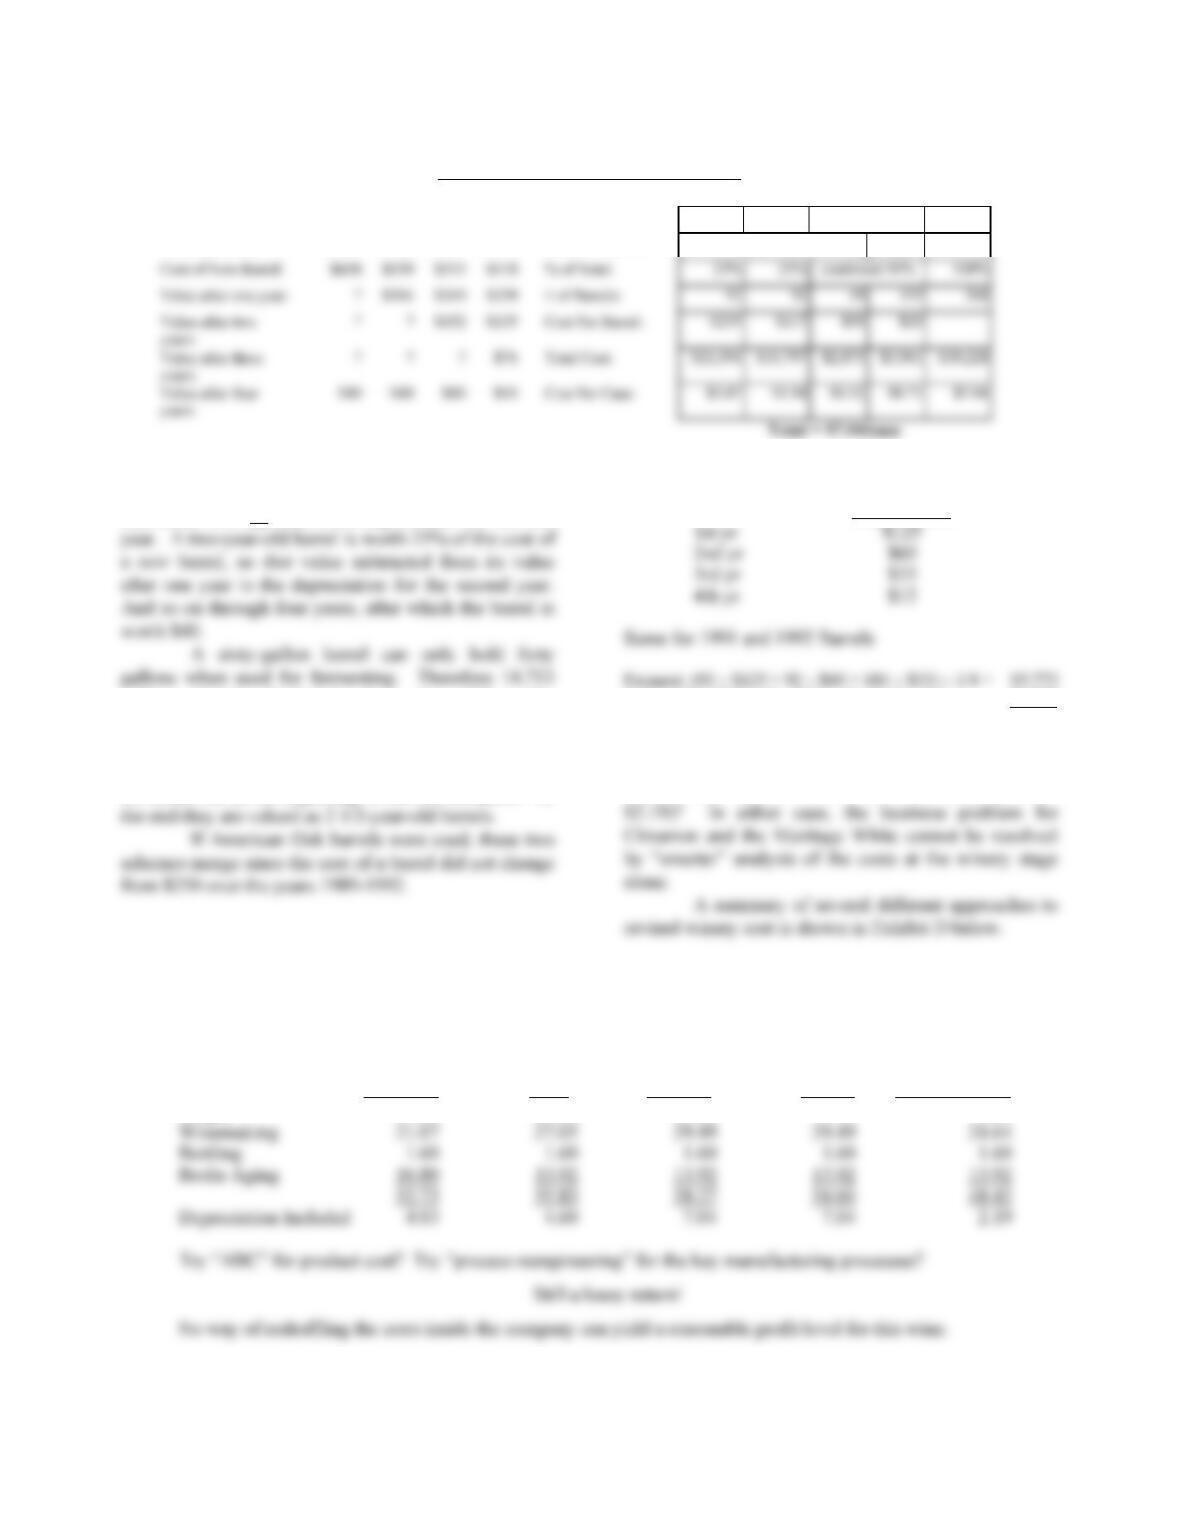
All barrels used in 1992
New = 304
1 yr = 152
2 yrs = 76
Ferment [92 $270 + 92 $135 + 184 $67]
11-5
scheme takes into account that a one-year-old barrel is
worth 50% of the cost of a new barrel. That value,
subtracted from its cost, is the depreciation for the first
gallons of juice divided by forty gives 368 as the
number of barrels needed to ferment. After
fermentation, 13,984 gallons remain, divided by sicty =
233 barrels. The 135 surplus barrels (368 – 233) were
two years old at the beginning of this fermentation. At
American Oak Barrels
Depreciation
Aging: (92 $60 + 92 $33 + 49 $12) 3/4 = $6,858
$12,631
÷ 5775 = $2.19 /case
Is the right to say “fermented and aged in
French Oak barrels” worth $4.85 per case ($7.04 –
Depreciation Scheme 2: French Oak
Barrel purchased in:
1992
1991
1990
1989
Barrel Age:
New
1 Year
2 Years
Totals
Exchange Rate, 7/1:
$.19/ff
$.16/ff
$.18/ff
$.15/ff
Barrels Used For:
Stages 1 and 2
Stage 1
Cost of New Barrel:
$608
$539
$515
$418
% of Total:
25%
25%
combined 50%
Value after one year:
$304
$269
$258
# of Barrels:
Exhibit D
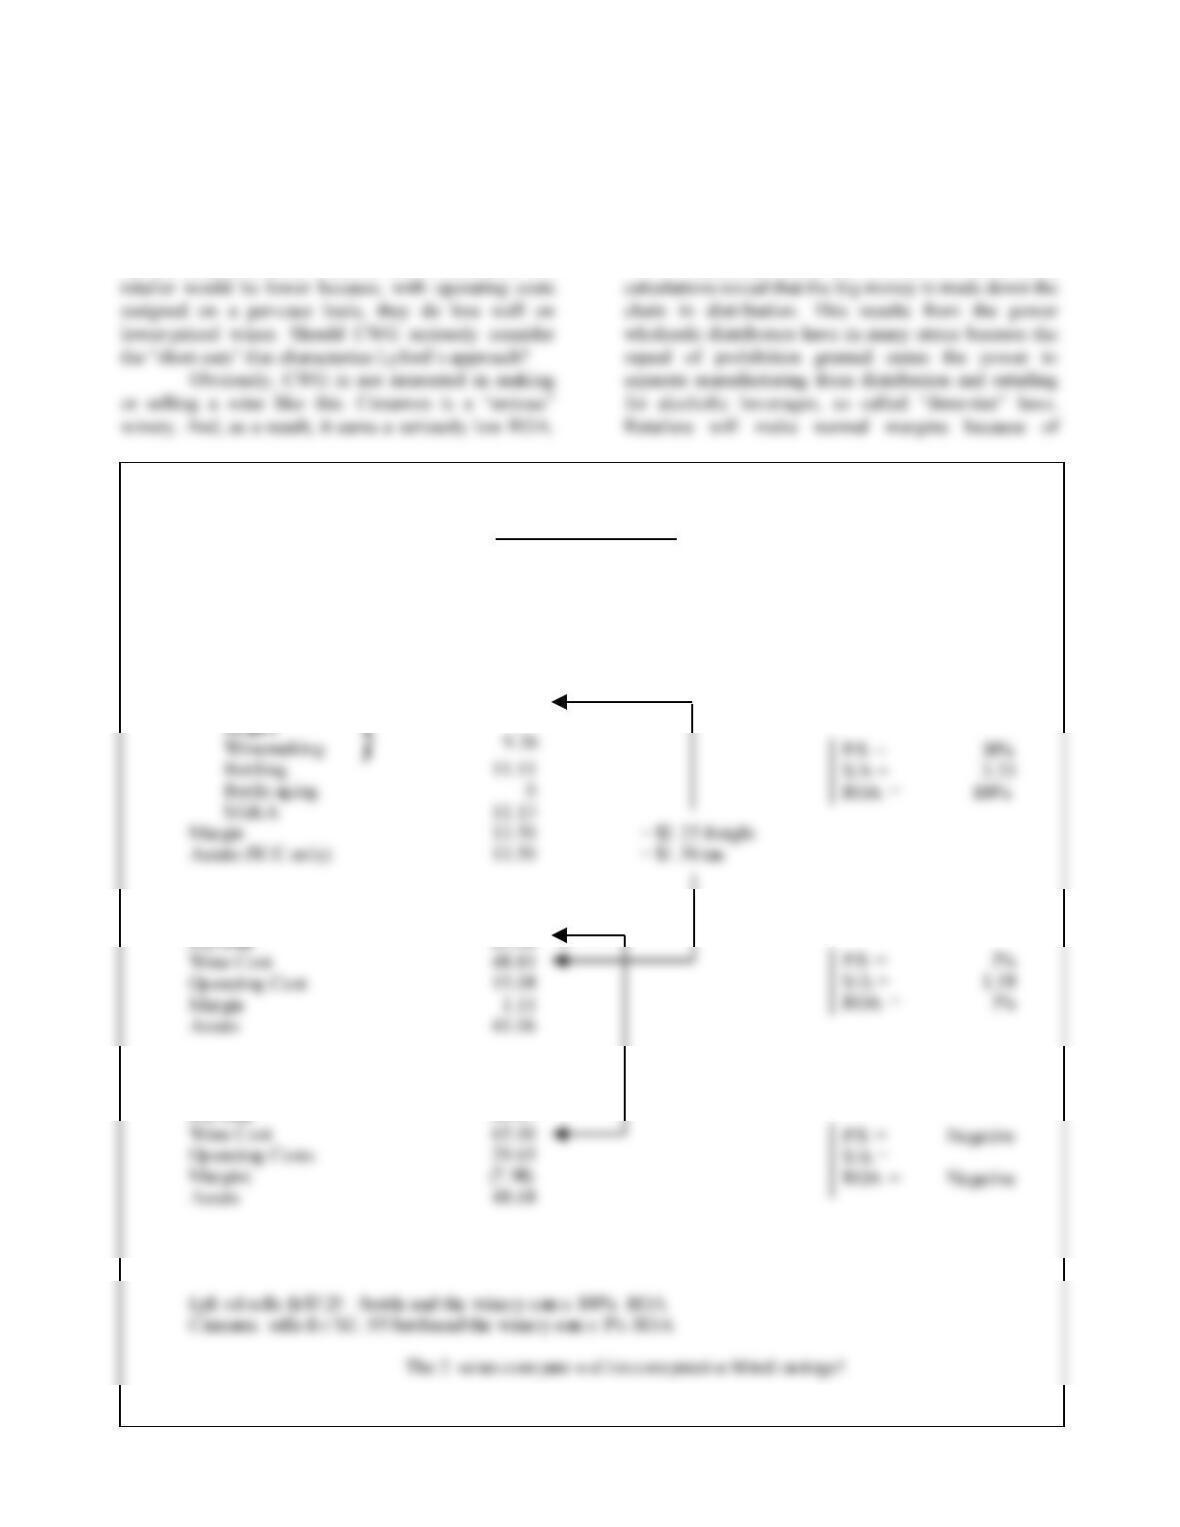
Product Cost (1991 Meritage White)
Several Versions
ABC & “Make” “Avg.” Grapes &
Per CWG “ABC” FV Bbls. Grapes Am. Oak Bbls.
Grapes 13.26 13.26 13.26 9.59 8.26
11-6
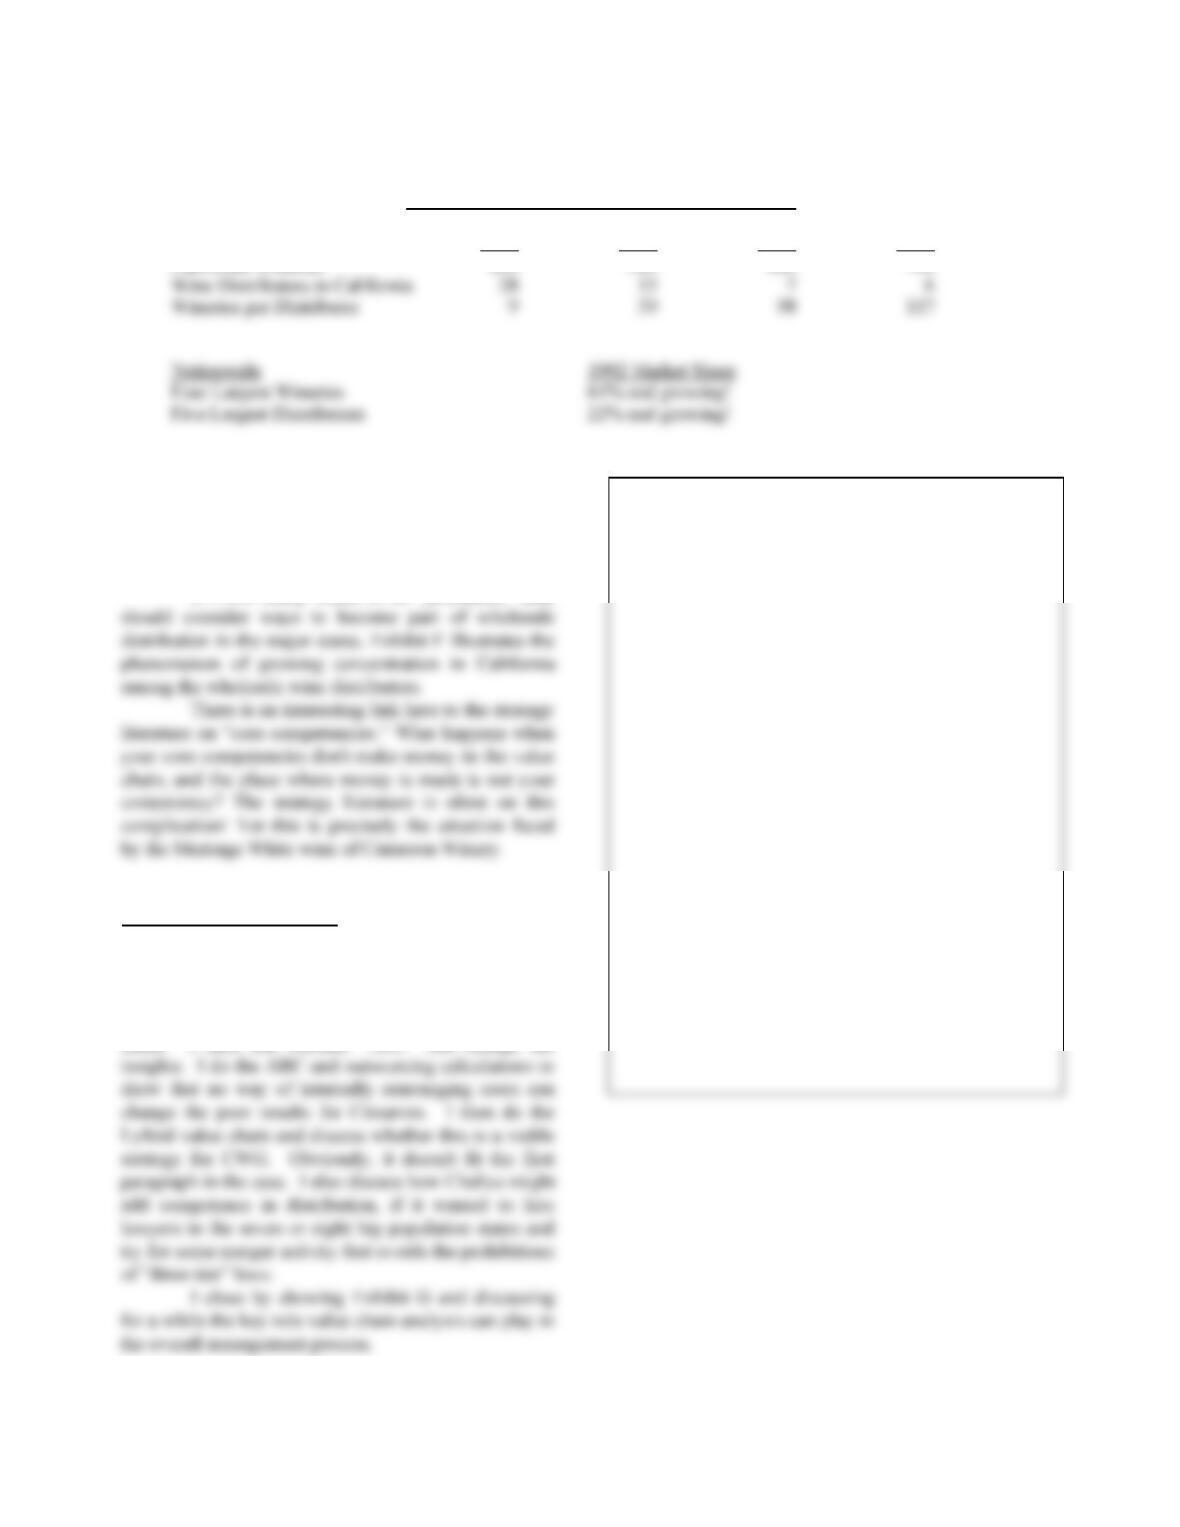
The Lyford Wines Value Chain. Exhibit E
shows the economics for Lyford Wines in the value
chain. Only the winery stage is different. Returns for
Lyford are phenomenal. Returns for the distributor and
Lyford is a “business venture” rather than a “serious
wine.” But the wine shows reasonably well in
comparative tastings and very well in the financial
report!
Business Issues for CWG. The value chain
Exhibit E
Lyford Wines
A Different Approach
Vineyard &
Wi nemaki ng
Out sourced
Wi nery
Rev enue 45.00
Di st ri but or
R et ai ler
Rev enue 86.67
11-7
competition. Manufacturers of premium wines make
very low returns—a “hobby business.” Distributors
have power in both directions and use it to extract a
disproportionate share of the overall returns.
If CWG really wants to be “profitable,” they
TEACHING STRATEGY
I use this case near the end of the elective course on
SCM. In class, I start with the value chain calculations.
I use the case as more basic drill on the specific
mechanics of constructing and interpreting a value
chain. I then ask whether “ABC” can change the
Exhibit F
The Evolution of “Buyer Power” in California
Winery Proliferation/Distributor Consolidation
1976 1986 1992 1993
California Wineries 240 580 686 700
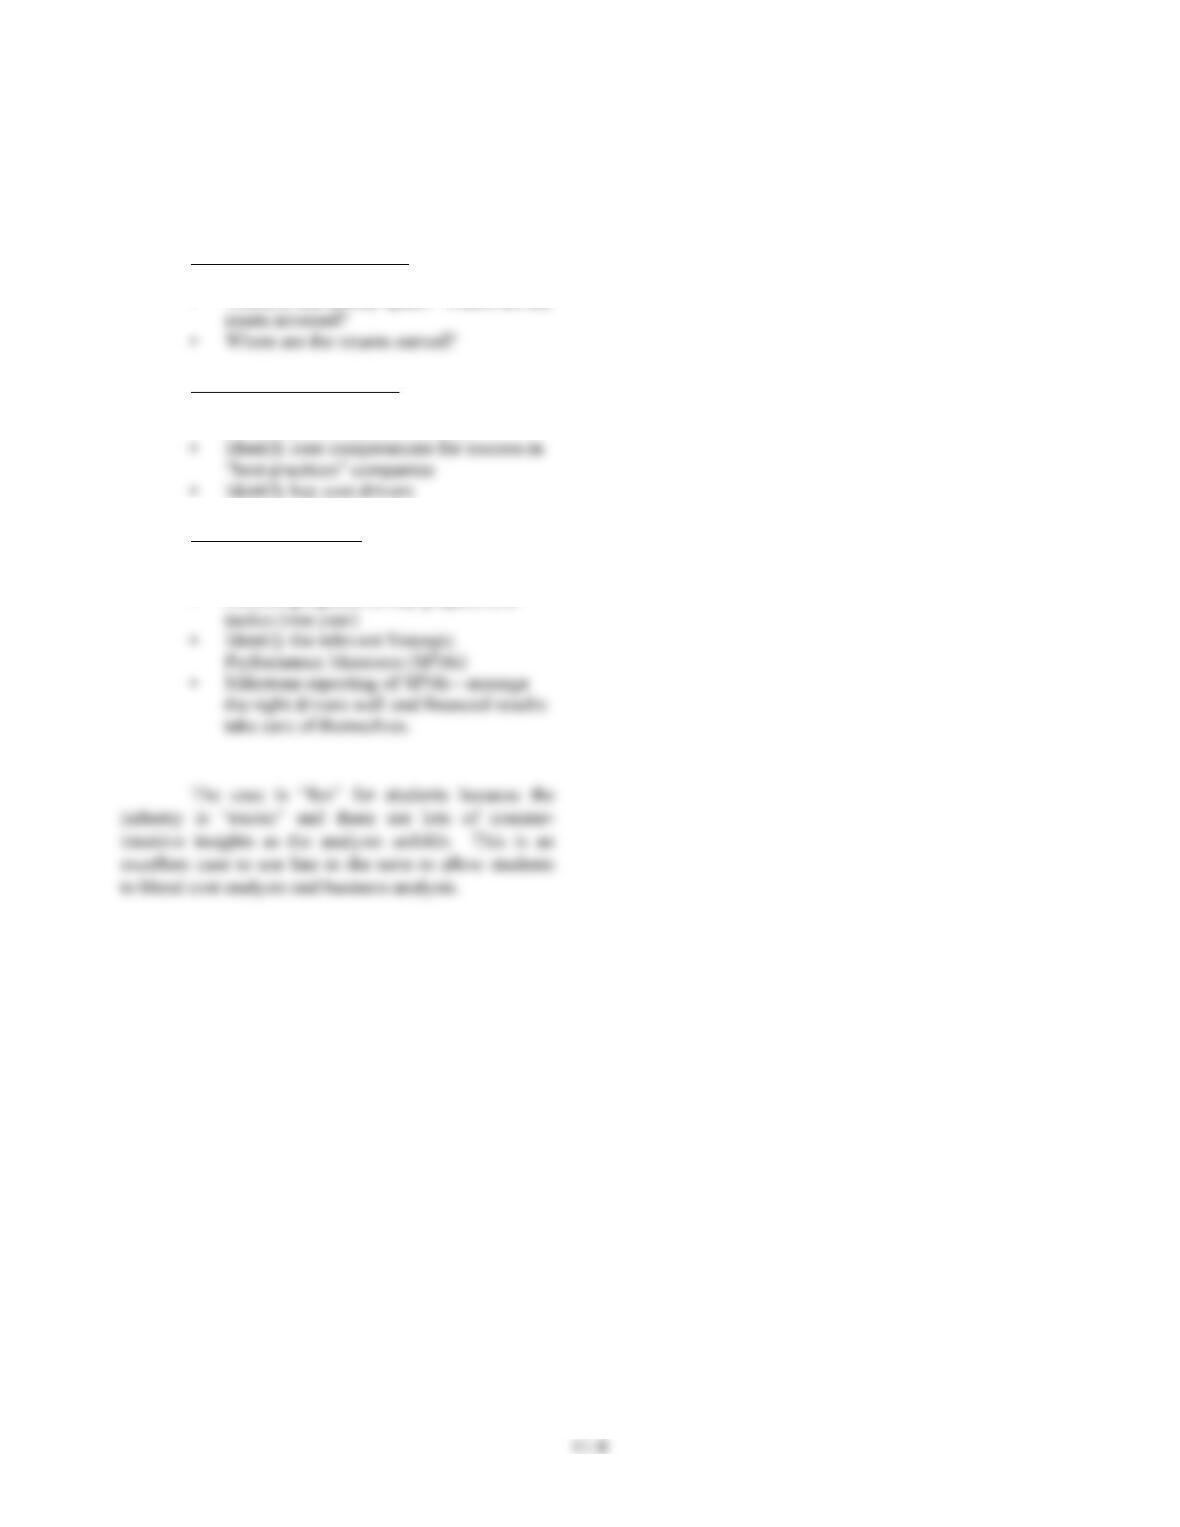
Exhibit G
Understanding the Business Issues for Profit
Improvement
1. Understand the Value Chain
• Where is the money spent? Where are the
2. For Key Steps in the Chain
• Benchmark competitive success
3. What is Our Strategy?
• Convert to key programs (multi-year)
• Convert programs to key projects and