E15-12
2010
Dec. 31 Cash ($100,000 x 0.08) 8,000
Interest Revenue
E15-13
1. June 1, 2010
Investment in Held-to-Maturity Debt Securities 10,000
2. Under IFRS, the company would make the same journal entries as in
Requirement 1 for 2010 and 2011. In 2012, it would recognize the recovery of
E15-14
1. 2010
Jan. 1 Investment in Stock:
Crowell Corporation 160,000
Cash 160,000
2. Investment in Stock: Crowell Corporation
Original investment $160,000
03/31 dividend $15,000
E15-15
2010
Jan. 1 Investment in Stock: North Company 144,000
Cash 144,000
E15-16
2010
Jan. 1 Investment in Stock: Fink Company 48,000
Cash (3,000 x $16) 48,000
E15-17
2009
Jan. 1 Investment in Available-for-Sale
Securities 19,760
Cash 19,760
E15-18
2010
Mar. 2 Investment in Available-for-Sale
Securities 60,000
Cash 60,000
15-24
E15-18 (continued)
2011
Feb. 1 Cash (1,500 x $12) 18,000
E15-19
2010
Jan. 2 Prepaid Insurance 13,300
Cash 13,300
E15-20
2010
Jan. 1 Sinking Fund Cash 425,000
Cash 425,000
E15-20 (continued)
2011
Dec. 31 Sinking Fund Cash 40,000
Sinking Fund Revenues 40,000
E15-21
Note to Instructor: This interest rate swap is a fair value hedge.
Original Bank Loan (not required)
15-26
E15-21 (continued)
Fair Values and Gains and Losses, December 31, 2010
Loss in Value of Derivative 53,497c
A swap derivative loss and liability exist because the 8% current market rate is
higher than the 7% fixed interest rate that Anglar receives on the derivative.
Notes Payable 53,497d
Gain in Value of Debt 53,497
15-27
E15-21 (continued)
2. Income Statement for Year Ending December 31, 2010
Other Items:
Balance Sheet, December 31, 2010
SOLUTIONS TO PROBLEMS
P15-1
1. 2010
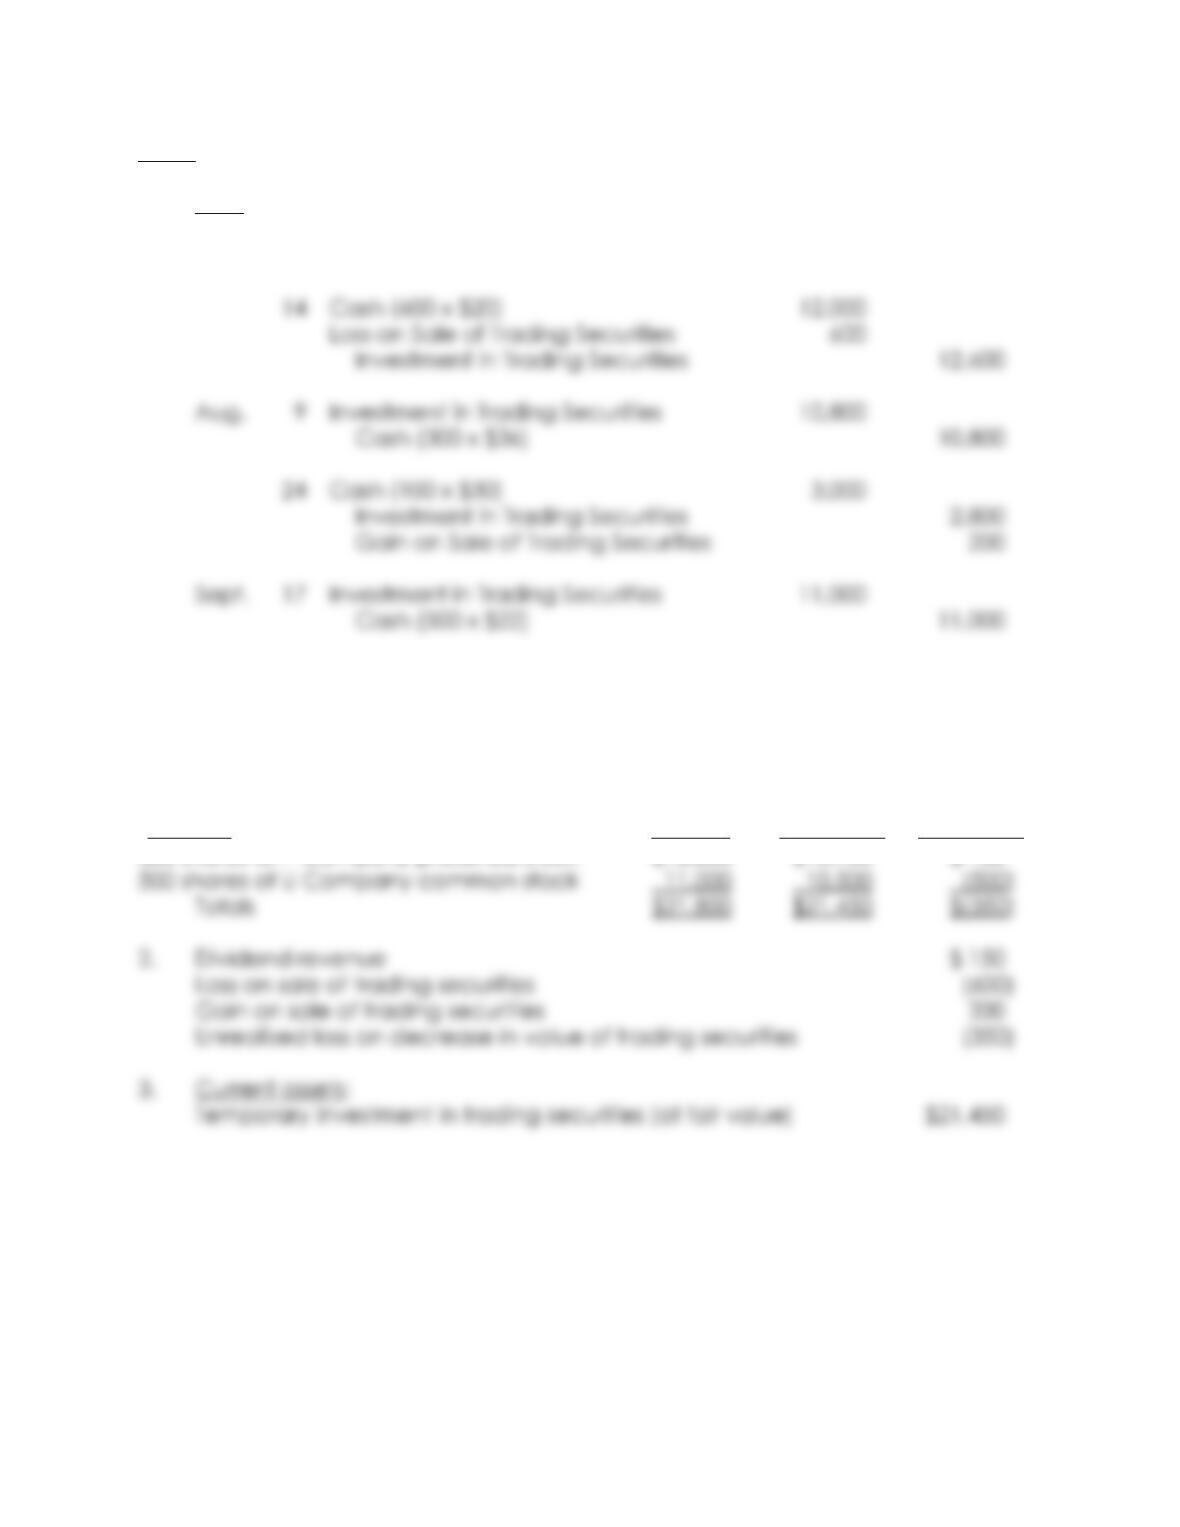
Nov. 5 Investment in Trading Securities 17,200
Cash (200 x $86) 17,200
Dec. 15 Investment in Trading Securities 14,800
Cash (400 x $37) 14,800
Cumulative
12/31/10 Change in
*Security Cost Fair Value Fair Value
100 shares of M Company common stock $ 8,600 $ 8,700 $ 100
15-29
P15-2
1. 2010
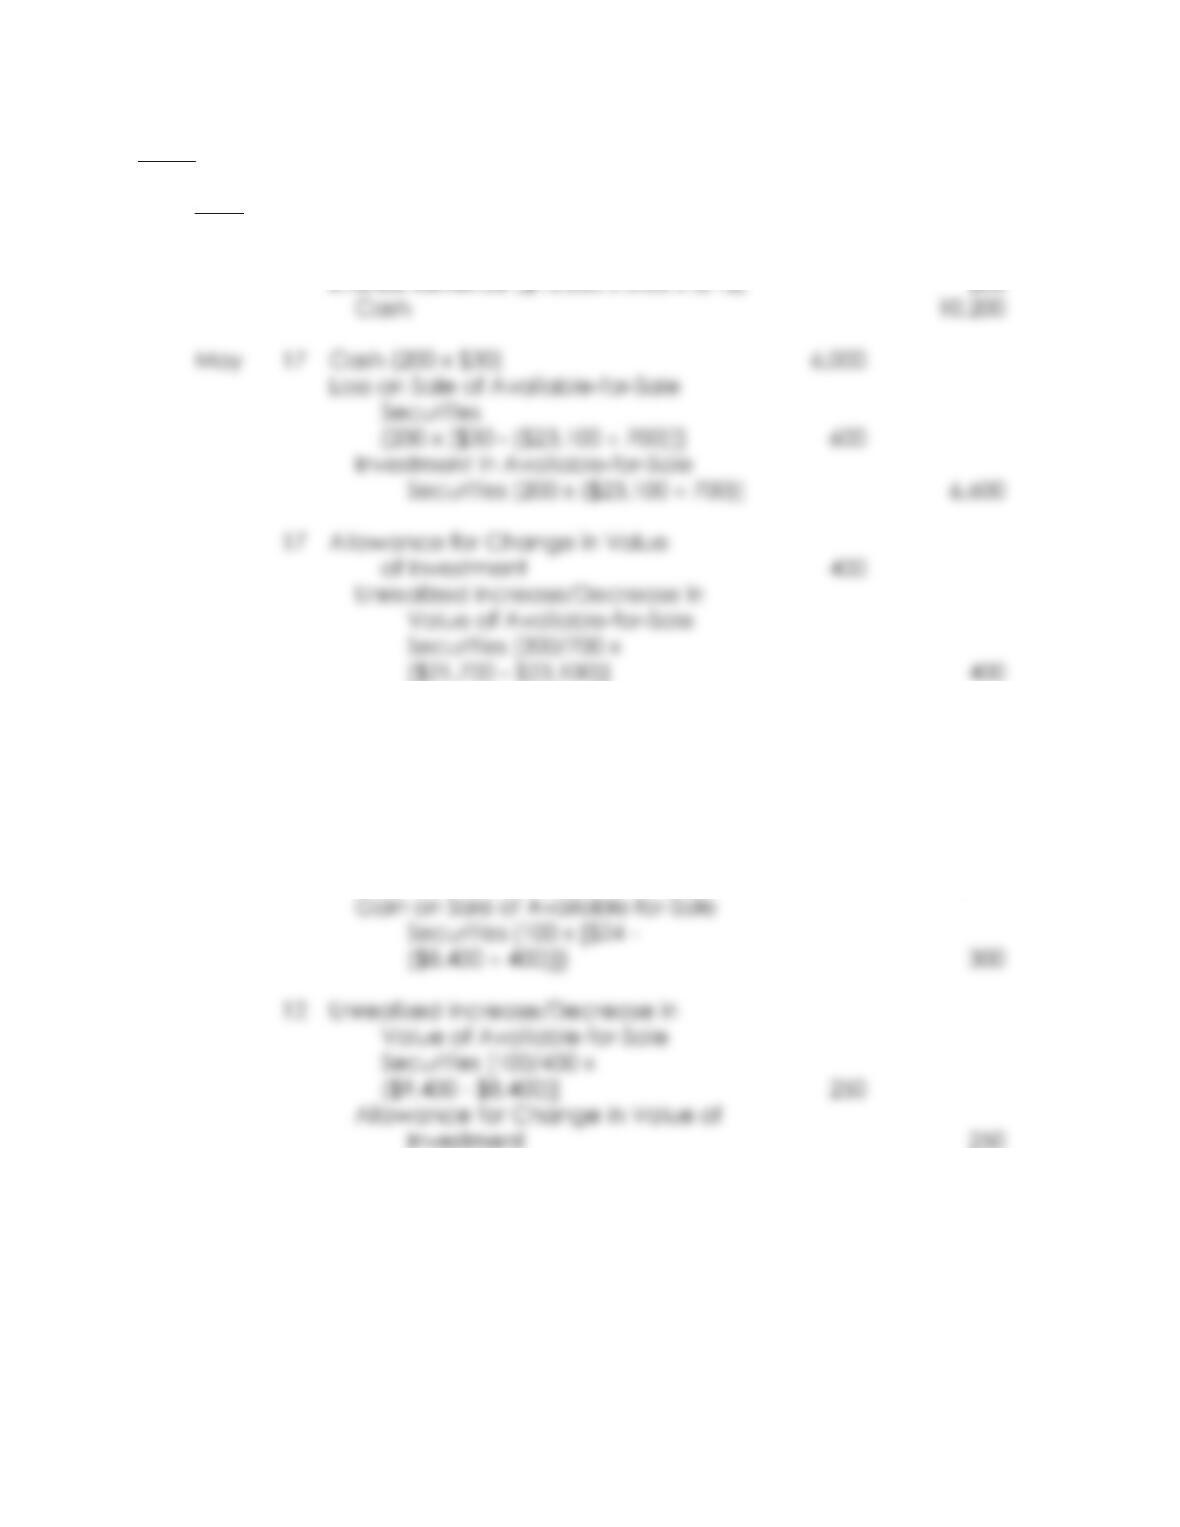
July 2 Cash (100 x $1.50) 150
Dividend Revenue 150
30 Unrealized Loss on Decrease in
Value of Trading Securities 350
Investment in Trading Securities 350*
Cumulative
9/30/10 Change in
*Security Cost Fair Value Fair Value
300 shares of P Company preferred stock $10,800 $10,950 $ 150
15-30
P15-3
1. 2010
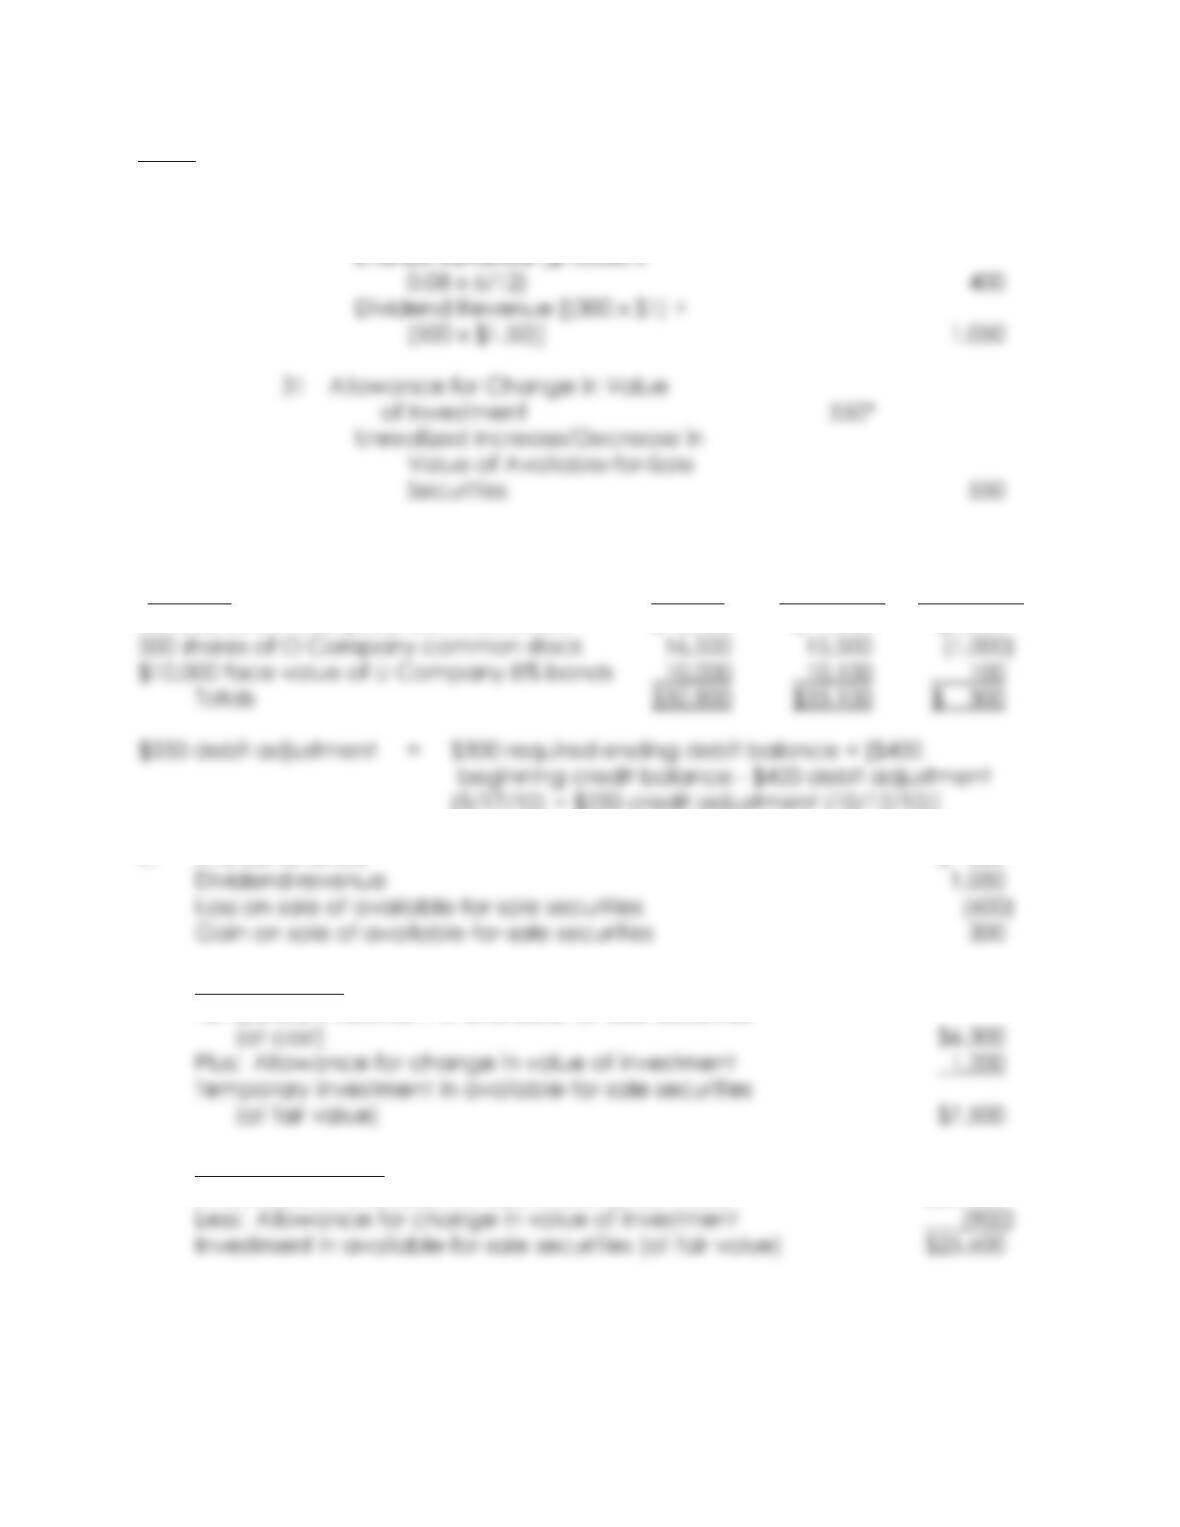
Mar. 31 Investment in Available-for-Sale
Securities 10,000
June 30 Cash 400
Interest Revenue ($10,000 x
0.08 x 6/12) 400
Oct. 12 Cash (100 x $24) 2,400
Investment in Available-for-Sale
Securities [100 x ($8,400 ÷ 400)] 2,100
15-31
P15-3 (continued)
1. (continued)
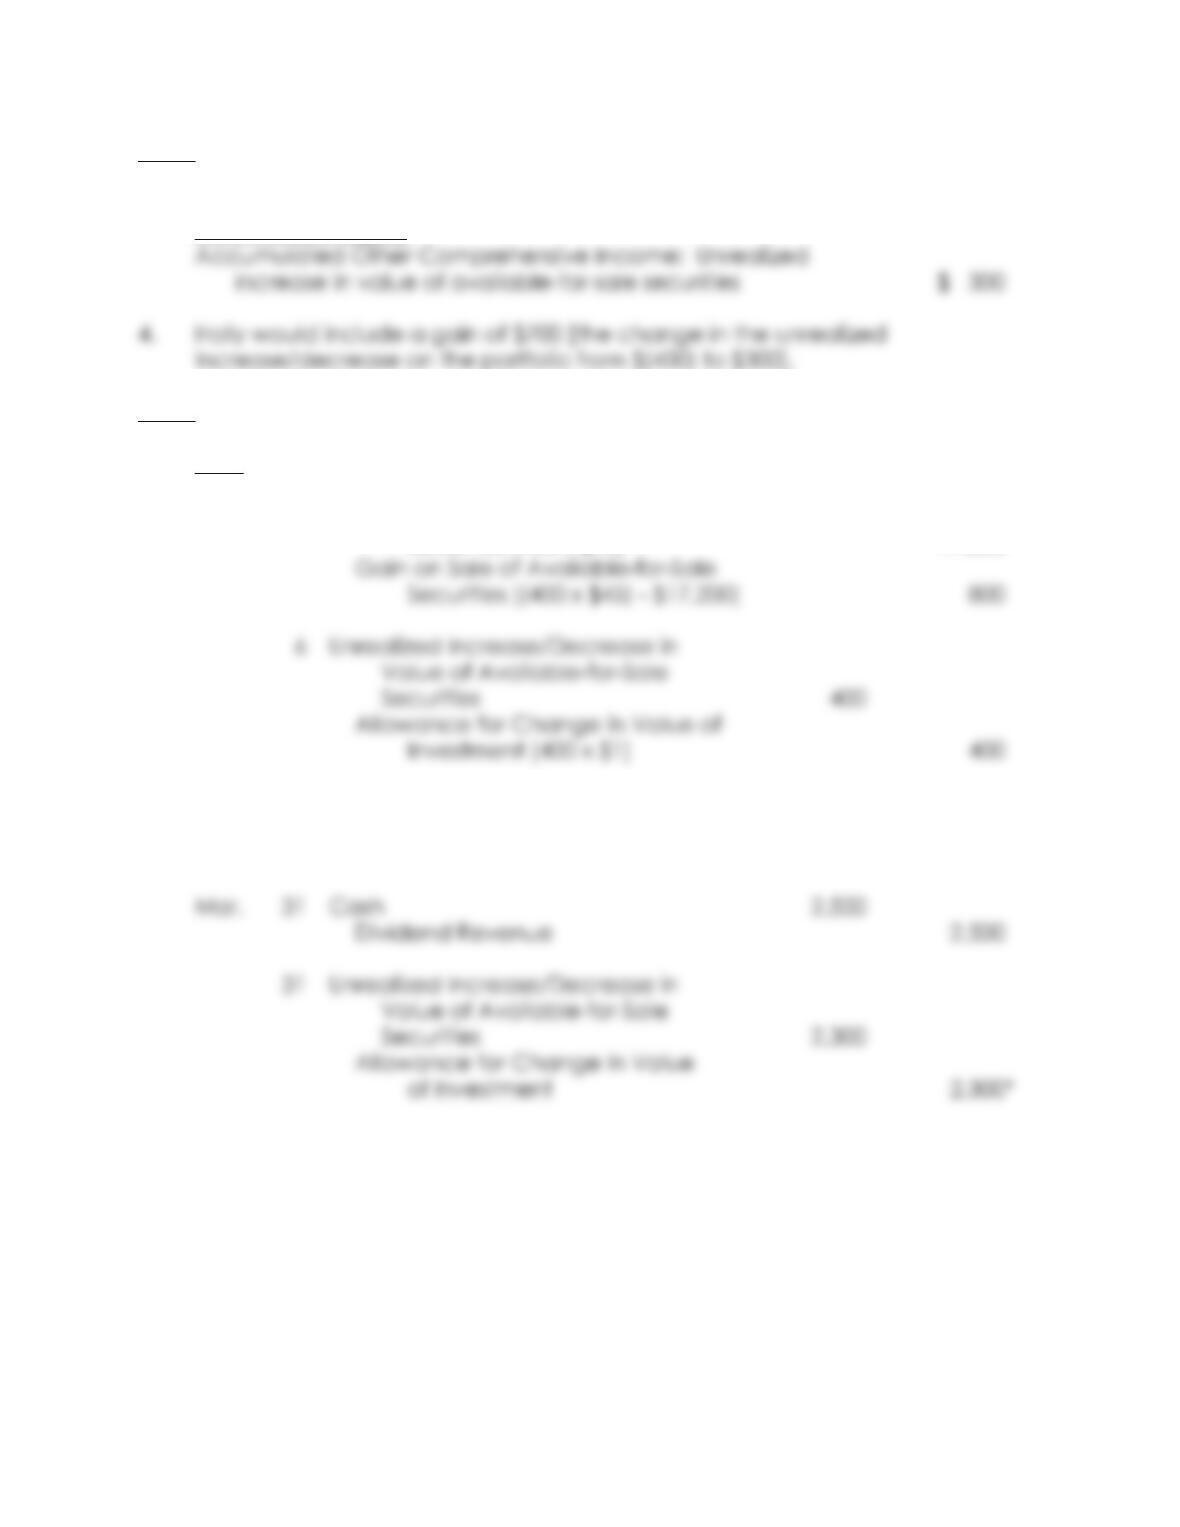
Dec. 31 Cash 1,450
Cumulative
12/31/10 Change in
*Security Cost Fair Value Fair Value
300 shares of I Company common stock $ 6,300 $ 7,500 $1,200
(5/17/10) + $250 credit adjustment (10/12/10)]
2. Interest revenue $ 600
3. Current assets:
Temporary investment in available-for-sale securities
Noncurrent assets:
Investment in available-for-sale securities (at cost) $26,500
15-32
P15-3 (continued)
3. (continued)
Stockholders’ equity:
P15-4
1. 2010
Jan. 6 Cash (400 x $45) 18,000
Investment in Available-for-Sale
Securities (400 x $43) 17,200
Feb. 3 Investment in Available-for-Sale
Securities 31,500
Cash (700 x $45) 31,500
15-33
P15-4 (continued)
1. (continued)
Cumulative
3/31/10 Change in
*Security Cost Fair Value Fair Value
500 shares of Keene Company common stock $ 30,000 $ 29,500 $ (500)
Apr. 14 Investment in Available-for-Sale
Securities 15,600
Cash (300 x $52) 15,600
June 30 Cash 2,800
Dividend Revenue 2,800
15-34
P15-4 (continued)
1. (continued)
Cumulative
6/30/10 Change in
*Security Cost Fair Value Fair Value
500 shares of Keene Company common stock $ 30,000 $ 31,000 $ 1,000
(5/11/10)]
2. First Quarter 2010 Second Quarter 2010
3. Assets 3/31/10 6/30/10
Current assets:
Temporary investment in available-for-sale
Stockholders’ Equity
15-35
P15-5
1. 2010
Jan. 6 Cash 265
Dividend Revenue 265
Cumulative
3/31/10 Change in
*Security Cost Fair Value Fair Value
400 shares of Turben Co. common stock $14,275 $13,470 $ (805)
$1,180 debit adjustment = $1,800 required ending credit balance – $2,980
($63,475 – $60,495) beginning credit balance
Cumulative
6/30/10 Change in
*Security Cost Fair Value Fair Value
400 shares of Turben Co. common stock $14,275 $13,300 $ (975)
15-36
P15-5 (continued)
1. (continued)
July 6 Cash 13,750
Loss on Sale of Available-for-Sale
Securities 975
Sept. 29 Cash 500
Dividend Revenue 500
Cumulative
9/30/10 Change in
*Security Cost Fair Value Fair Value
500 shares of Cook Corp. common stock $12,650 $14,230 $ 1,580
15-37
P15-5 (continued)
1. (continued)
Nov. 2 Unrealized Increase/Decrease in
Value of Available-for-Sale
Securities 2,050
Allowance for Change in Value
of Investment 2,050
Cumulative
12/31/10 Change in
*Security Cost Fair Value Fair Value
500 shares of Cook Corp. common stock $12,650 $14,280 $ 1,630
2. For Quarter Ended
March 31 June 30 Sept. 30 Dec. 31
Dividend revenue $765a $1,075b $500 $ 375
15-38
P15-5 (continued)
3. Balance Sheet as of
March 31 June 30 Sept. 30 Dec. 31
Current assets:
Temporary investment in
Stockholders’ equity:
Accumulated Other Comprehensive Income:
P15-6
1. 2010
Jan. 1 Investment in Available-for-Sale
Securities 29,100
Cash ($30,000 x 0.97) 29,100
15-39
P15-6 (continued)
1. (continued)
June 30 Allowance for Change in Value
of Investment 225*
Cumulative
Amortized 6/30/10 Change in
*Security Cost Fair Value Fair Value
$30,000 face value of Bradford Co. bonds $29,355a $29,160c $ (195)
July 1 Investment in Available-for-Sale
Securities 23,000
Cash ($25,000 x 0.92) 23,000
Nov. 30 Interest Receivable ($25,000 x
0.11 x 5/12) 1,146
15-40
P15-6 (continued)
1. (continued)
Dec. 31 Cash ($30,000 x 0.08 x 1/2) 1,200
Investment in Available-for-Sale
31 Cash ($40,000 x 1.02) 40,800
Investment in Available-for-Sale
Securities ($40,380 – $21) 40,359
Gain on Sale of Available-for-Sale
Securities ($40,800 – $40,359) 441
Cumulative
12/31/10 Change in
*Security Cost Fair Value Fair Value
$30,000 face value of Bradford Co. bonds $29,623a $28,800b $(823)