Chapter 15
Financial Statement Analysis
Review Questions
1. What are the three main ways to analyze financial statements?
2. What is an annual report? Briefly describe the key parts of the annual report.
An annual report (10-K) is a report required by the Securities and Exchange Commission that
3. What is horizontal analysis, and how is a percentage change computed?
4. What is trend analysis, and how does it differ from horizontal analysis?
The trend analysis is a form of horizontal analysis in which percentages are computed by selecting a
5. What is vertical analysis? What item is used as the base for the income statement? What item is used
as the base for the balance sheet?
The vertical analysis of a financial statement shows the relationship of each item to its base amount,
6. Describe a common-size statement and how it might be helpful in evaluating a company.
7. What is benchmarking, and what are the two main types of benchmarks in financial statement
analysis?
8. Briefly describe the ratios that can be used to evaluate a company’s ability to pay current liabilities.
The ratios that are used to evaluate the ability of a company to pay its current liabilities are:
9. Briefly describe the ratios that can be used to evaluate a company’s ability to sell merchandise
inventory and collect receivables.
The ratios that are used to evaluate a company’s ability to sell merchandise inventory and collect
receivables are:
10. Briefly describe the ratios that can be used to evaluate a company’s ability to pay long-term debt.
The ratios that can be used to evaluate a company’s ability to pay long-term debt are:
11. Briefly describe the ratios that can be used to evaluate a company’s profitability.
The ratios that can be used to evaluate a company’s profitability are:
• Asset turnover ratio—Measures how efficiently a business uses its average total assets to
generate sales: Net sales / Average total assets.
12. Briefly describe the ratios that can be used to evaluate a company’s stock as an investment.
The ratios that can be used to evaluate a company’s stock as an investment are:
• Price / earnings ratio—The market price of a share of common stock in relation to the company’s
13. What are some common red flags in financial statement analysis?
Some of the common red flags in financial statement analysis are:
14A. What is reported in the discontinued operations section of the income statement?
15A. Describe the types of items that would be reported in the extraordinary items section of the
income statement.
Short Exercises
S15-1 Explaining financial statements
Learning Objective 1
Caleb King is interested in investing in Orange Corporation. What types of tools should Caleb use to
evaluate the company?
SOLUTION
Caleb should complete a review of the company’s performance across several periods of time. The
S15-2 Performing horizontal analysis
Learning Objective 2
McDonald Corp. reported the following on its comparative income statement:
Prepare a horizontal analysis of revenues and gross profit—both in dollar amounts and in percentages—
for 2017 and 2016.
SOLUTION
Increase (Decrease)
(Amounts in millions)
2017
2016
Revenues
Gross profit
S15-3 Calculating trend analysis
Learning Objective 2
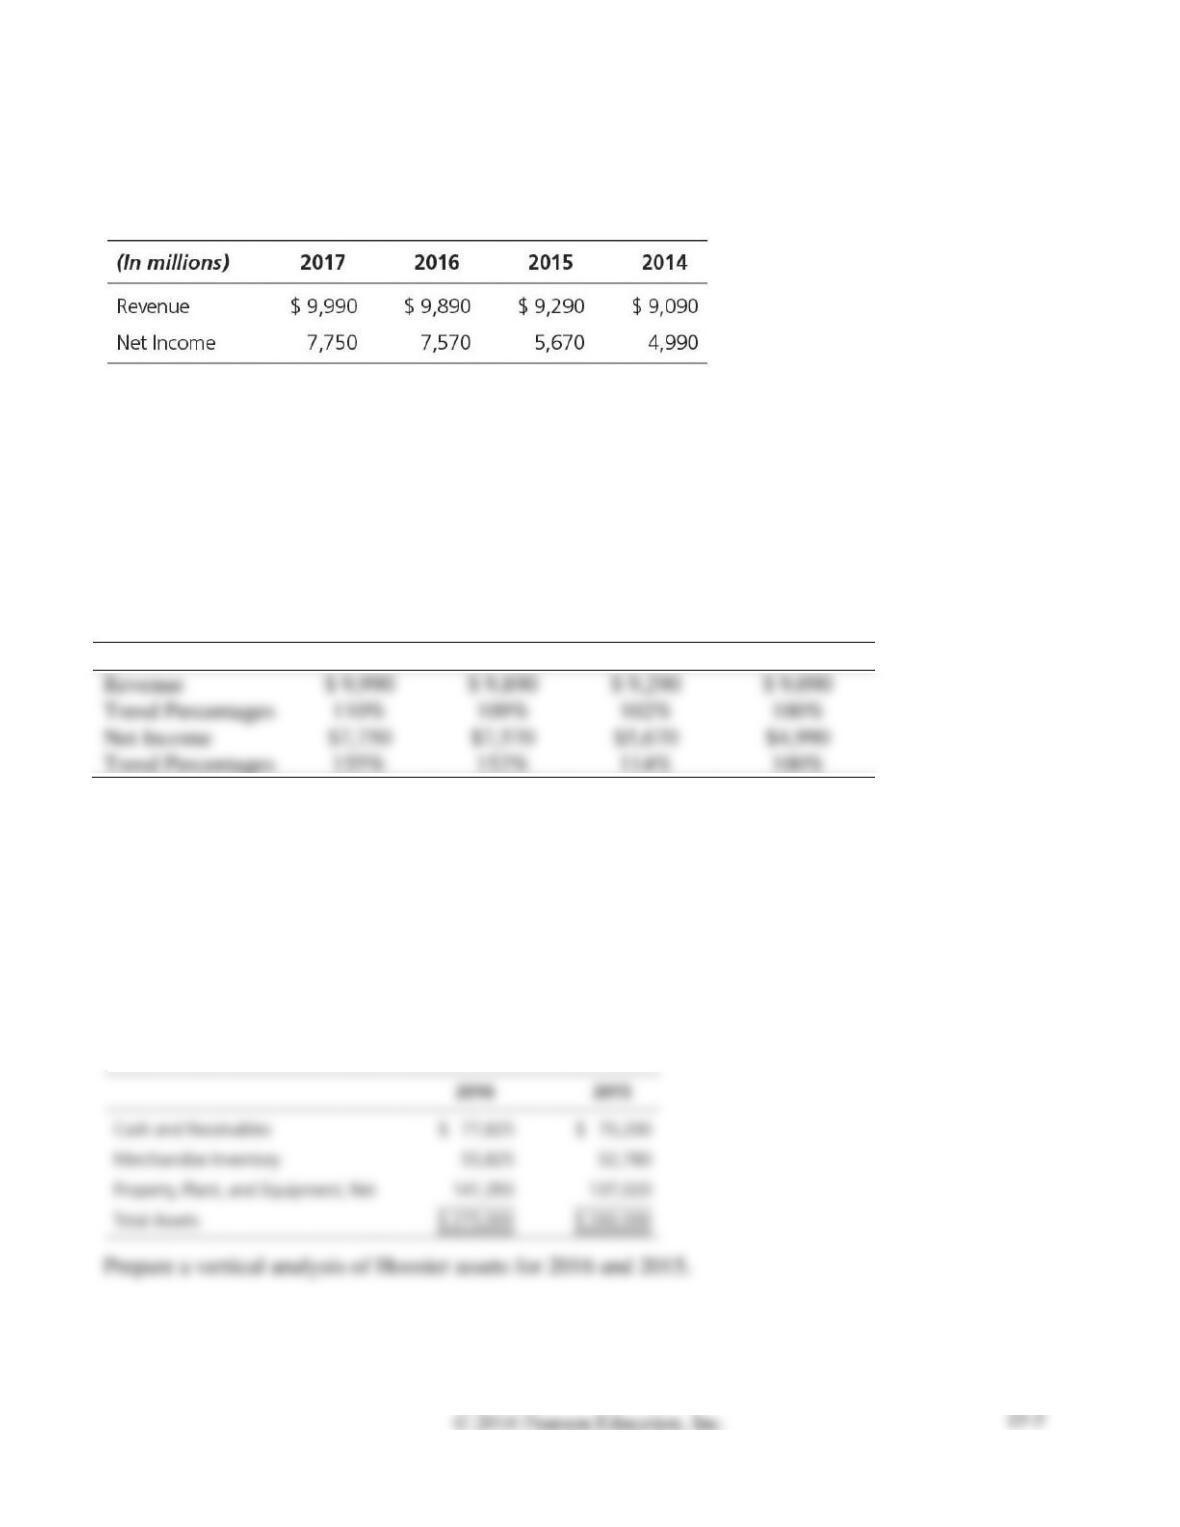
Variline Corp. reported the following revenues and net income amounts:
Requirements
1. Calculate Variline’s trend analysis for revenues and net income. Use 2014 as the base year, and
round to the nearest percent.
2. Which measure increased at a higher rate during 2015–2017?
SOLUTION
Requirement 1
2017
2016
2015
2014
Revenue
Trend Percentages
110%
102%
100%
Net Income
$4,990
Trend Percentages
155%
114%
100%
Requirement 2
Net income increased faster than revenue during 2015 – 2017.
S15-4 Performing vertical analysis
Learning Objective 3
Hoosier Optical Company reported the following amounts on its balance sheet at December 31, 2016
and 2015:
SOLUTION
Merchandise Inventory
55,825
52,780
Property, Plant and Equipment, Net
141,350
137,020
Total Assets
$ 275,000
100.0%
$260,000
S15-5 Preparing common-size income statement
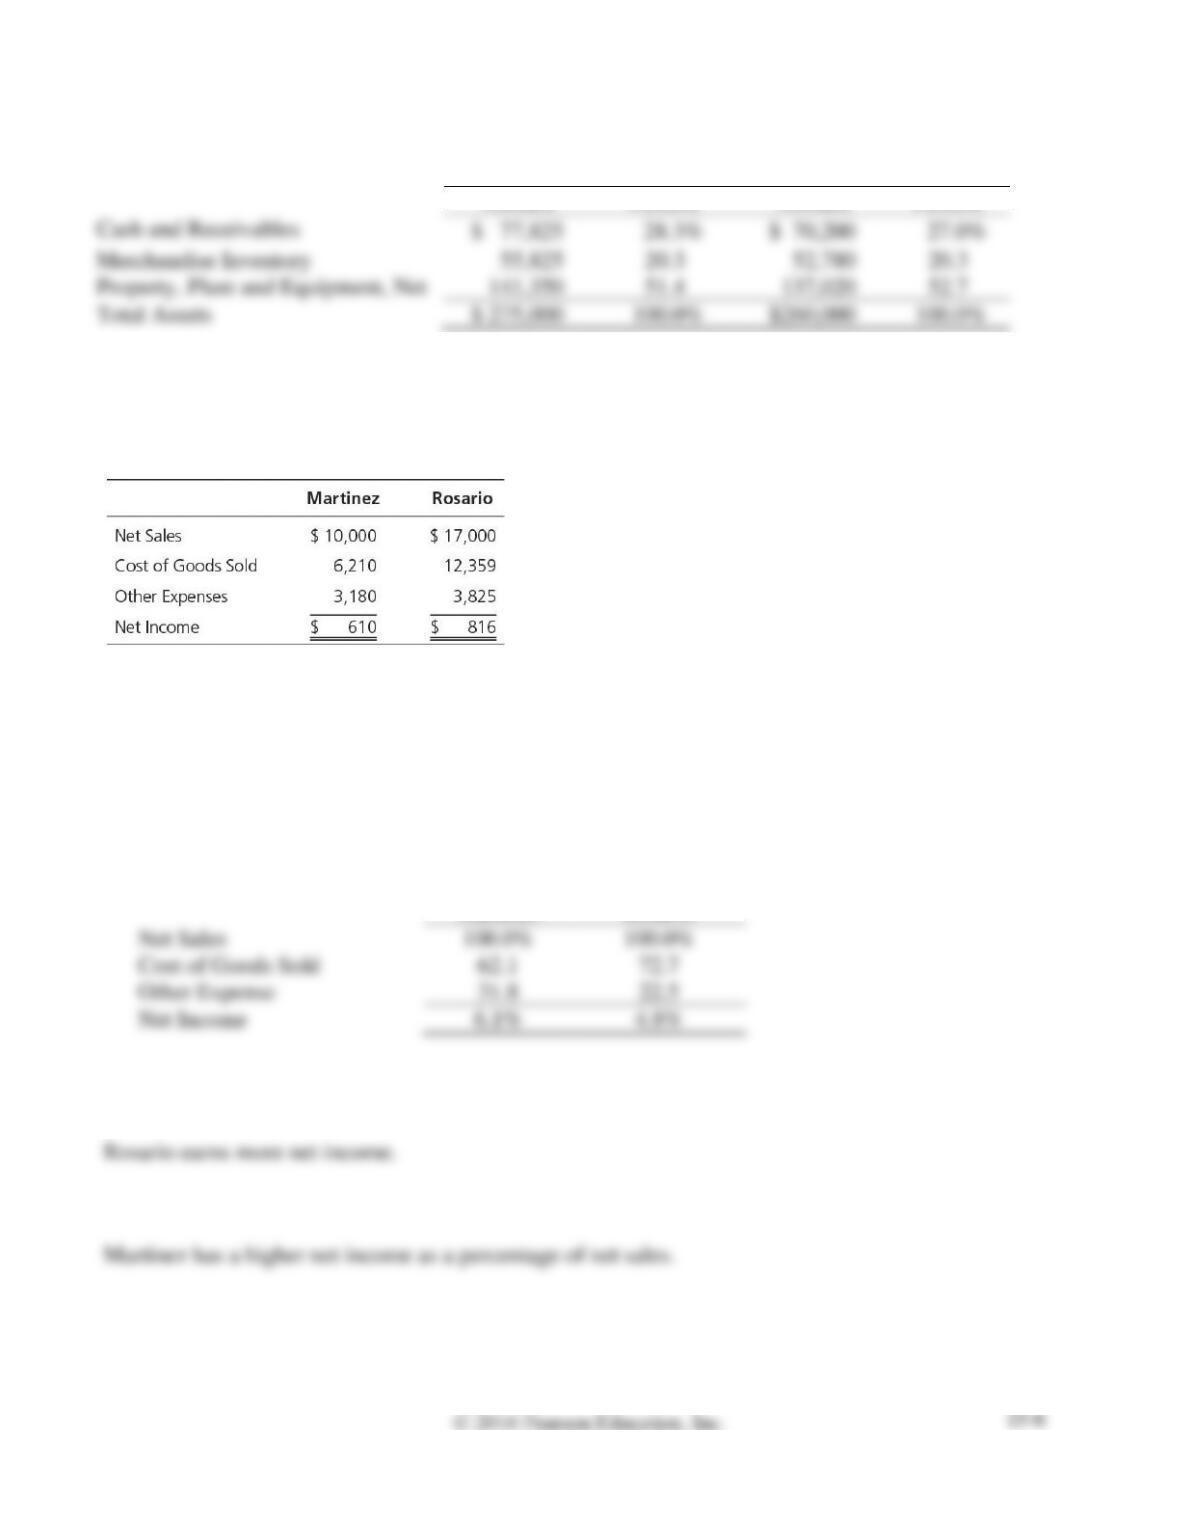
Learning Objective 3
Data for Martinez, Inc. and Rosario Corp. follow:
Requirements
1. Prepare common-size income statements.
2. Which company earns more net income?
3. Which company’s net income is a higher percentage of its net sales?
SOLUTION
Requirement 1
Martinez
Rosario
Net Sales
100.0%
Cost of Goods Sold
Other Expense
Net Income
6.1%
Requirement 2
Requirement 3
2016
2015
Amount
Percent
Amount
Percent
Use the following information for Short Exercises S15-6 through S15-10.
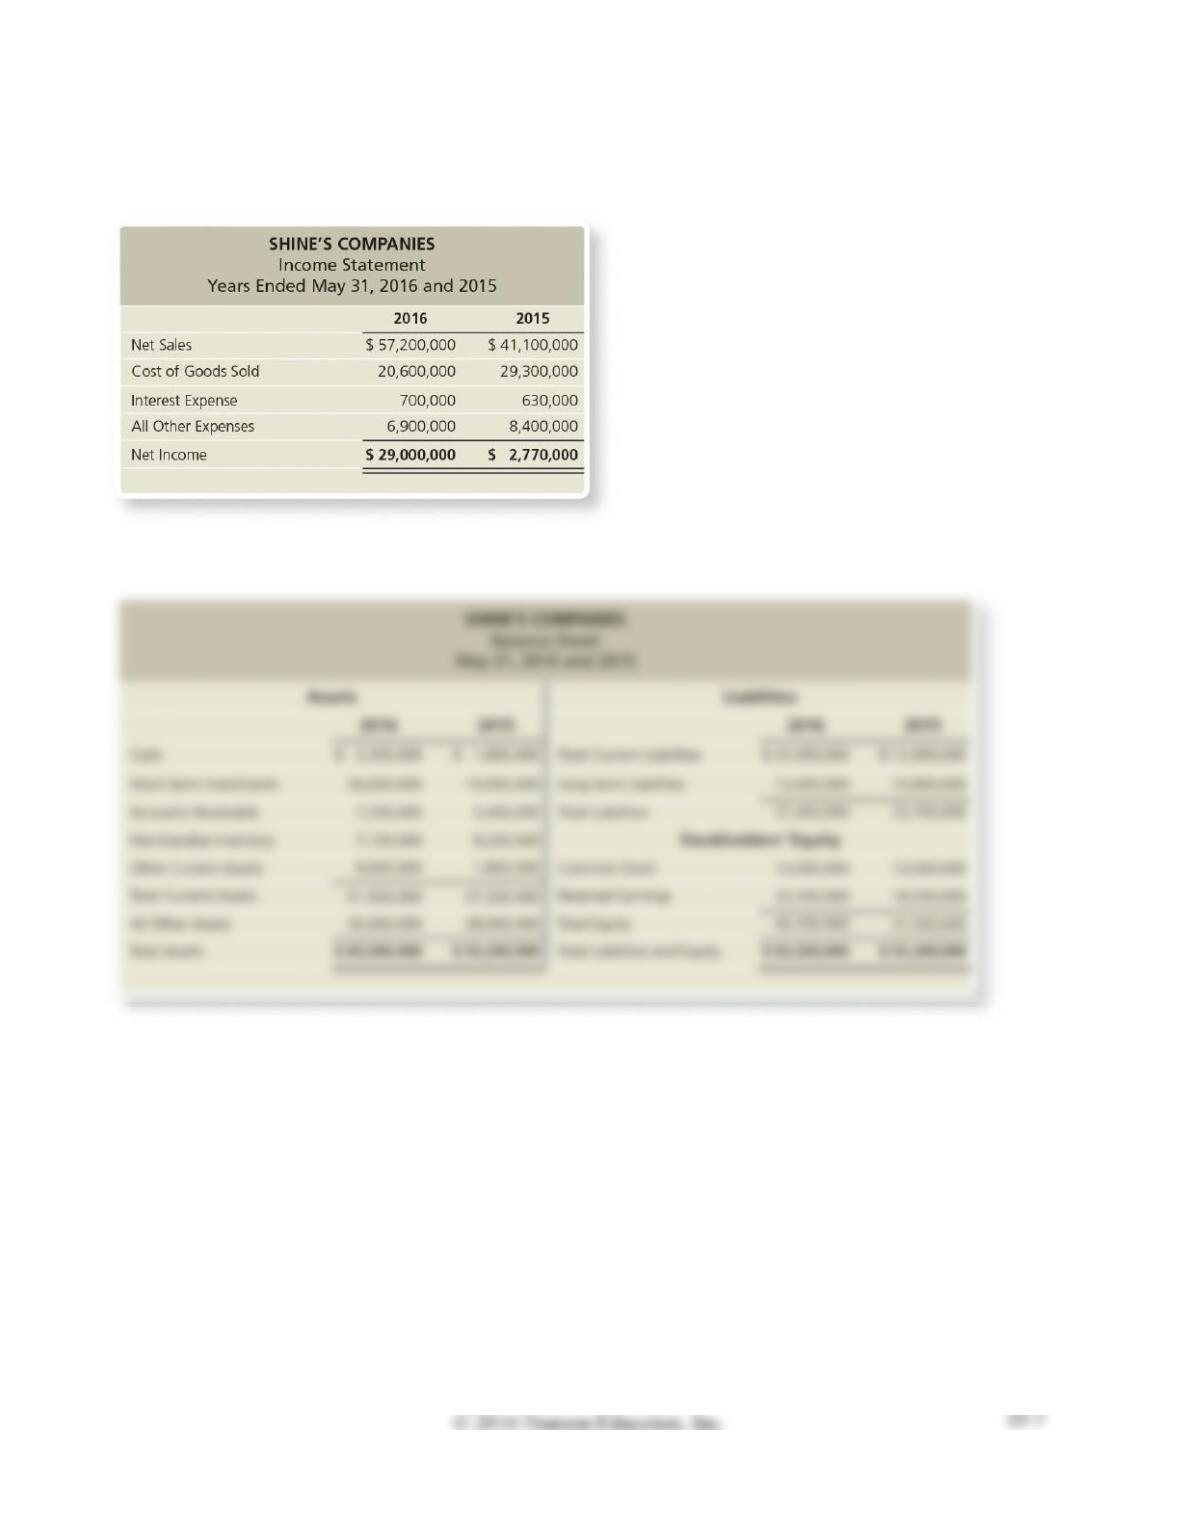
Shine’s Companies, a home improvement store chain, reported the following summarized figures:
Shine’s has 100,000 common shares outstanding during 2016.
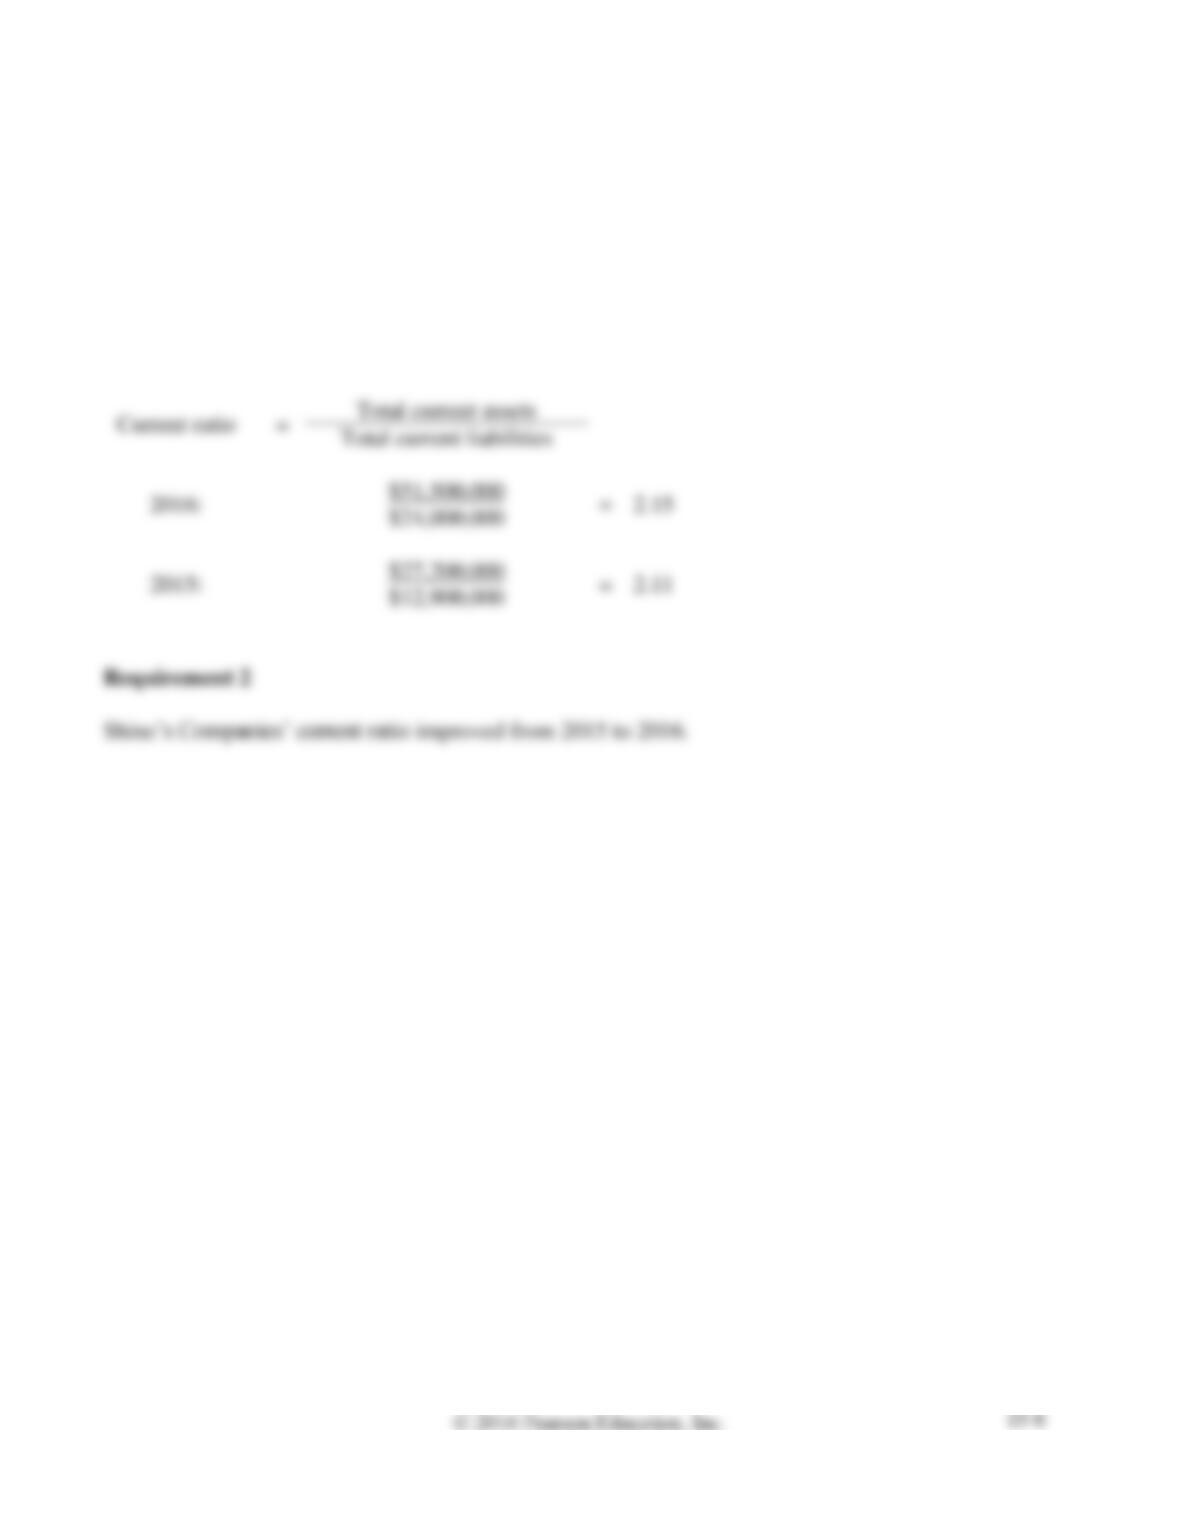
S15-6 Evaluating current ratio
Learning Objective 4
Requirements
1. Compute Shine’s Companies’ current ratio at May 31, 2016 and 2015.
2. Did Shine’s Companies’ current ratio improve, deteriorate, or hold steady during 2016?
SOLUTION
Requirement 1
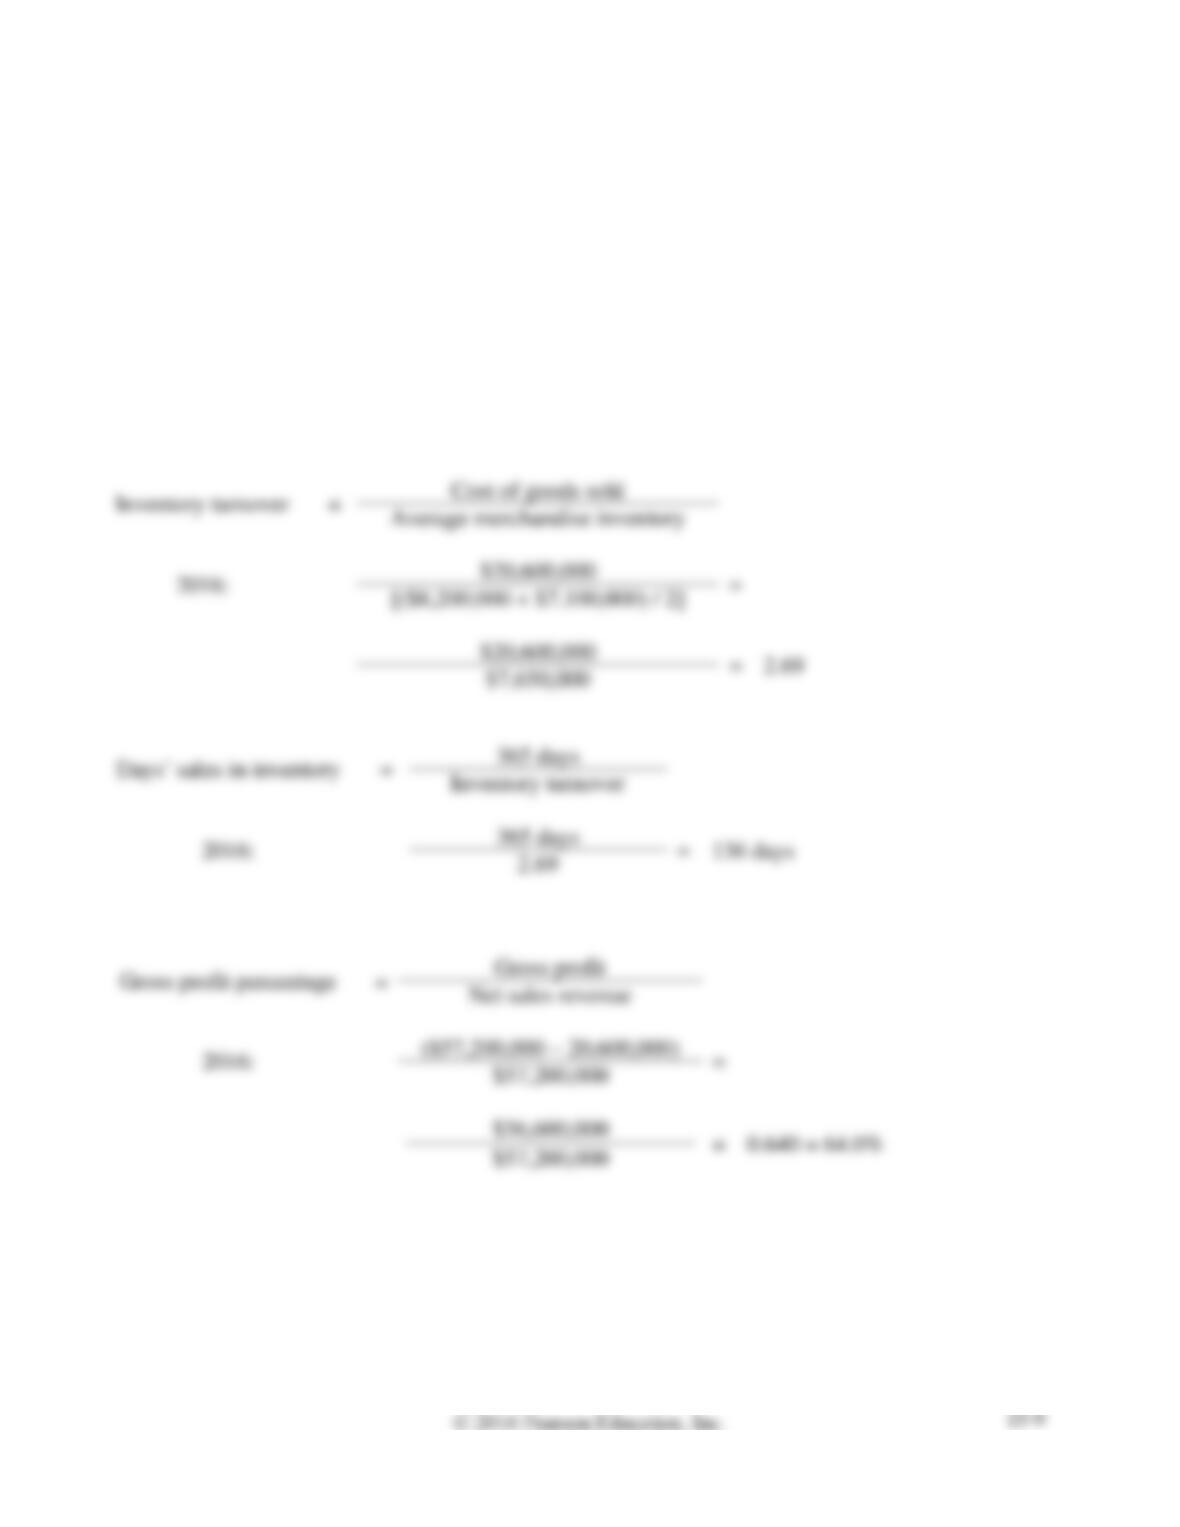
S15-7 Computing inventory, gross profit, and receivables ratios
Learning Objective 4
Requirements
1. Compute the inventory turnover, days’ sales in inventory, and gross profit percentage for Shine’s
Companies for 2016.
2. Compute days’ sales in receivables during 2016. Round dollar amounts to three decimal places.
Assume all sales were on account.
3. What do these ratios say about Shine’s Companies’ ability to sell inventory and collect receivables?
SOLUTION
Requirement 1
S15-7, cont.
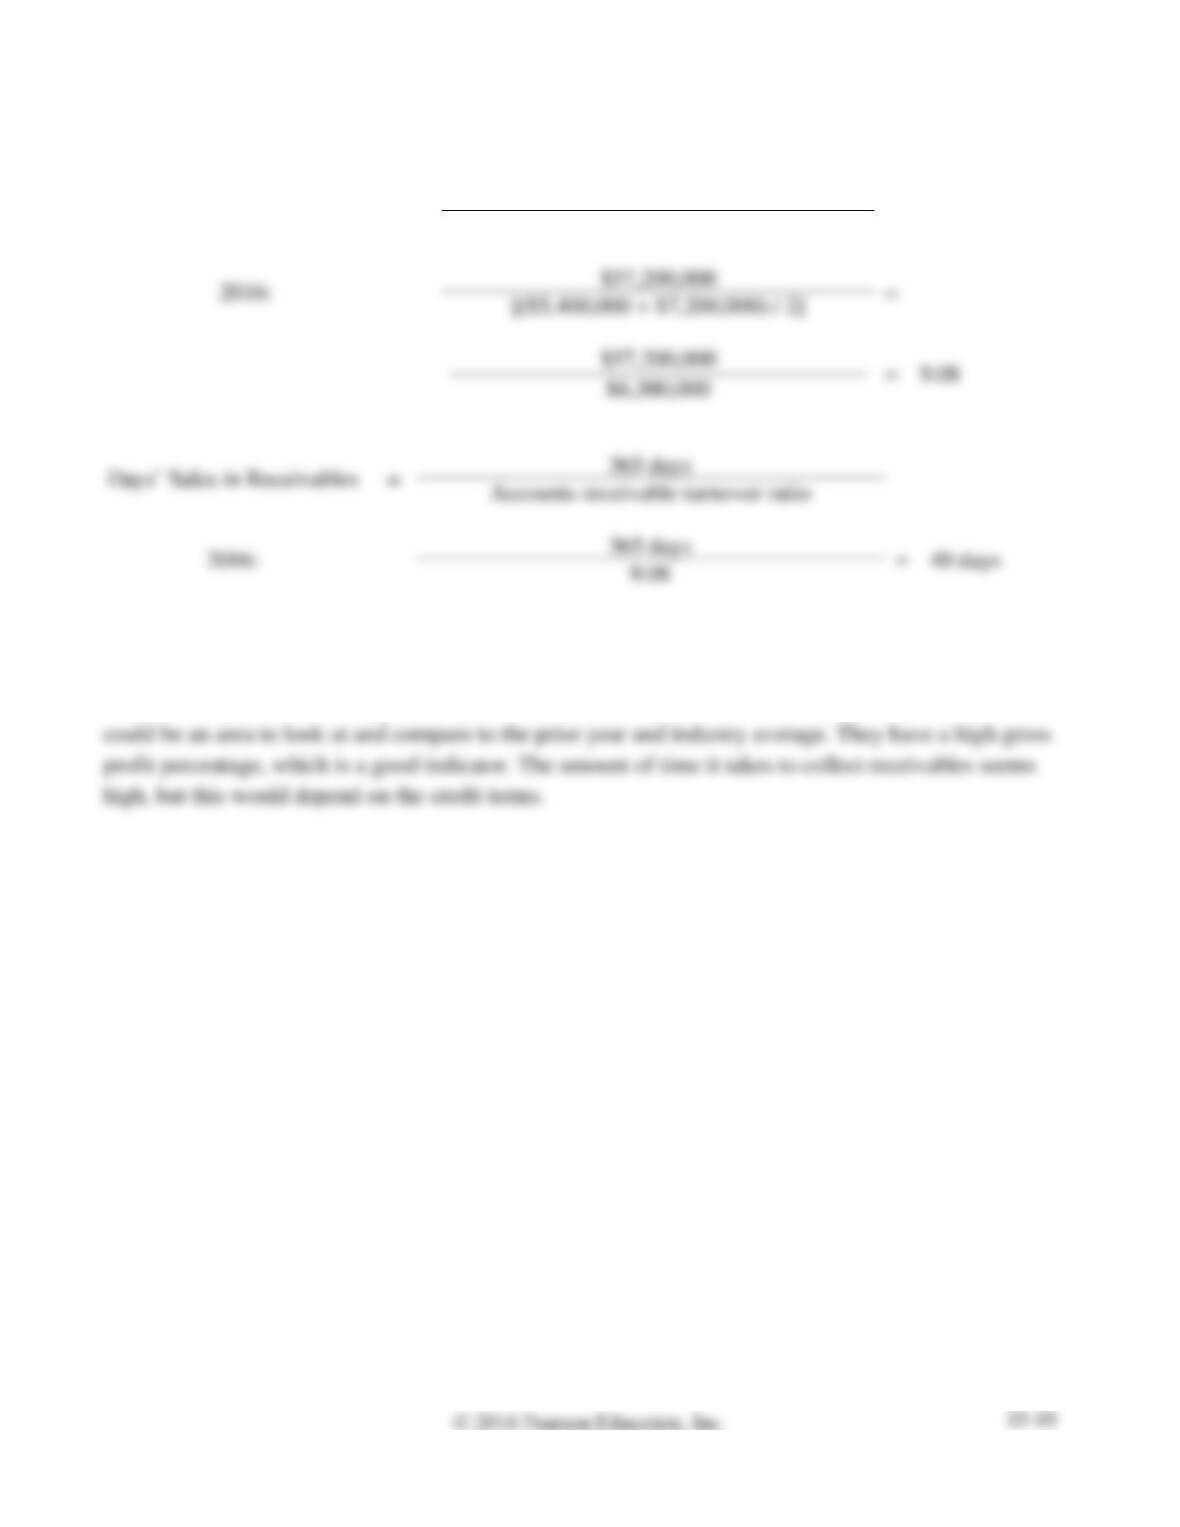
Requirement 2
Accounts receivable turnover
ratio
=
Net credit sales
Average net accounts receivables
=
Requirement 3
Shine’s Companies’ have a high amount of inventory on hand and a low inventory turnover ratio. This
S15-8 Measuring ability to pay liabilities
Learning Objective 4
Requirements
1. Compute the debt ratio and the debt to equity ratio at May 31, 2016, for Shine’s Companies.
2. Is Shine’s ability to pay its liabilities strong or weak? Explain your reasoning.
SOLUTION
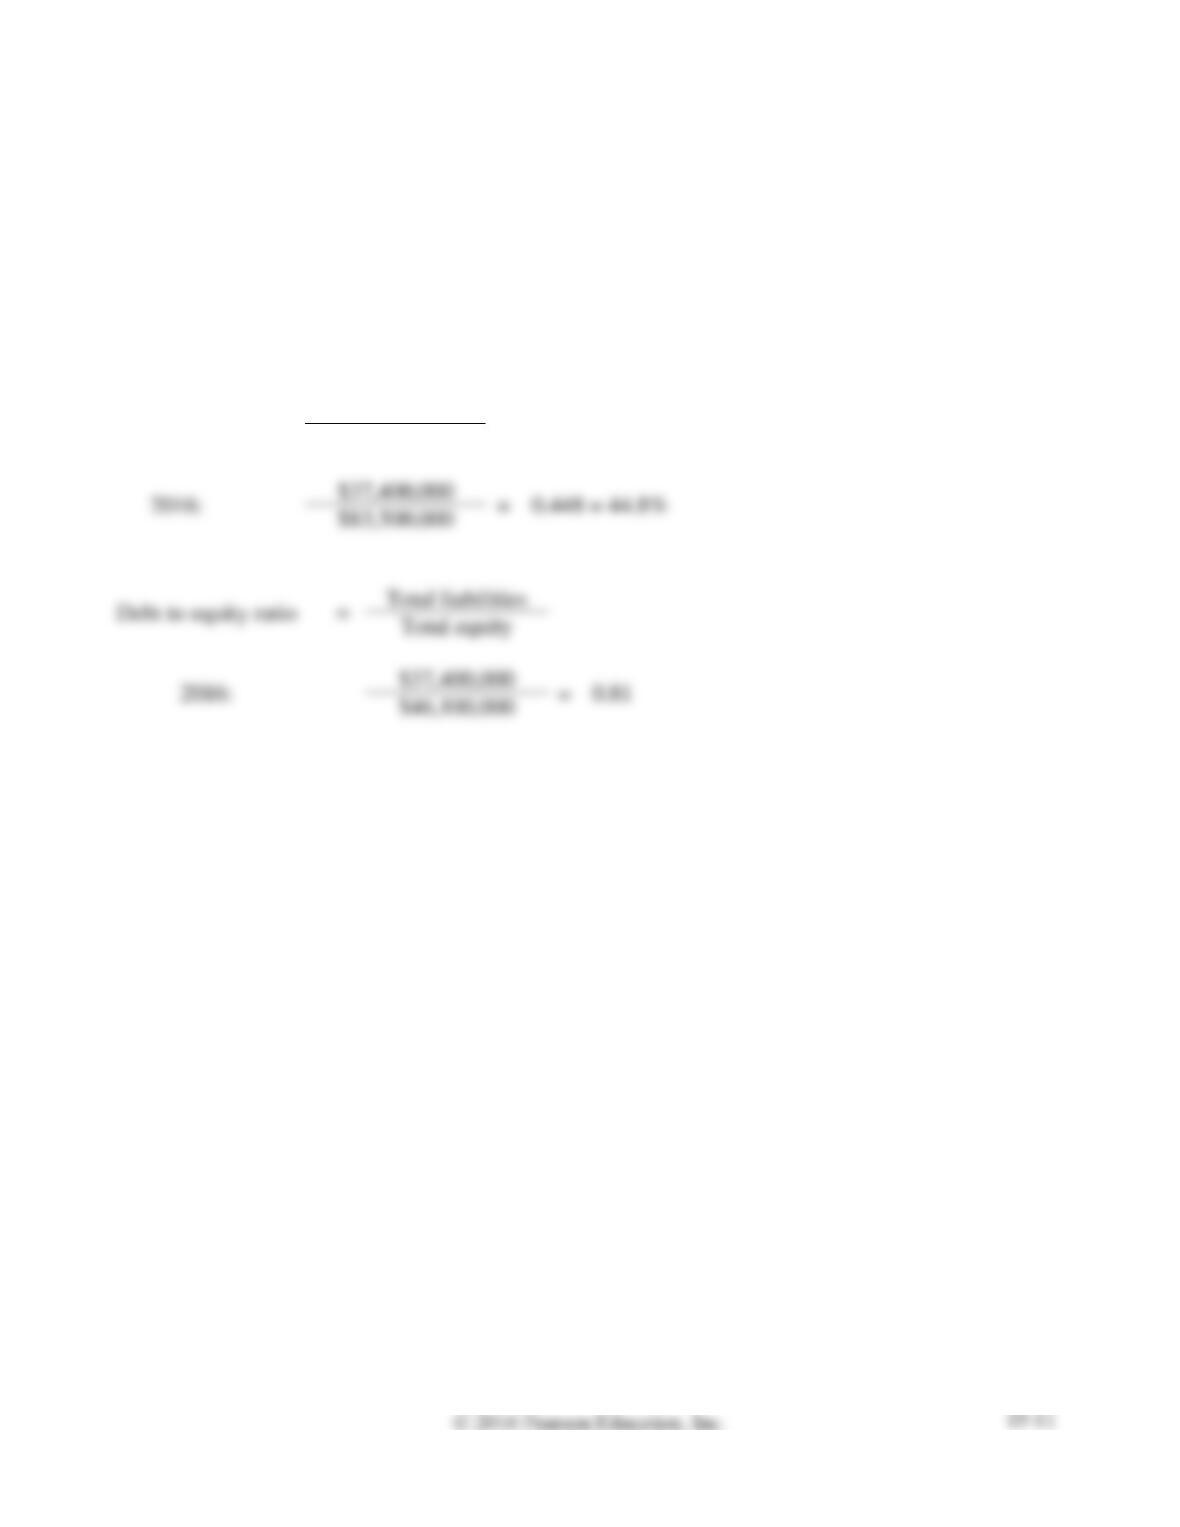
Requirement 1
Debt ratio
=
Total liabilities
Total assets
Total liabilities
Requirement 2
Shine’s debt ratio and debt to equity ratio are not very high, which indicates it’s in a strong position to
pay its liabilities.
S15-9 Measuring profitability
Learning Objective 4
Requirements
1. Compute the profit margin ratio for Shine’s Companies for 2016.
2. Compute the rate of return on total assets for 2016.
3. Compute the asset turnover ratio for 2016.
4. Compute the rate of return on common stockholders’ equity for 2016.
5. Are these rates of return strong or weak? Explain your reasoning.
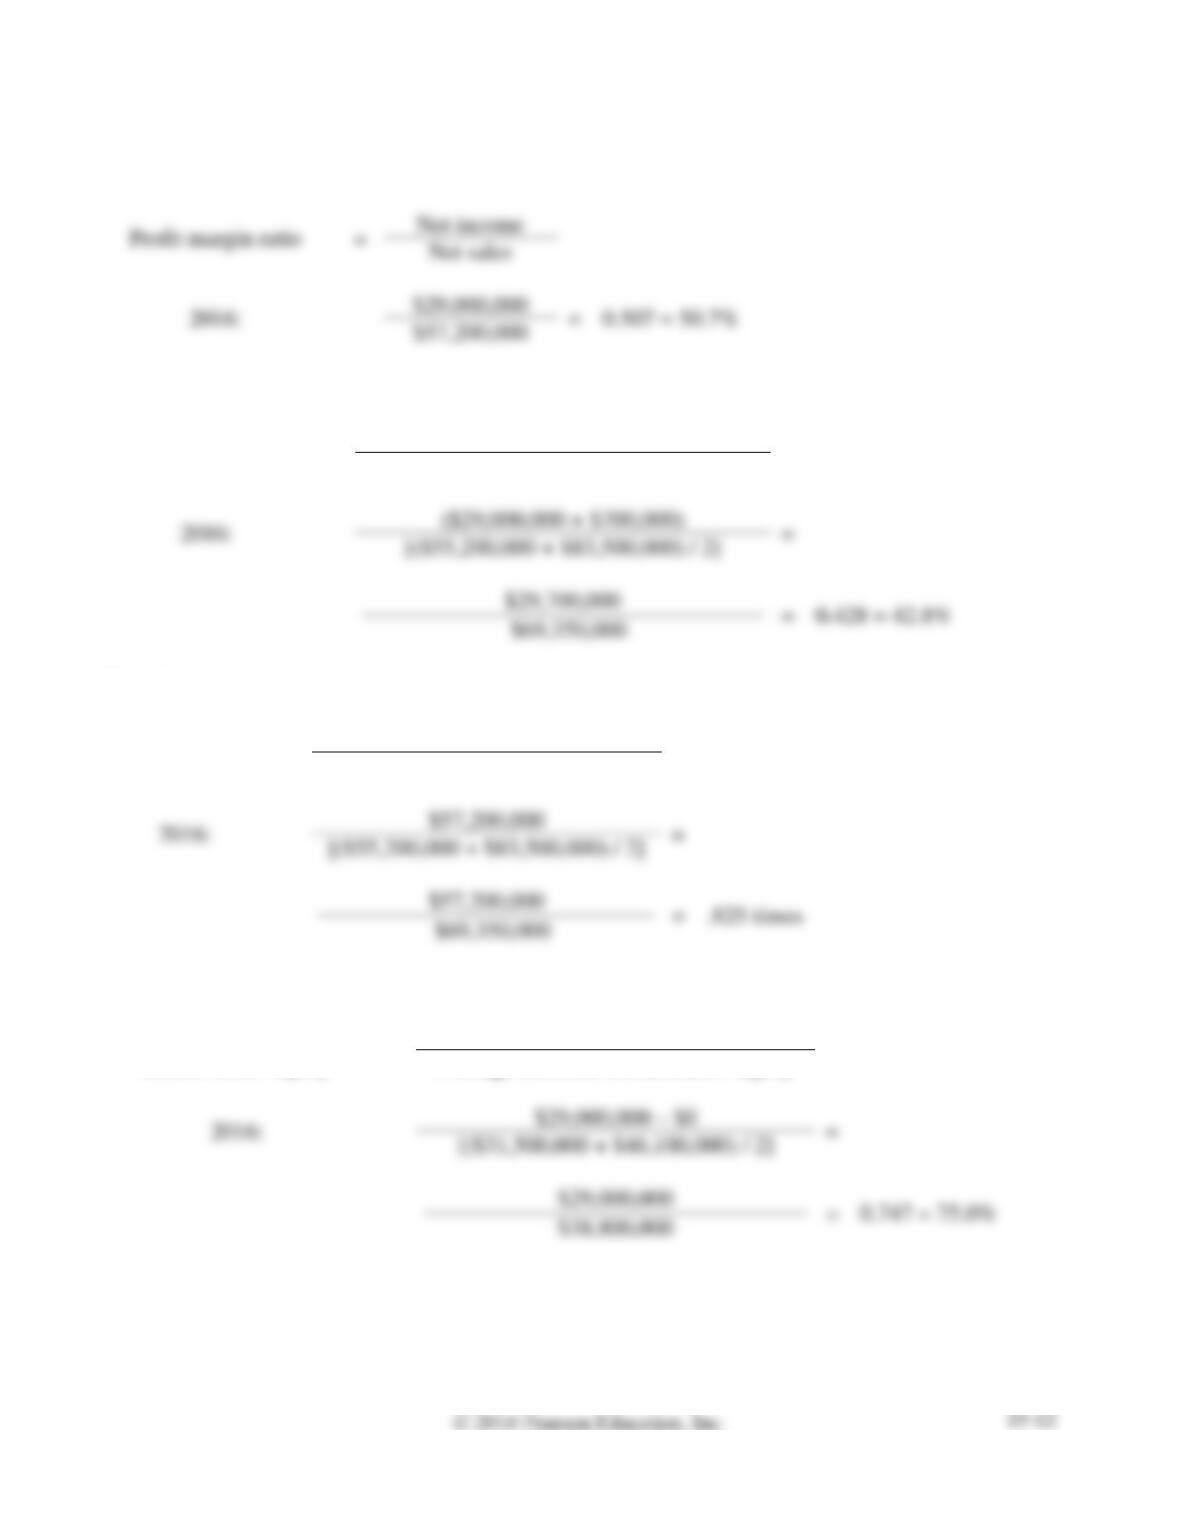
SOLUTION
Requirement 1
=
0.507 = 50.7%
Requirement 2
Rate of return on total
assets
=
Net income + Interest expense
Average total assets
($29,000,000 + $700,000)
=
Requirement 3
Asset turnover
ratio
=
Net sales
Average total assets
$57,200,000
=
Requirement 4
Rate of return on common
stockholders’ equity
=
Net income – Preferred dividends
Average common stockholders’ equity
=
Requirement 5
The rates of return are strong. The rate of return on total assets is 42.8% and the rate of return on
common stockholder’s equity is 75.0%.
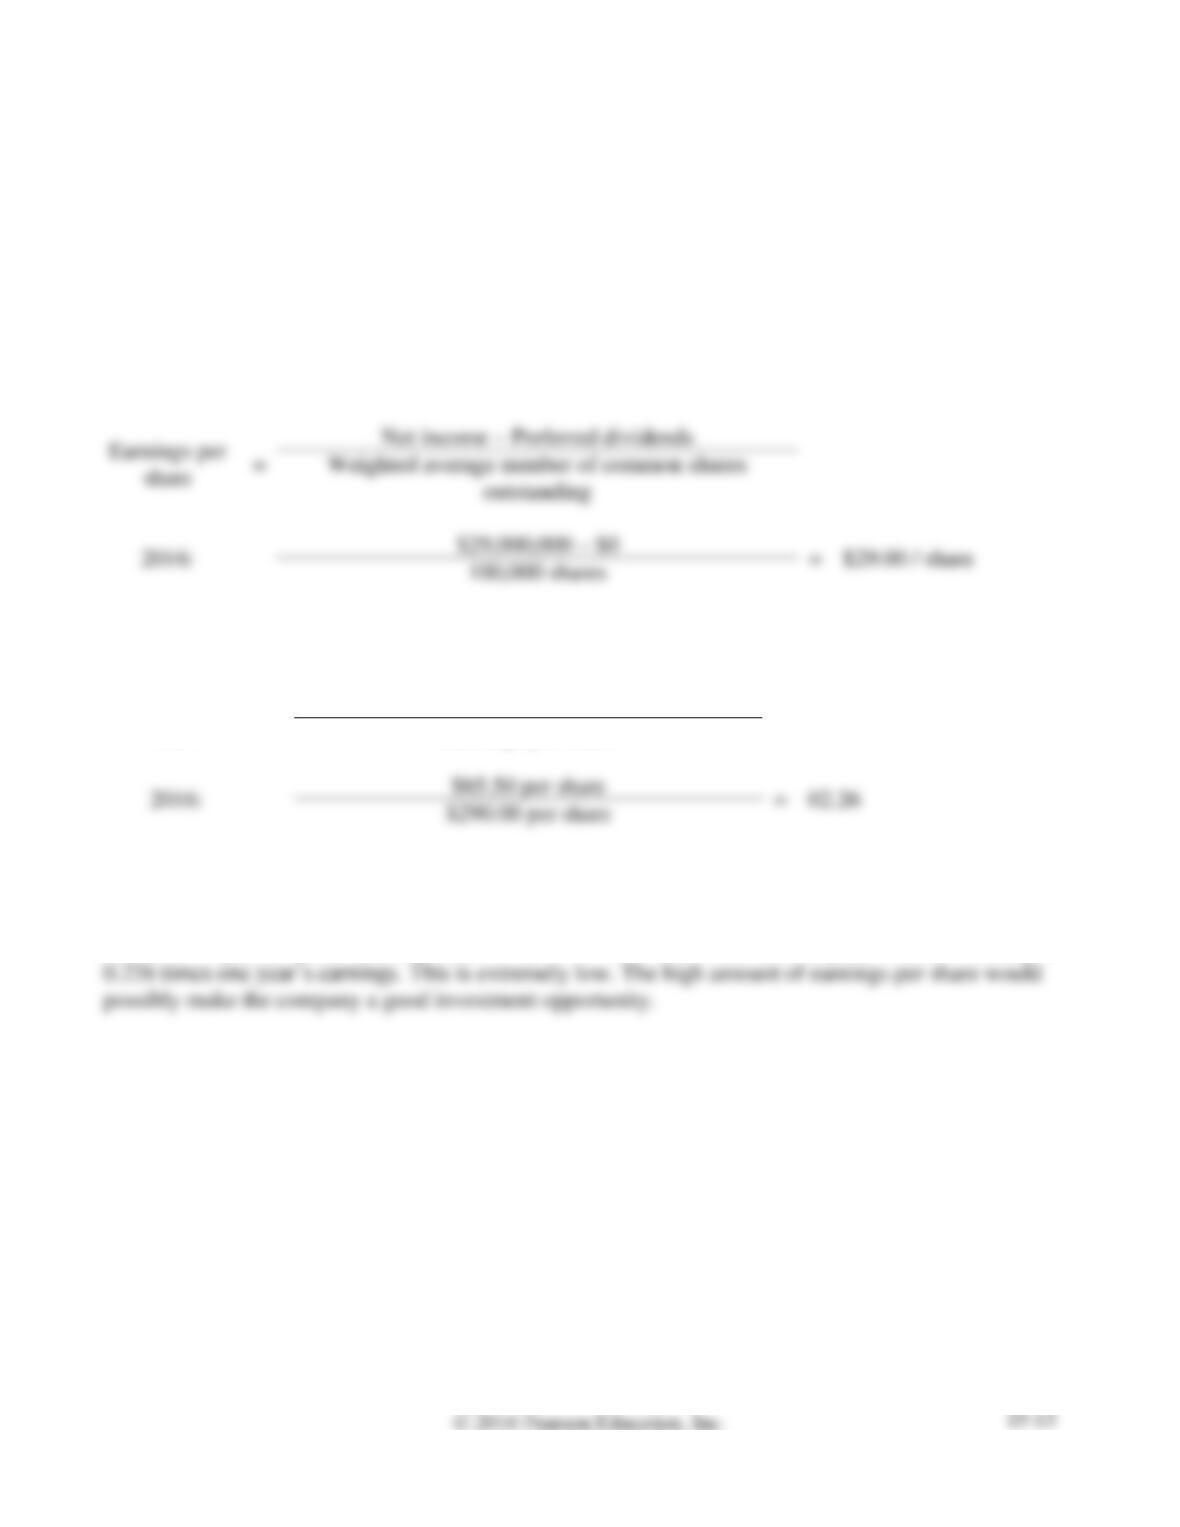
S15-10 Computing EPS and P/E ratio
Learning Objective 4
Requirements
1. Compute earnings per share (EPS) for 2016 for Shine’s. Round to the nearest cent.
2. Compute Shine’s Companies’ price/earnings ratio for 2016. The market price per share of Shine’s
stock is $65.50.
3. What do these results mean when evaluating Shine’s Companies’ profitability?
SOLUTION
Requirement 1
=
$29.00 / share
Requirement 2
Price/earnings
ratio
=
Market price per share of common stock
Earnings per share
=
02.26
Requirement 3
Shine’s Companies’ price /earnings ratio for 2016 of 0226 means that the company’s stock is selling at
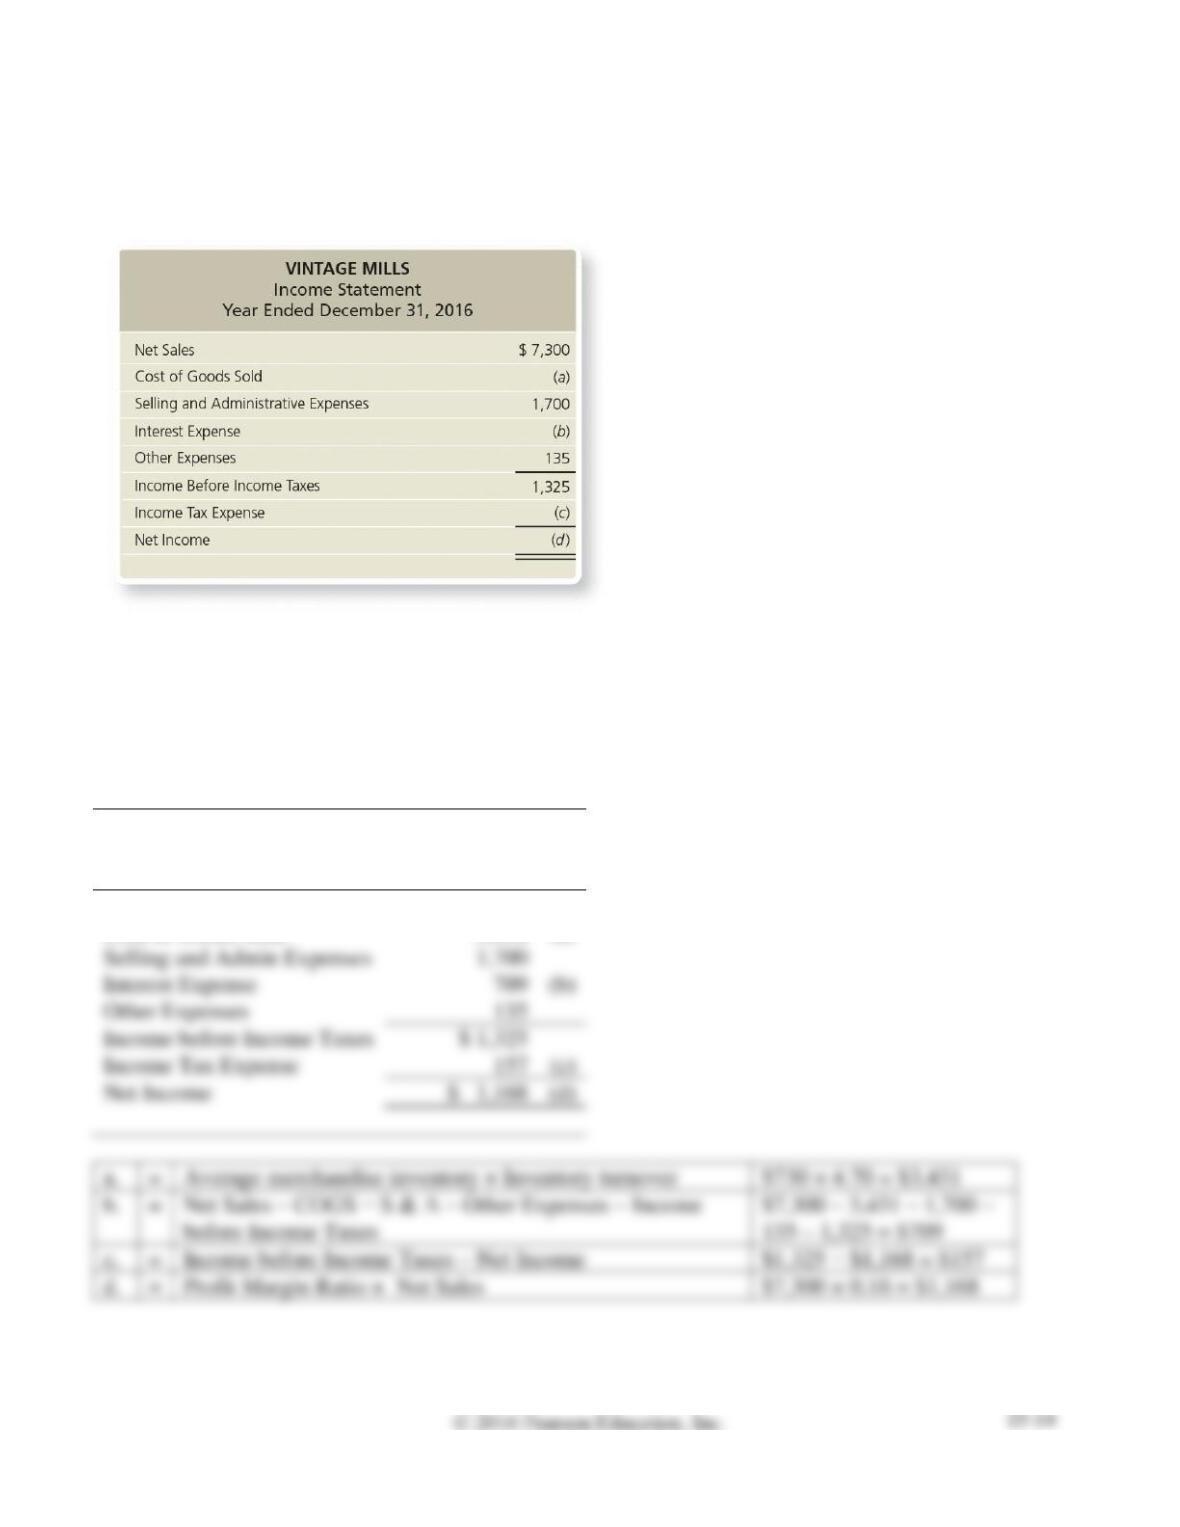
S15-11 Using ratios to reconstruct an income statement
Learning Objective 4
Vintage Mills’s income statement appears as follows (amounts in thousands):
Use the following ratio data to complete Vintage Mills’s income statement:
1. Inventory turnover is 4.70 (beginning Merchandise Inventory was $750; ending Merchandise
Inventory was $710).
2. Profit margin ratio is 0.16.
SOLUTION
VINTAGE MILLS
Income Statement
Year Ended December 31, 2016
Net Sales
$ 7,300
Cost of Goods Sold
3,431
(a)
Selling and Admin Expenses
1,700
Interest Expense
(b)
Other Expenses
135
Income before Income Taxes
$ 1,325
Income Tax Expense
(c)
Net Income
$ 1,168
(d)
=
Average merchandise inventory × Inventory turnover
$730 × 4.70 = $3,431
before Income Taxes
135 – 1,325 = $709
=
Income before Income Taxes – Net Income
d.
=
Profit Margin Ratio × Net Sales
$7,300 × 0.16 = $1,168
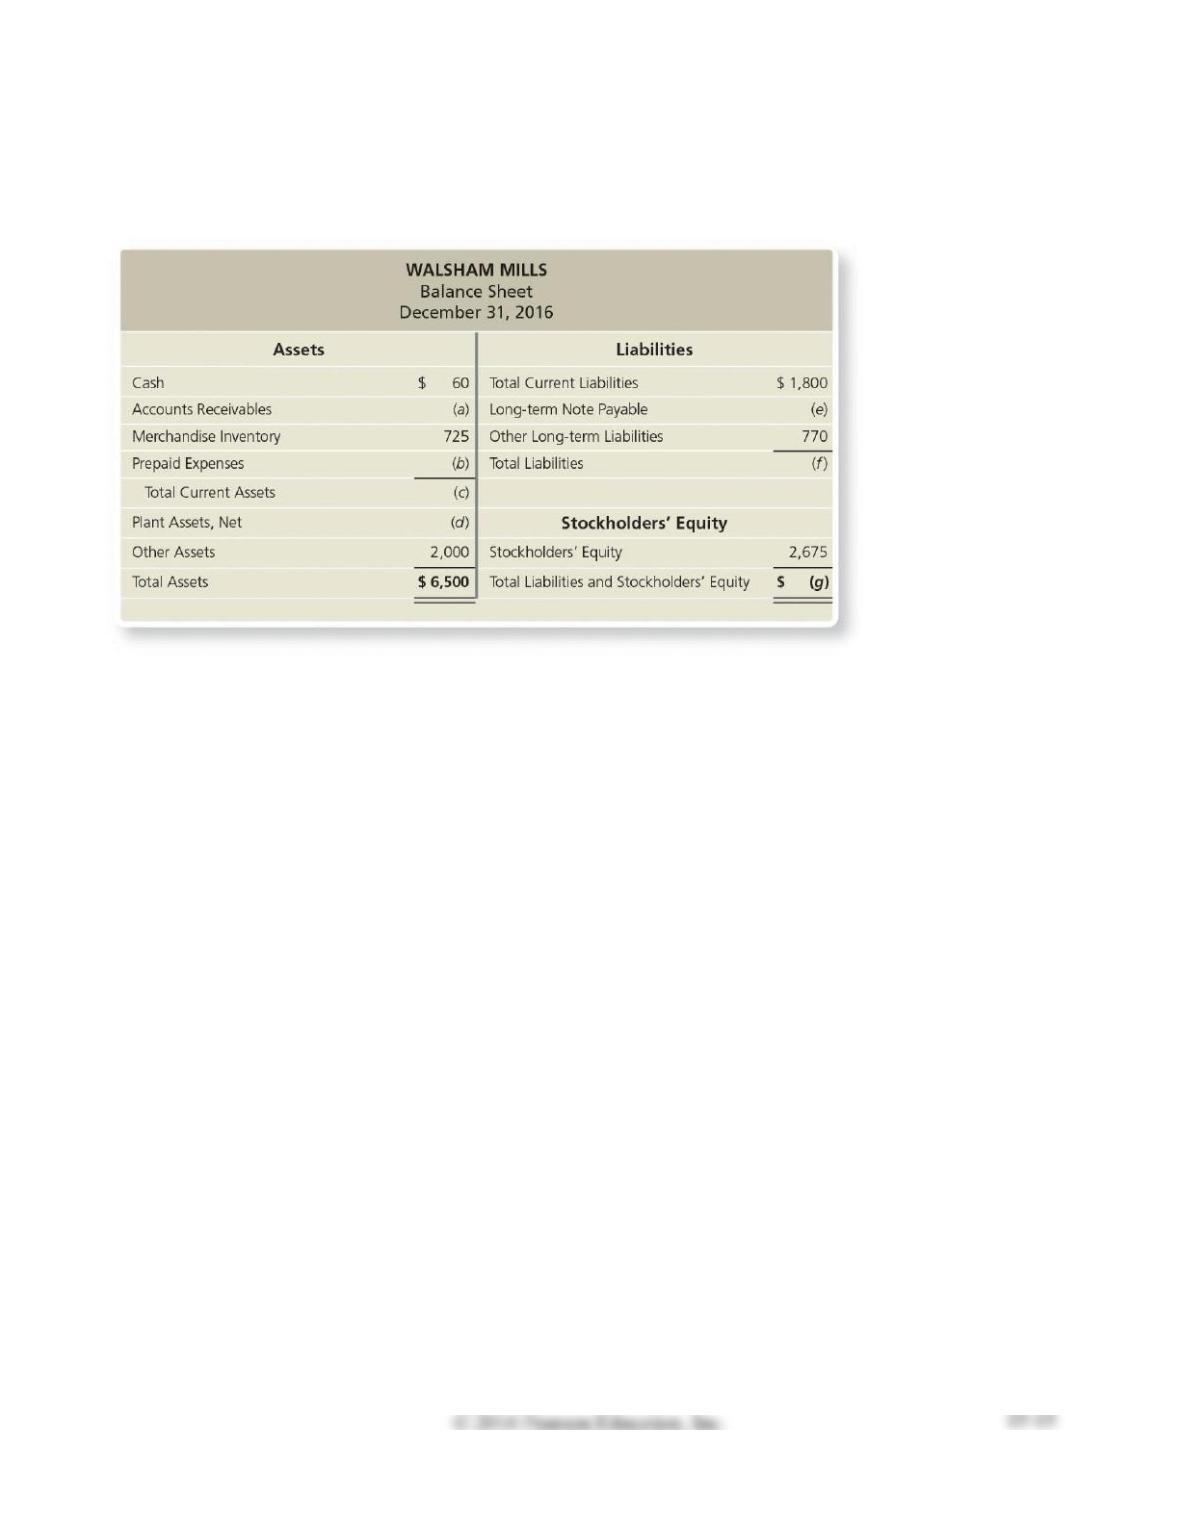
S15-12 Using ratios to reconstruct a balance sheet
Learning Objective 4
Walsham Mills’s balance sheet appears as follows (amounts in thousands):
Use the following ratio data to complete Walsham Mills’s balance sheet.
a. Current ratio is 0.86.
b. Acid-test ratio is 0.40.
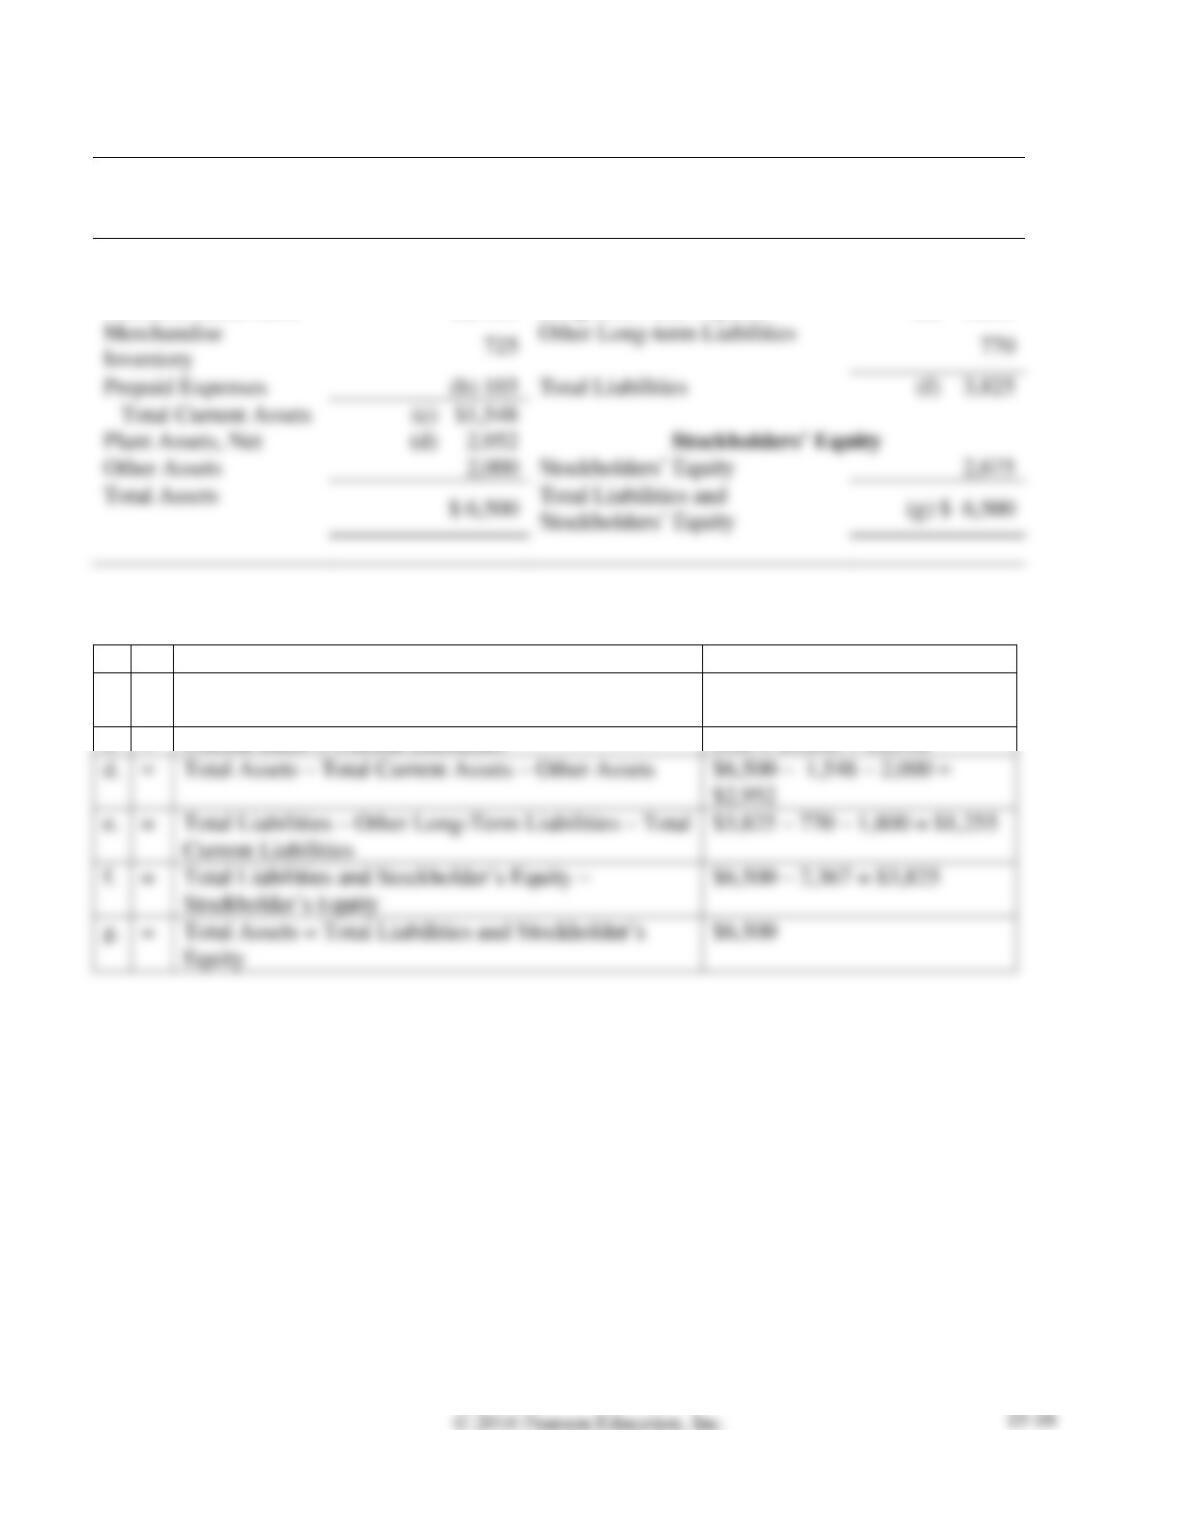
SOLUTION
WALSHAM MILLS
Balance Sheet
December 31, 2016
Assets
Liabilities
Cash
$ 60
Total Current Liabilities
$ 1,800
Accounts Receivable
(a) 660
Long-term Note Payable
(e) 1,255
Merchandise
Inventory
Other Long-term Liabilities
Prepaid Expenses
Total Liabilities
Total Current Assets
Plant Assets, Net
Other Assets
2,675
Total Assets
Total Liabilities and
a.
=
(Acid-test Ratio × Total Current Liabilities) − Cash
(0.40 x $1,800) – 60 = $660
b.
=
Total Current Assets – Cash – Accounts Receivable –
Merchandise Inventory
($1,548 – 60 – 660 – 725) =
$103
c.
=
Current Ratio × Current Liabilities
0.86 × $1,800 = $1,548
=
Total Liabilities – Other Long-Term Liabilities – Total
Current Liabilities
$3,825 – 770 – 1,800 = $1,255
=
$6,500 – 2,367 = $3,825
g.
=
Total Assets = Total Liabilities and Stockholder’s
Equity
$6,500
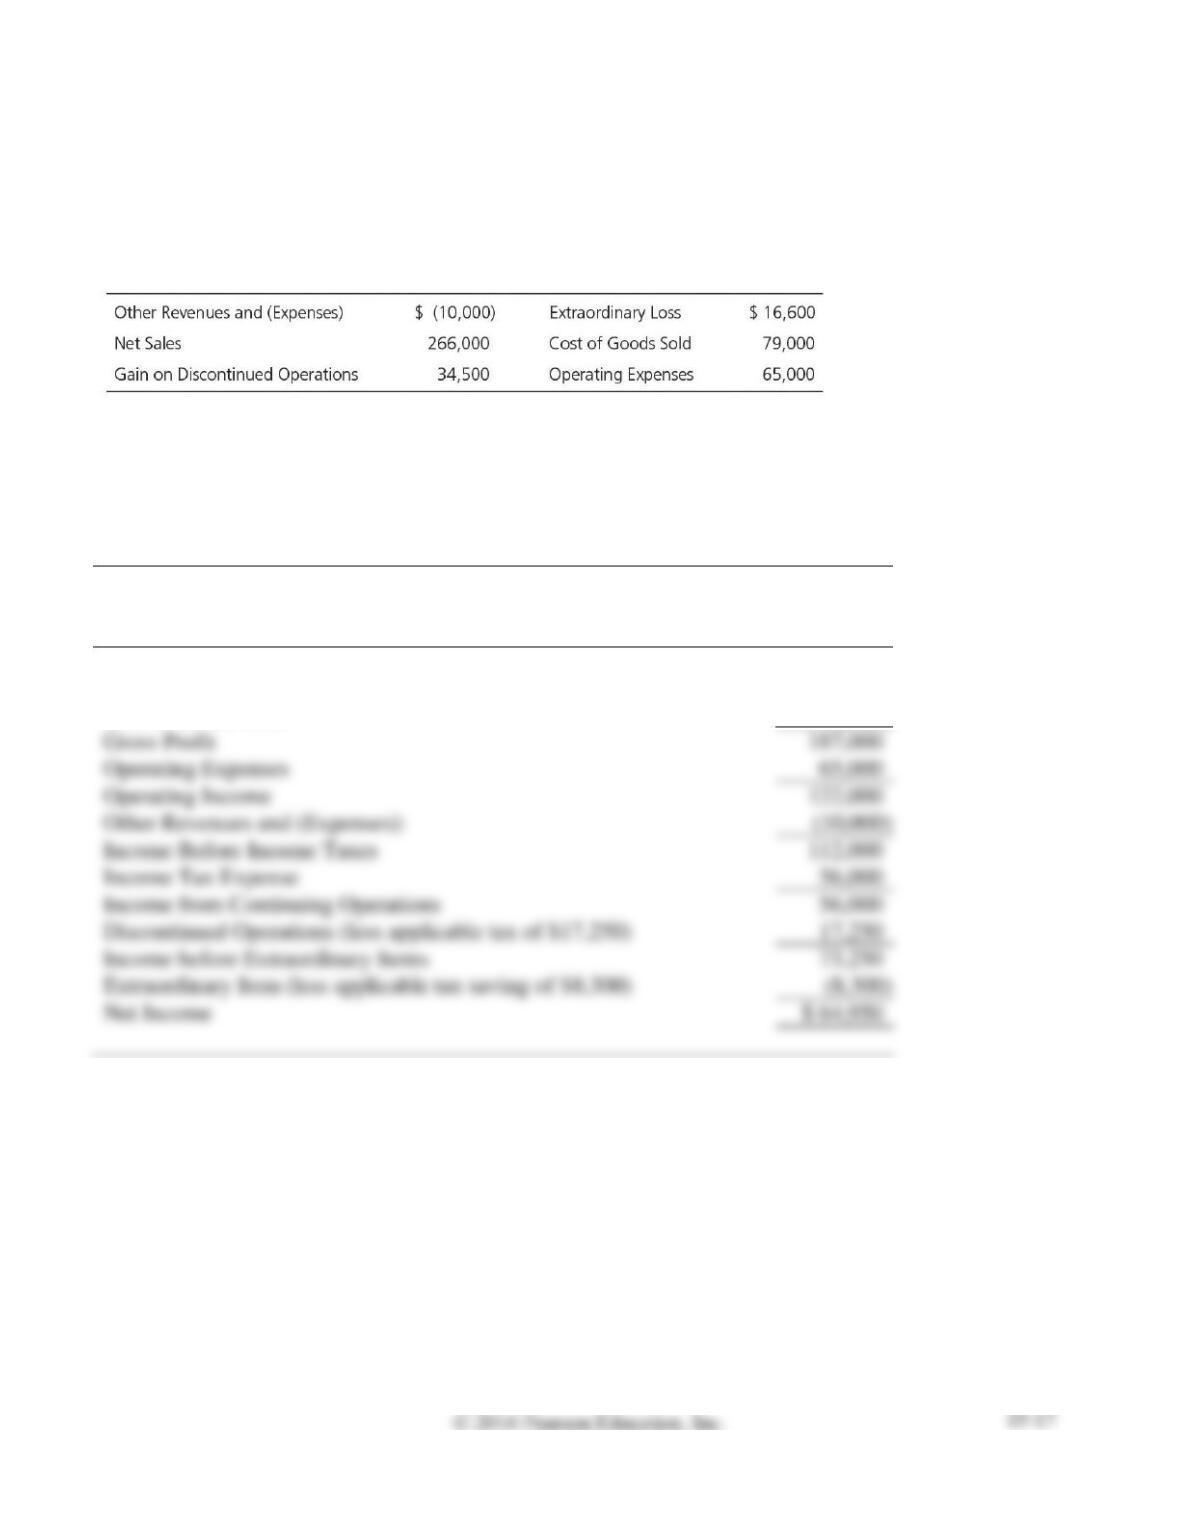
S15A-13 Preparing a corporate income statement
Learning Objective 5
Appendix 15A
TST Corporation’s accounting records include the following items, listed in no particular order, at
December 31, 2016:
The income tax rate for TST Corporation is 50%.
Prepare TST’s income statement for the year ended December 31, 2016. Omit earnings per share. Use
the multi-step format.
SOLUTION
TST CORPORATION
Income Statement
Year Ended December 31, 2016
Net Sales
$ 266,000
Cost of Goods Sold
79,000
Gross Profit
Operating Expenses
65,000
Other Revenues and (Expenses):
Income Before Income Taxes
Income Tax Expense
56,000
Income from Continuing Operations
56,000
Discontinued Operations (less applicable tax of $17,250)
17,250
Income before Extraordinary Items
73,250
Extraordinary Item (less applicable tax saving of $8,300)
Net Income
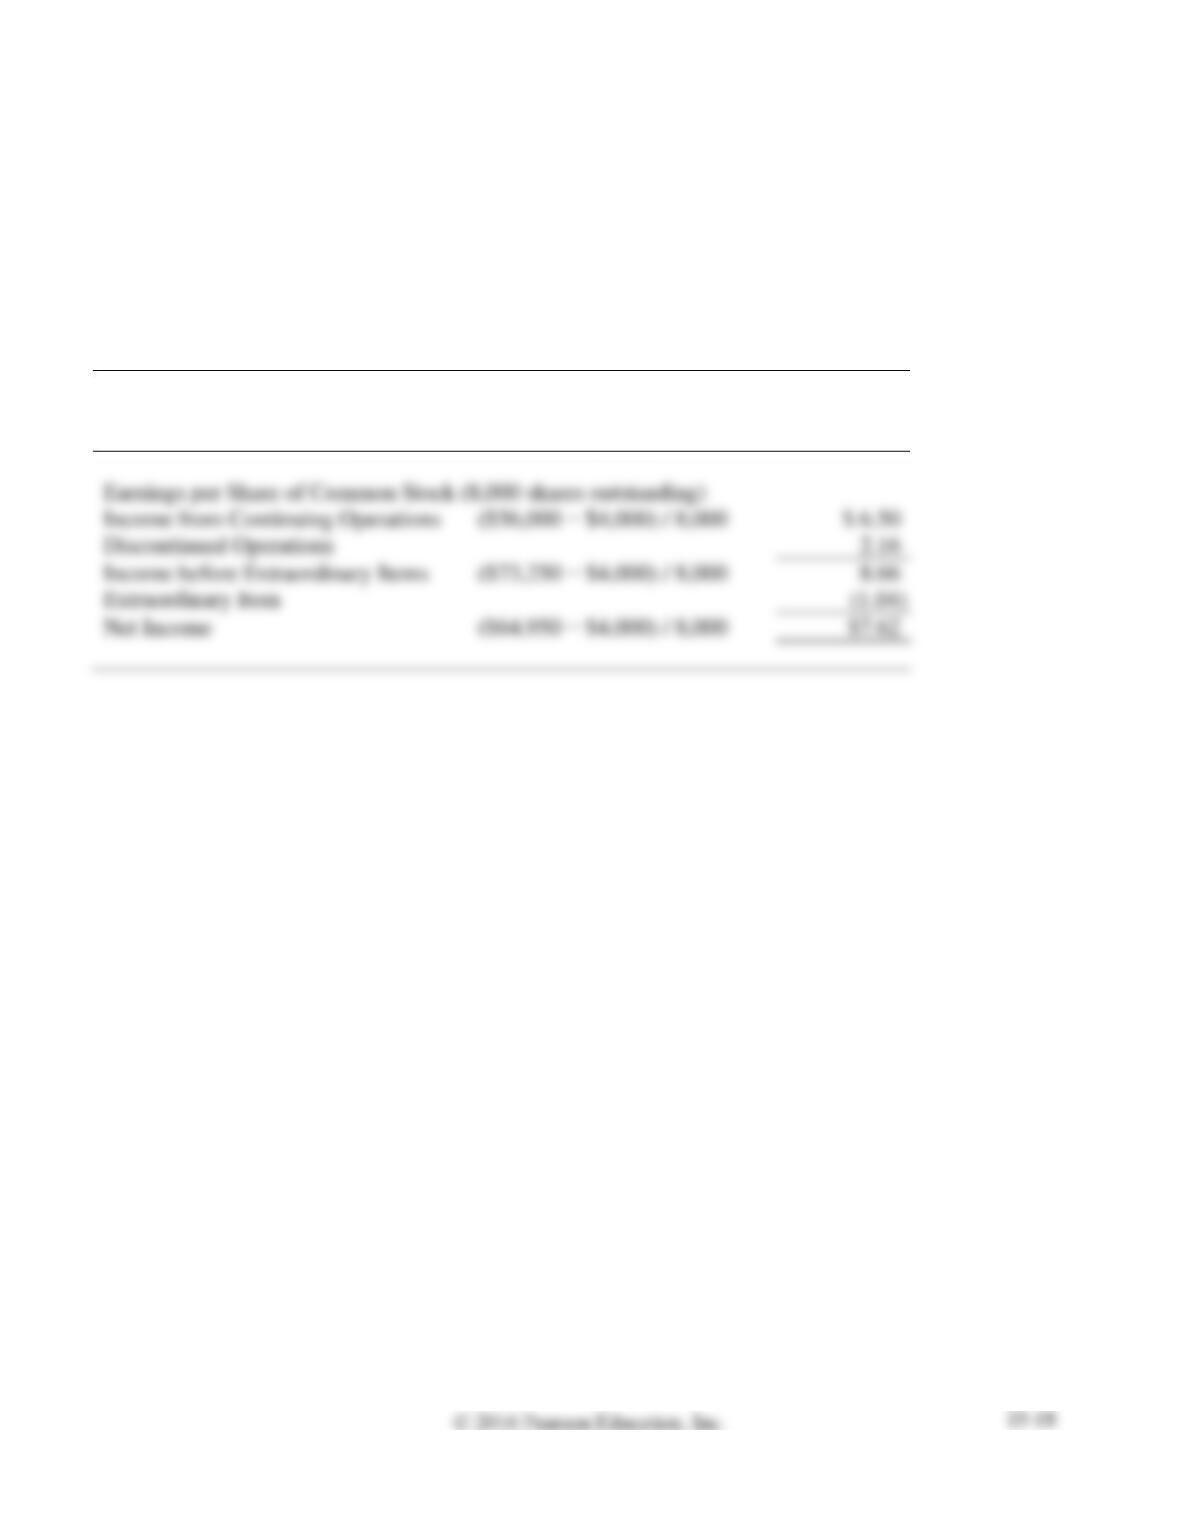
S15A-14 Reporting earnings per share
Learning Objective 5
Appendix 15A
Return to the TST data in Short Exercise S15A-13. TST had 8,000 shares of common stock outstanding
during 2016. TST declared and paid preferred dividends of $4,000 during 2016.
Show how TST reports EPS data on its 2016 income statement.
SOLUTION
TST CORPORATION
Income Statement
Year Ended December 31, 2016
Exercises
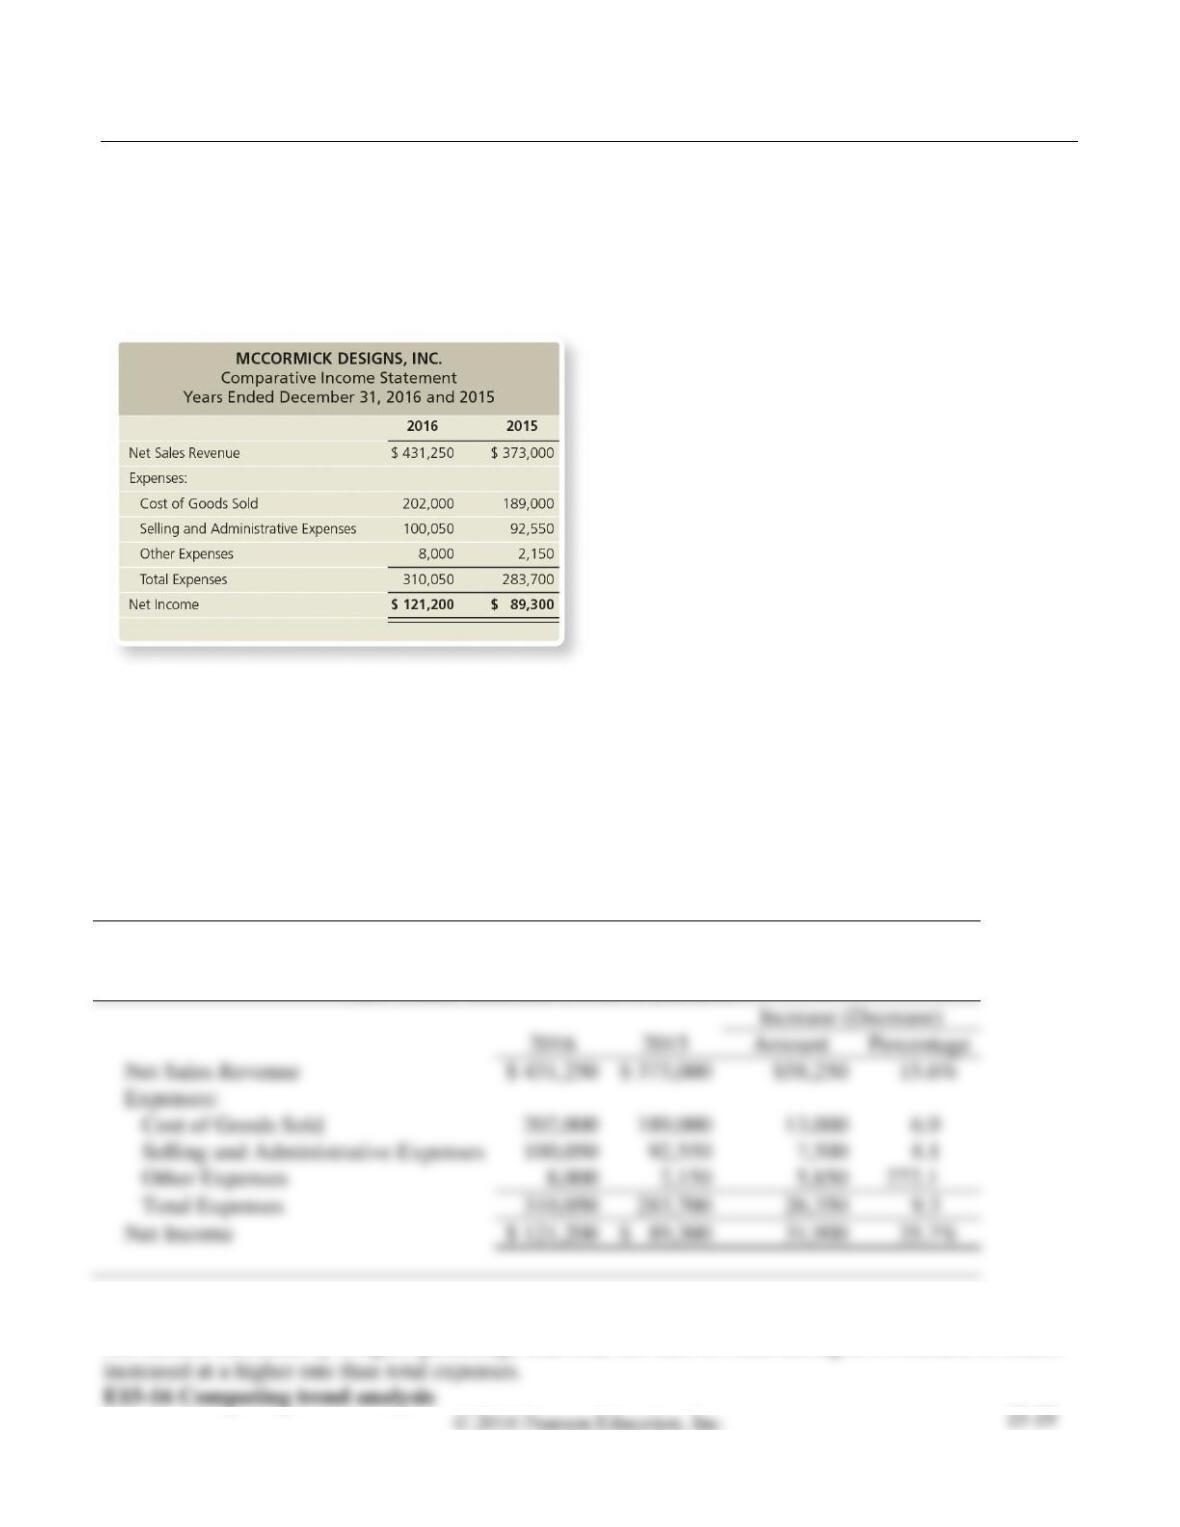
E15-15 Performing horizontal analysis—income statement
Learning Objective 2
1. Net Income 35.7%
Data for McCormick Designs, Inc. follow:
Requirements
1. Prepare a horizontal analysis of the comparative income statement of McCormick Designs, Inc.
Round percentage changes to one decimal place.
2. Why did 2016 net income increase by a higher percentage than net sales revenue?
SOLUTION
Requirement 1
MCCORMICK DESIGNS, INC.
Comparative Income Statement
Years Ended December 31, 2016 and 2015
Requirement 2
Net income increased by a higher percentage than total net sales revenue during 2016 because revenues
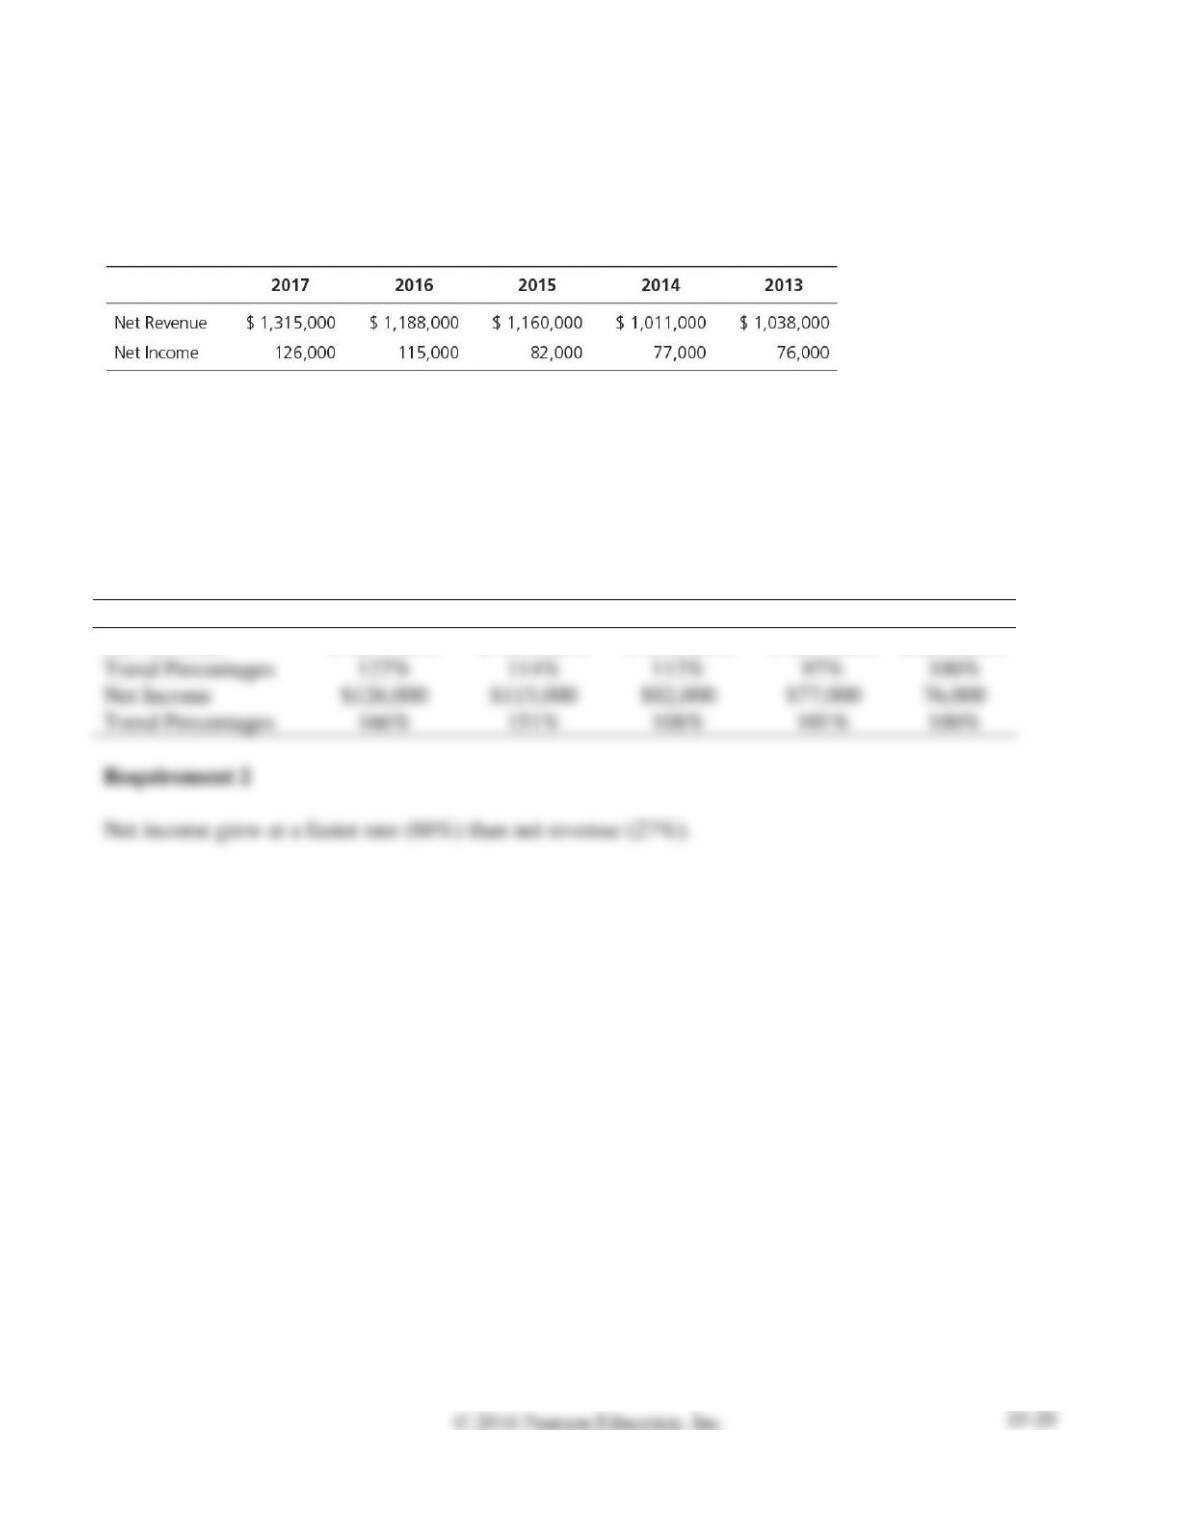
Learning Objective 2
1. 2017 Net Income 166%
Grand Oaks Realty’s net revenue and net income for the following five-year period,
using 2013 as the base year, follow:
Requirements
1. Compute a trend analysis for net revenue and net income. Round to the nearest full percent.
2. Which grew faster during the period, net revenue or net income?
SOLUTION
Requirement 1
2017
2016
2015
2014
2013
Net Revenue
$ 1,315,000
$ 1,188,000
$ 1,160,000
$ 1,011,000
$1,038,000
Trend Percentages
127%
Net Income
$82,000
Trend Percentages
166%