SOLUTION
Requirement 1
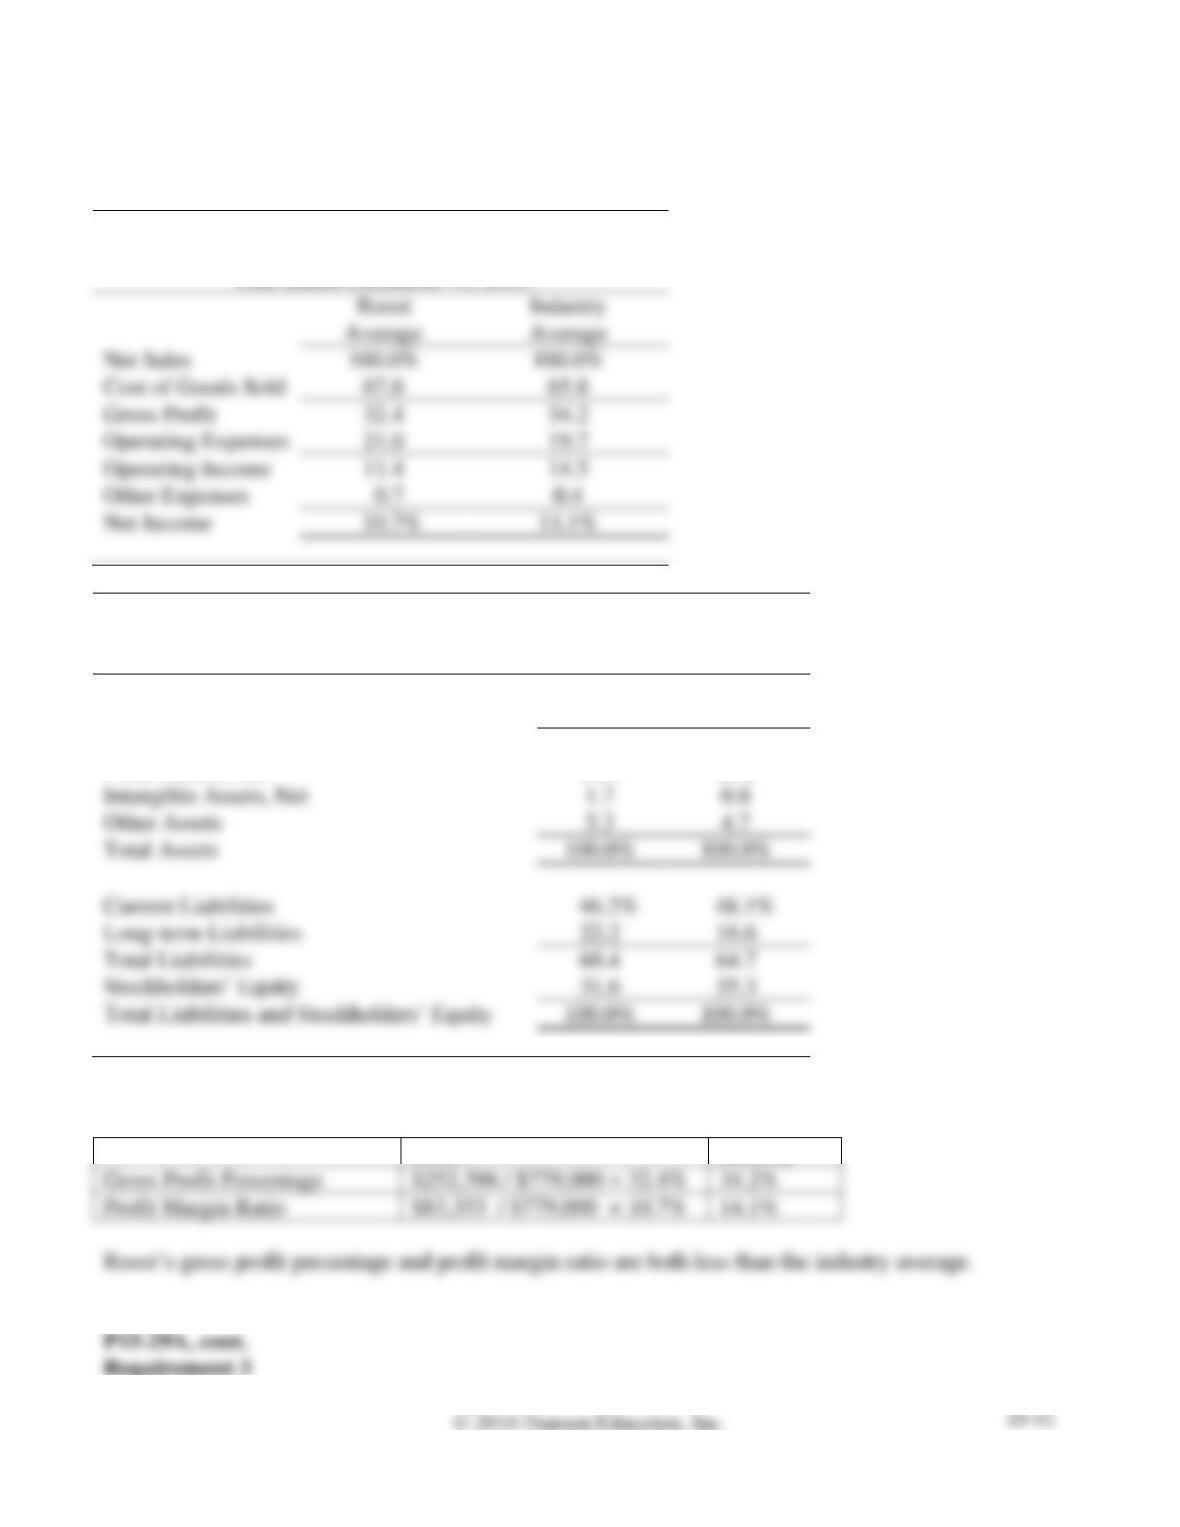
ROOST DEPARTMENT STORES, INC.
Common-Size Income Statement
Year Ended December 31, 2016
Net Sales
Cost of Goods Sold
Gross Profit
Operating Expenses
Operating Income
Other Expenses
Net Income
ROOST DEPARTMENT STORES, INC.
Common-Size Balance Sheet
December 31, 2016
Roost
Average
Industry
Average
Current Assets
67.4%
70.9%
Fixed Assets, Net
25.6
23.6
Other Assets
Total Assets
Current Liabilities
46.2%
48.1%
Long-term Liabilities
22.2
16.6
Total Liabilities
68.4
64.7
31.6
35.3
Requirement 2
Roost
Industry
Gross Profit Percentage
$252,396 / $779,000 = 32.4%
34.2%
Profit Margin Ratio
$83,353 / $779,000 = 10.7%
14.1%
P15-30A Determining the effects of business transactions on selected ratios
Learning Objective 4
1. Current Ratio 1.49
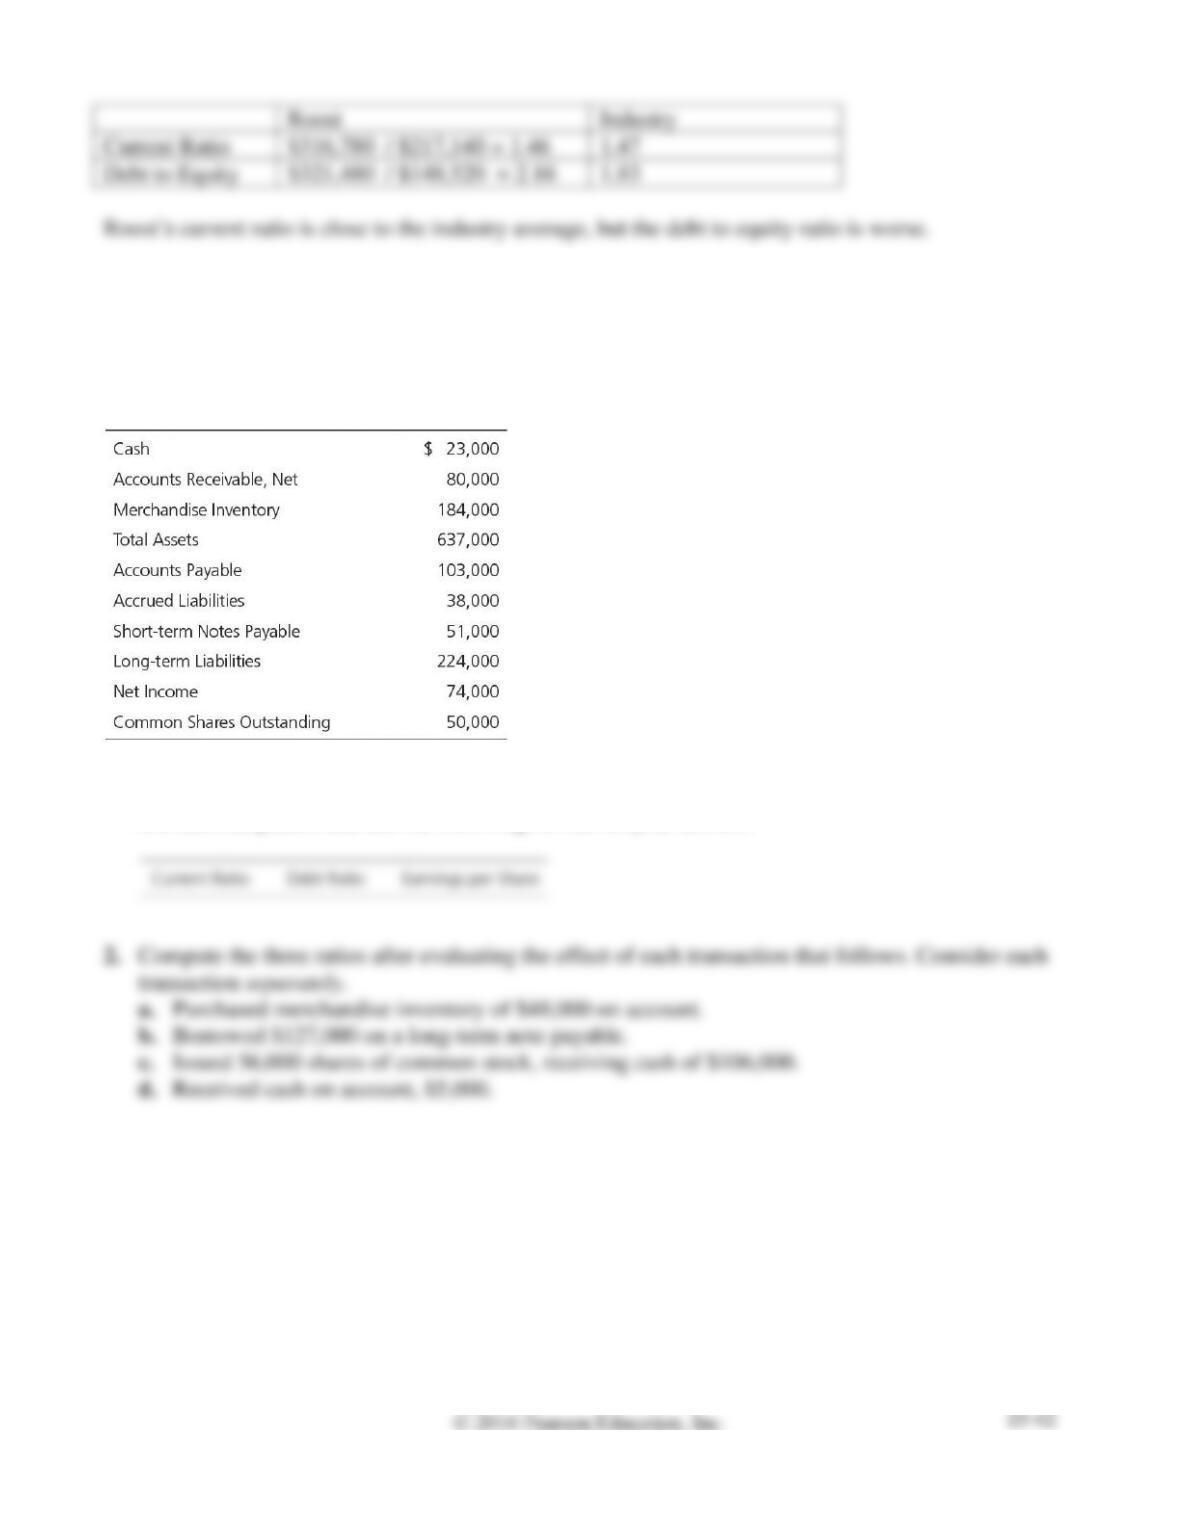
Financial statement data of Off Road Traveler Magazine include the following items:
Requirements
1. Compute Off Road Traveler’s current ratio, debt ratio, and earnings per share. Round all ratios to
two decimal places, and use the following format for your answer:
SOLUTION
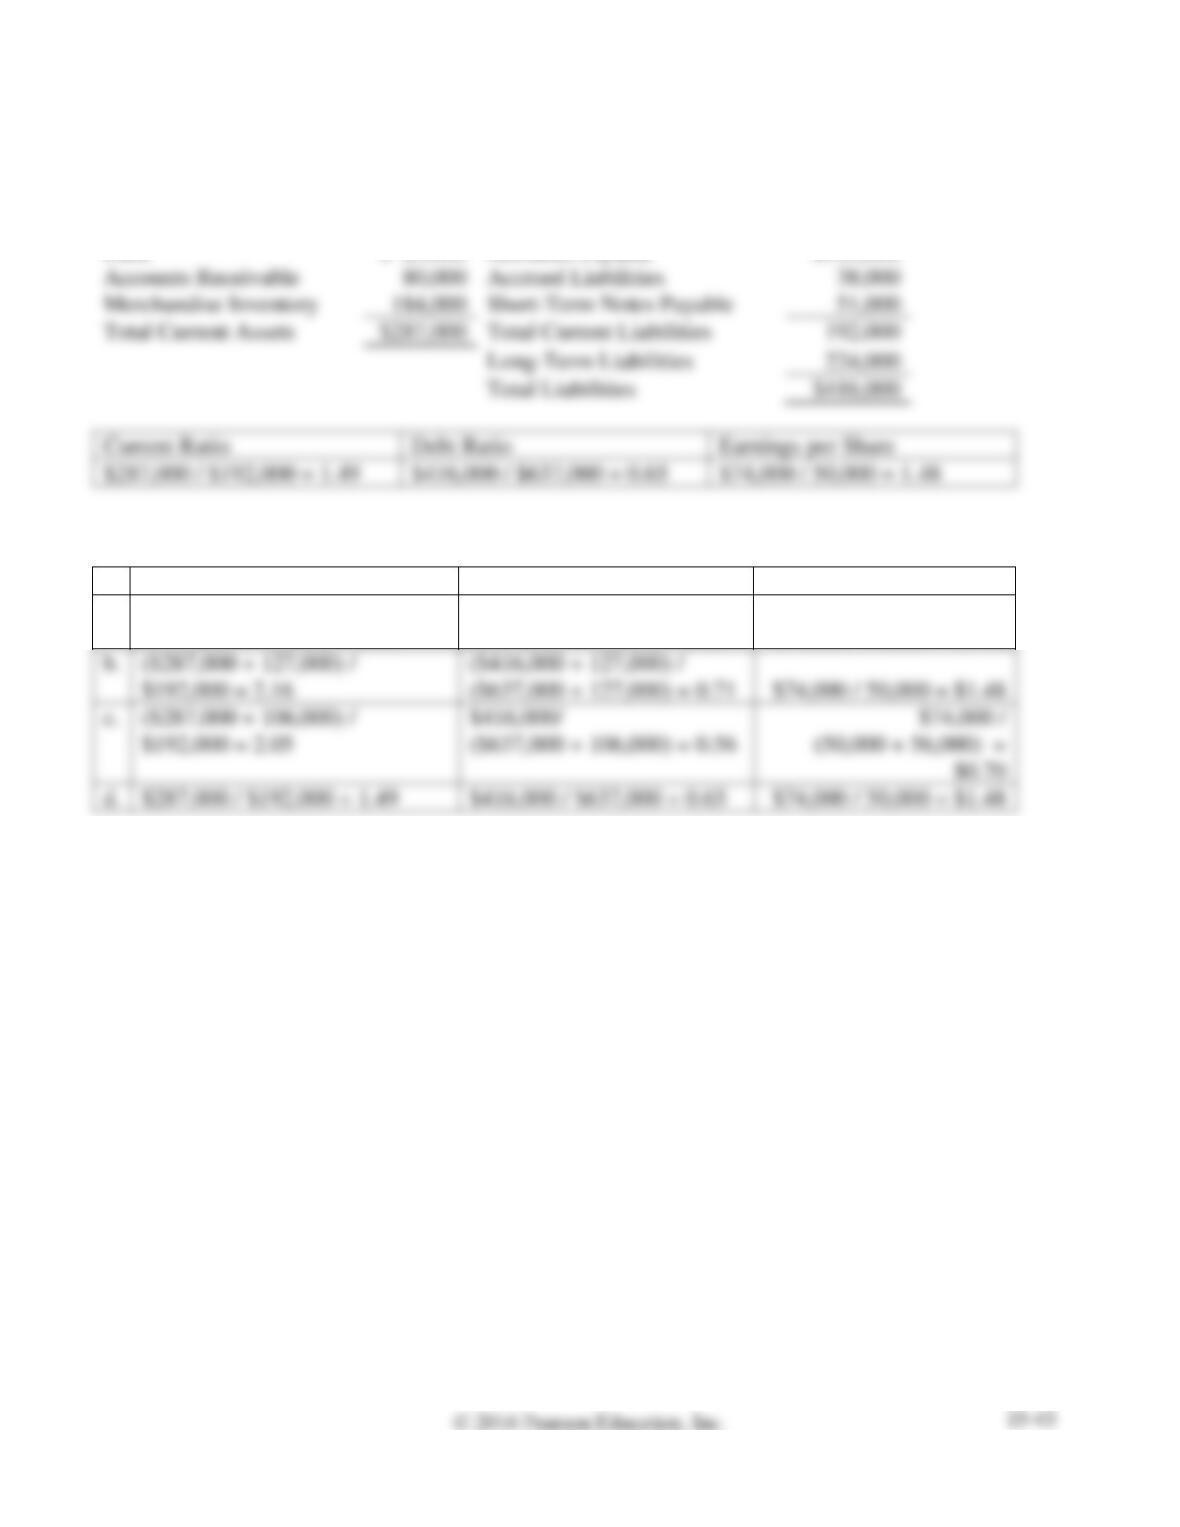
Requirement 1
Current Assets:
Current Liabilities:
Cash
$ 23,000
Accounts Payable
$103,000
Accounts Receivable
80,000
Accrued Liabilities
38,000
Merchandise Inventory
184,000
Short-Term Notes Payable
51,000
Total Current Assets
$287,000
Total Current Liabilities
Long-Term Liabilities
Total Liabilities
$416,000
Current Ratio
Debt Ratio
Earnings per Share
Requirement 2
Current Ratio
Debt Ratio
Earnings per Share
a.
($287,000 + 48,000) /
($192,000 + 48,000) = 1.40
($416,000 + 48,000) /
($637,000 + 48,000) = 0.68
$74,000 / 50,000 = $1.48
b.
($287,000 + 127,000) /
$192,000 = 2.16
($416,000 + 127,000) /
($637,000 + 127,000) = 0.71
$74,000 / 50,000 = $1.48
$192,000 = 2.05
($637,000 + 106,000) = 0.56
P15-31A Using ratios to evaluate a stock investment
Learning Objective 4
1. 2016 e. 49%
Comparative financial statement data of Dangerfield, Inc. follow:
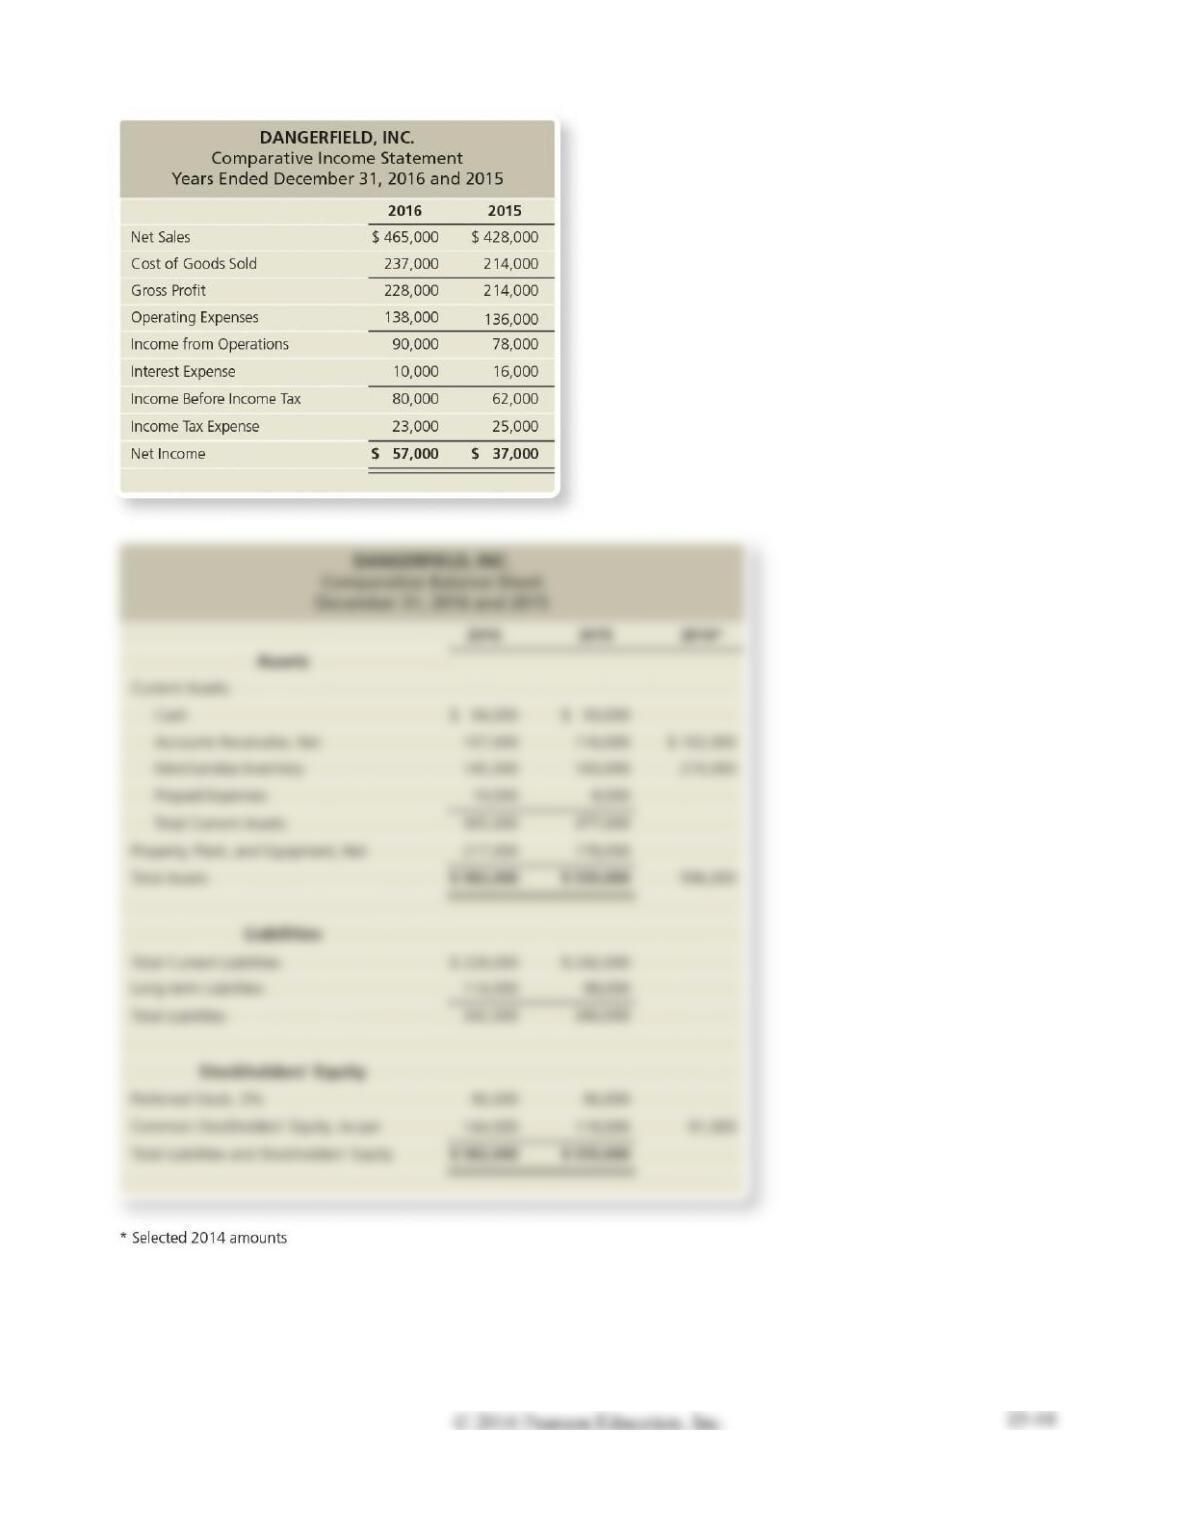
1. Market price of Dangerfield’s common stock: $76.67 at December 31, 2016, and $37.20 at
December 31, 2015.
2. Common shares outstanding: 13,000 during 2016 and 11,000 during 2015 and 2014.
3. All sales are on credit.

Requirements
1. Compute the following ratios for 2016 and 2015:
a. Current ratio
b. Cash ratio
c. Times-interest-earned ratio
d. Inventory turnover
e. Gross profit percentage
f. Debt to equity ratio
g. Rate of return on common stockholders’ equity
h. Earnings per share of common stock
i. Price/earnings ratio
2. Decide (a) whether Dangerfield’s ability to pay debts and to sell inventory improved or deteriorated
during 2016 and (b) whether the investment attractiveness of its common stock appears to have
increased or decreased.
SOLUTION
Requirement 1
2016
2015
a.
Total current assets
Total current liabilities
$365,000
$228,000
=
1.60
$377,000
$242,000
=
1.56
Total current liabilities
d.
Cost of Goods Sold
Average Merchandise
Inventory
$237,000
($145,000 +
160,000) / 2
=
1.55
$214,000
($160,000 +
210,000) / 2
=
1.16
e.
Gross Profit
Net Sales
$228,000
$465,000
=
49%
$214,000
$428,000
=
50%
f.
$240,000
$215,000
=
=
12.0
Total Liabilities
$342,000
=
1.43
$340,000
=
1.58
Earnings Per Share
Requirement 2
a. Dangerfield is in a better position to pay debt in 2016 than in 2015. The current ratio, cash ratio,
P15-32A Using ratios to decide between two stock investments
Learning Objective 4
1. Best Digital e. $4.67
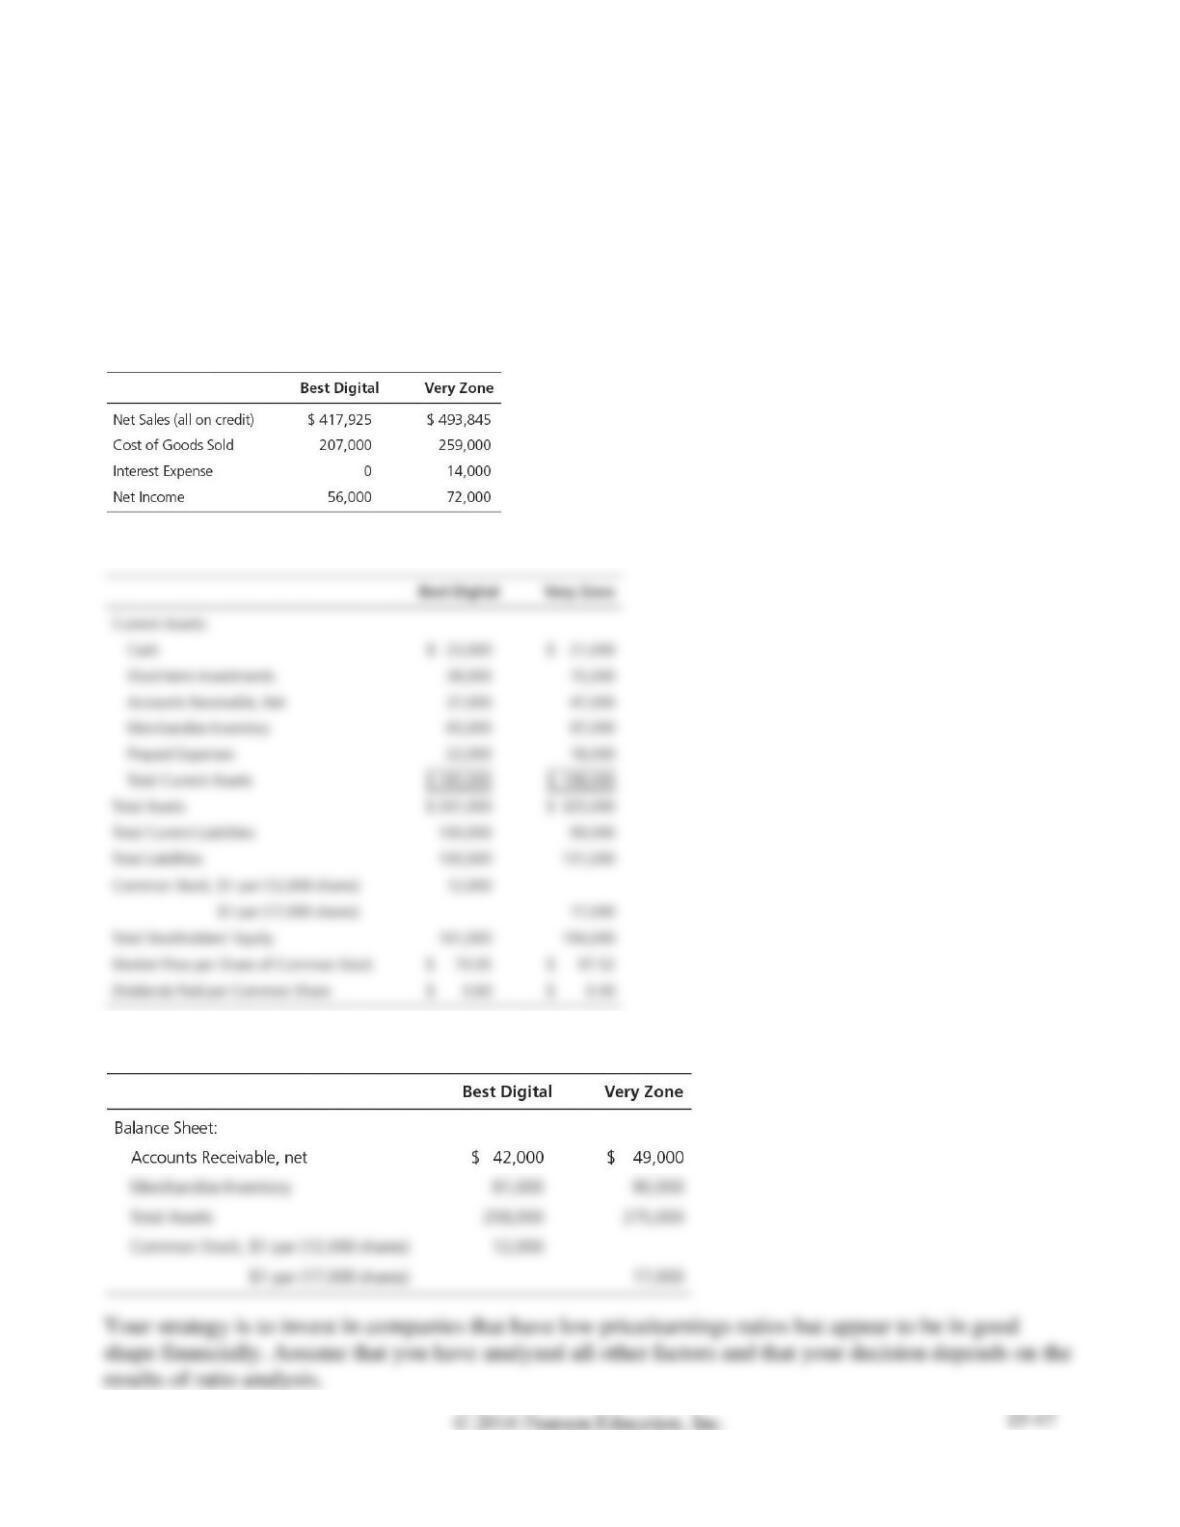
Assume that you are purchasing an investment and have decided to invest in a company in the digital
phone business. You have narrowed the choice to Best Digital Corp. and Very Zone, Inc. and have
assembled the following data.
Selected income statement data for the current year:
Selected balance sheet and market price data at the end of the current year:
Selected balance sheet data at the beginning of the current year:
Requirements
1. Compute the following ratios for both companies for the current year:
a. Acid-test ratio
2. Decide which company’s stock better fits your investment strategy.
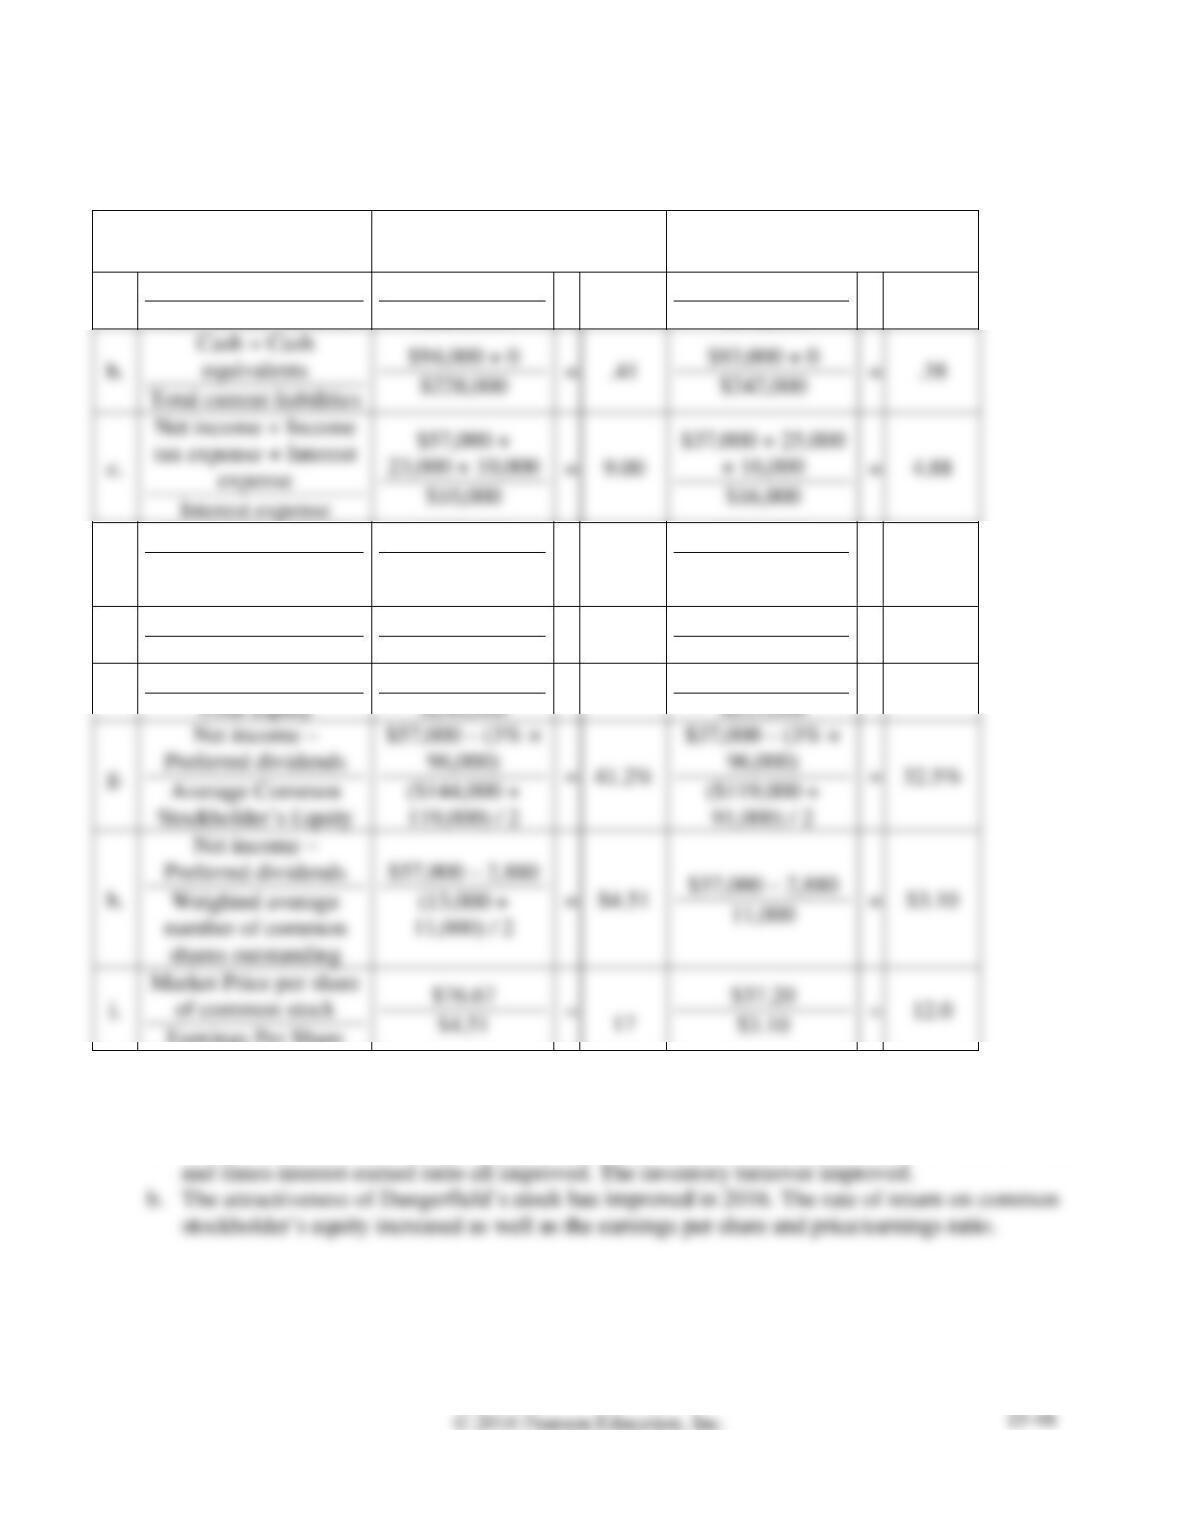
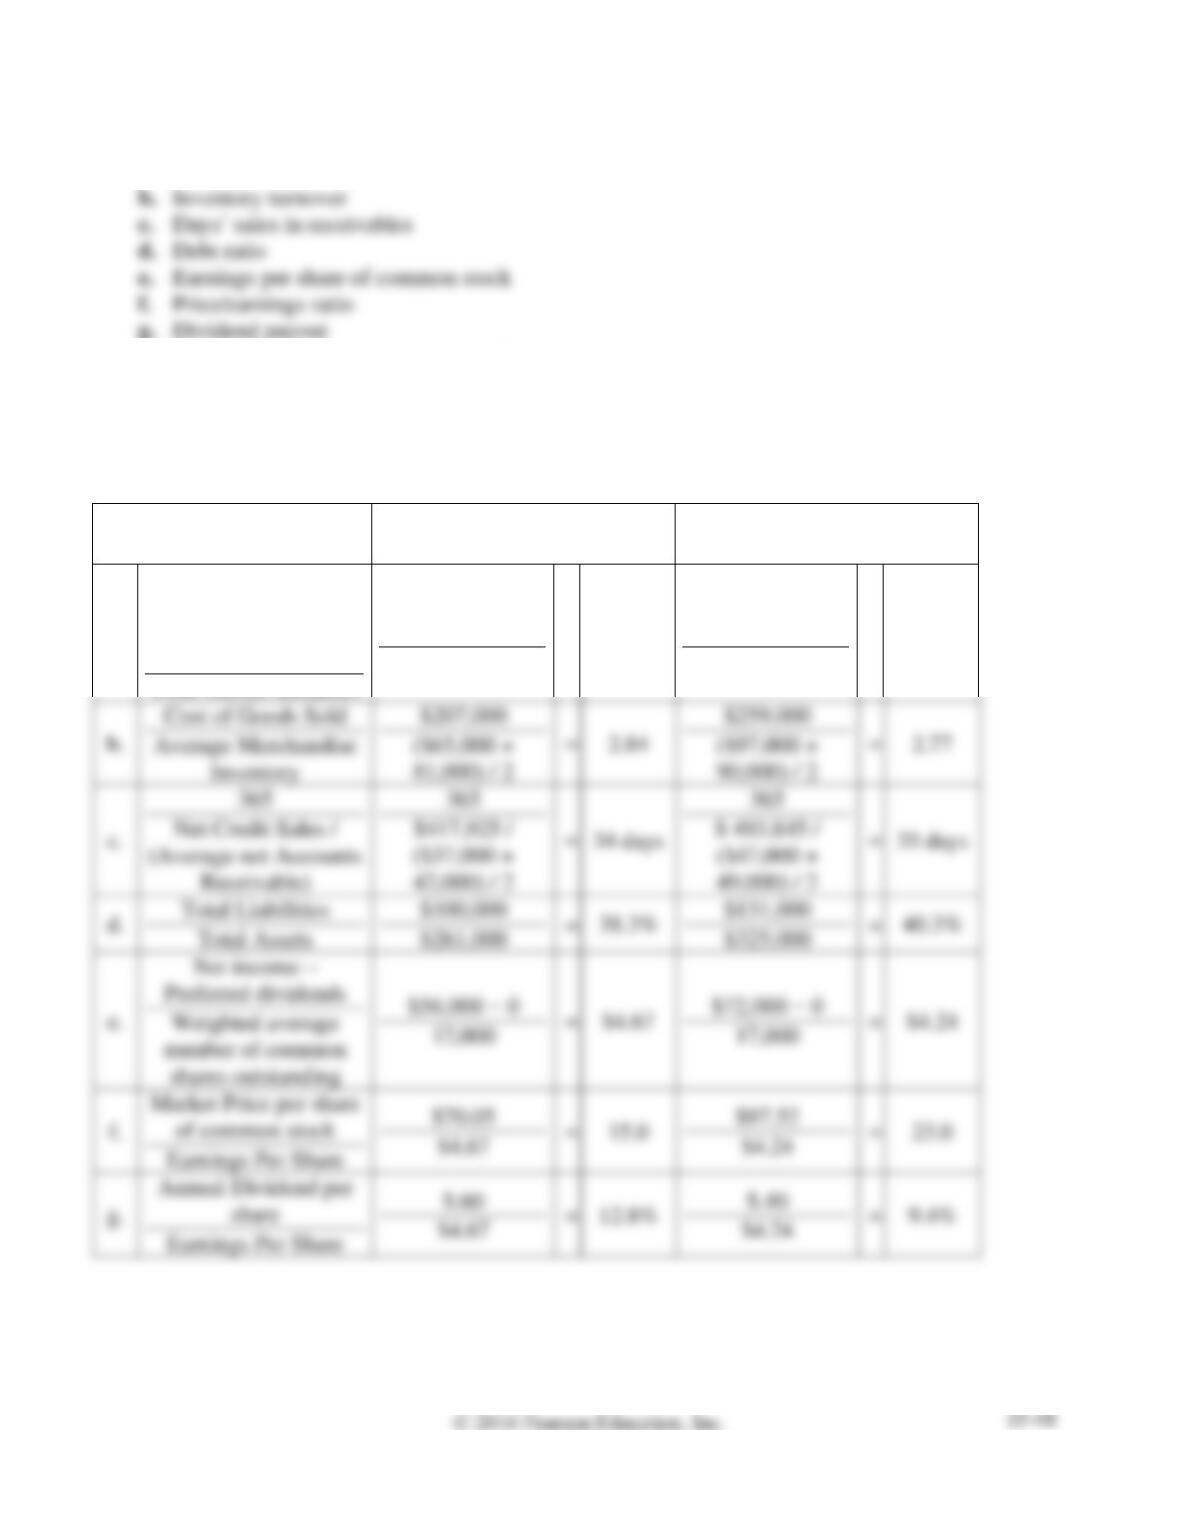
SOLUTION
Requirement 1
Best Digital, Corp.
Very Zone, Inc.
a.
Cash + Cash
equivalents + Short-
term Investments +
Accounts Receivable
Total current liabilities
($23,000 + 0 +
38,000 + 37,000)
$100,000
=
.98
($21,000 + 0 +
15,000 + 47,000)
$99,000
=
.84
e.
=
=
P15-32A, Cont.
Requirement 2
Best Digital’s would be the better investment based on the strategy of a low price earnings ratio, with
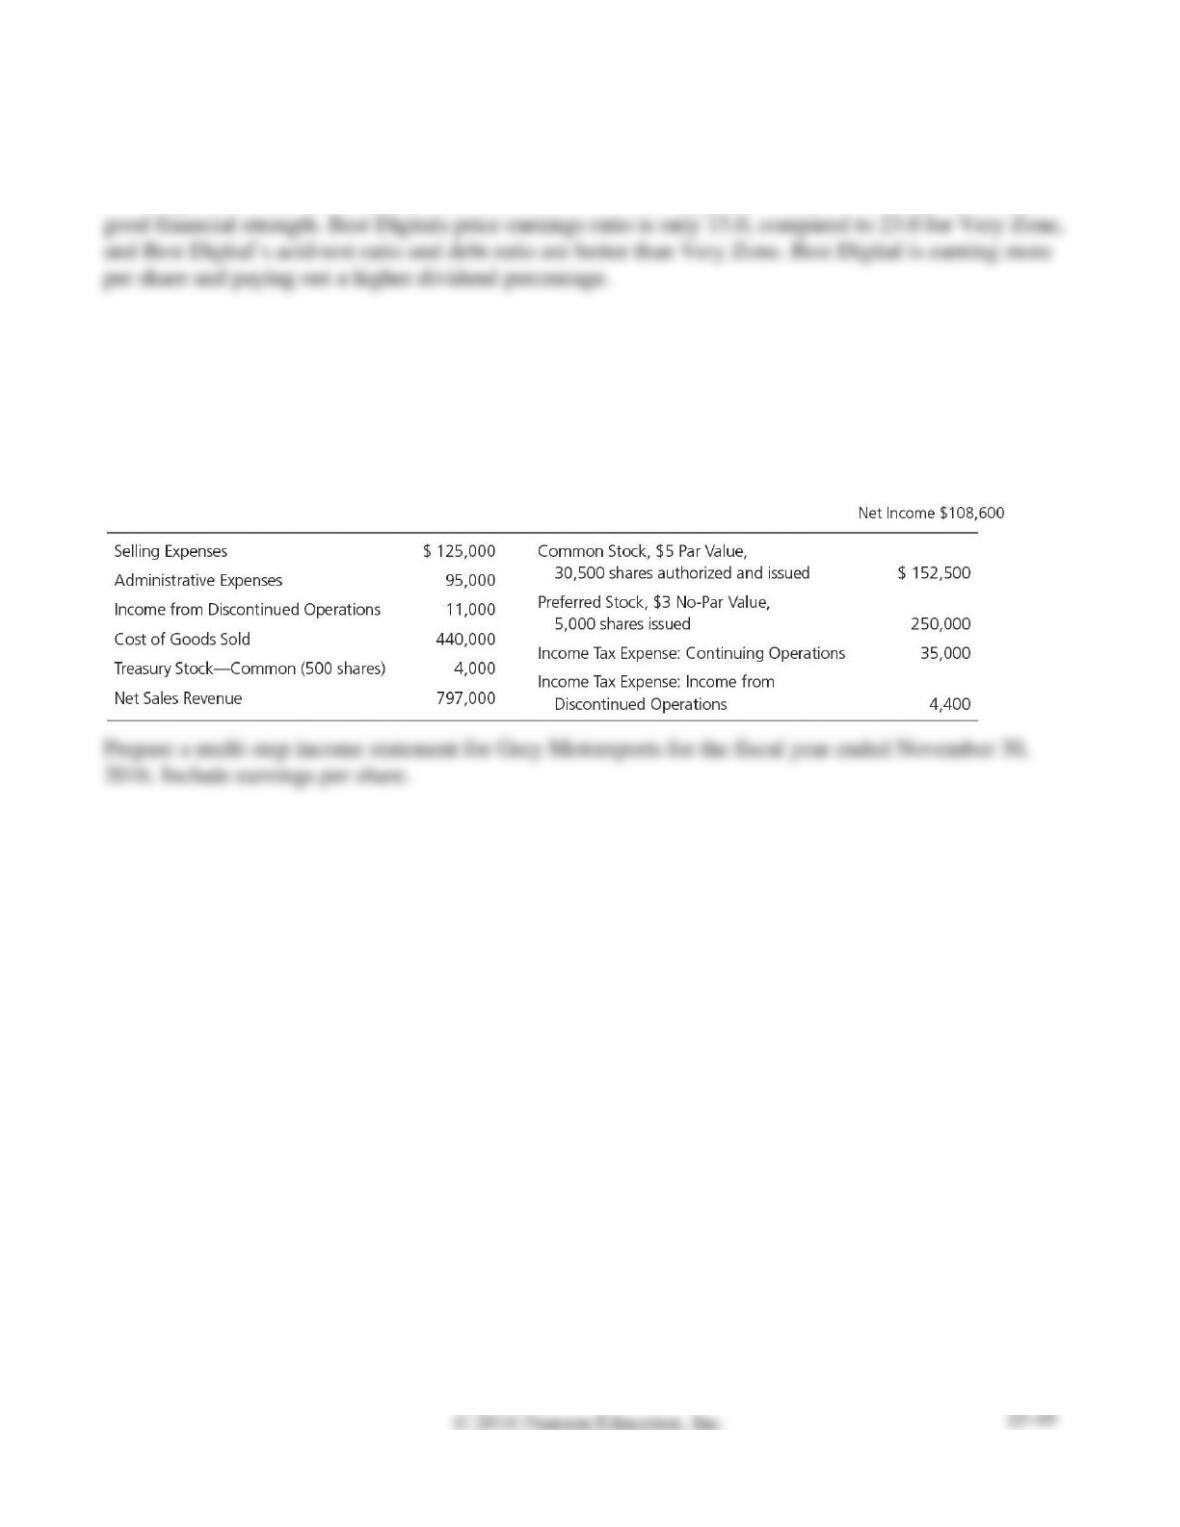
P15A-33A Preparing an income statement
Learning Objective 5
Appendix 15A
Net Income $108,600
The following information was taken from the records of Grey Motorsports, Inc. at November 30, 2016:
SOLUTION
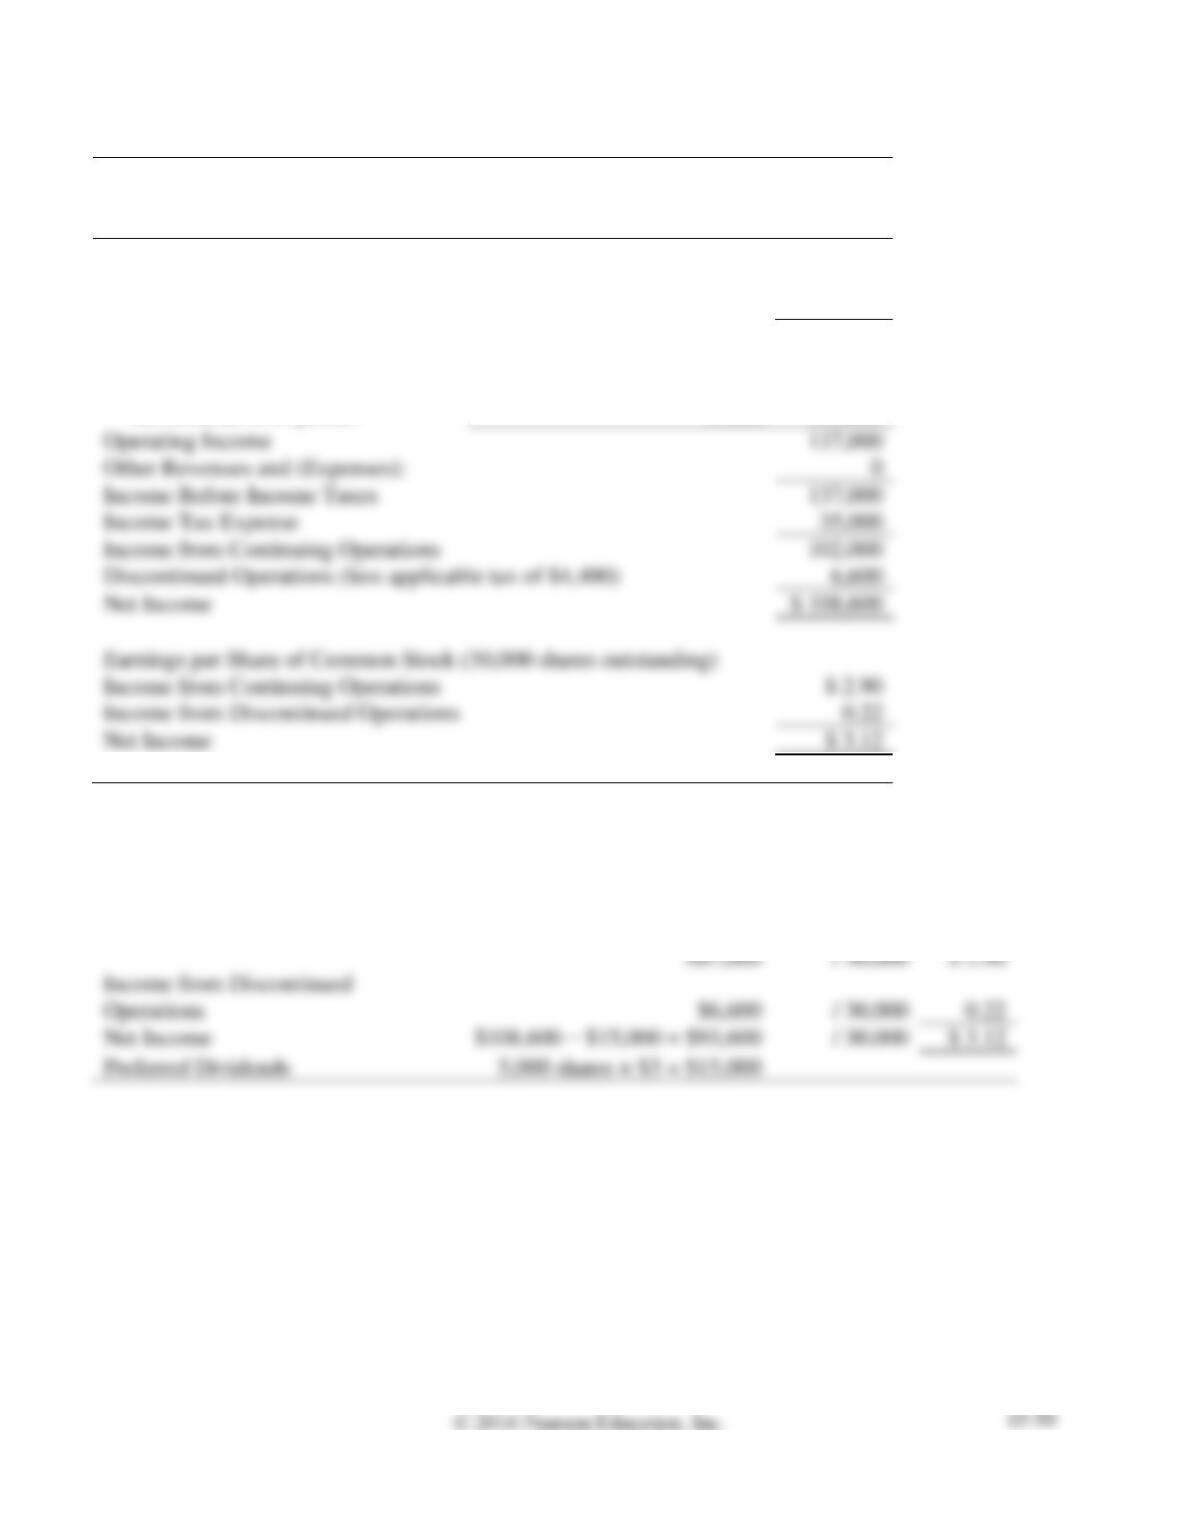
GREY MOTORSPORTS, INC.
Income Statement
Year Ended November 30, 2016
Net Sales Revenue
$ 797,000
Cost of Goods Sold
440,000
Gross Profit
357,000
Operating Expenses:
Selling Expenses
$125,000
Administrative Expenses
95,000
220,000
Operating Income
137,000
Other Revenues and (Expenses):
Income Before Income Taxes
137,000
Income Tax Expense
Income from Continuing Operations
102,000
Discontinued Operations (less applicable tax of $4,400)
Net Income
$ 108,600
Earnings per Share of Common Stock (30,000 shares outstanding)
Income from Continuing Operations
Income from Discontinued Operations
Net Income
Common
Shares
Outstanding
Earnings per Share of Common Stock
Income from Continuing Operations
Income from Discontinued
Operations
Net Income
Preferred Dividends
$102,000 − $15,000 =
Problems (Group B)
P15-34B Computing trend analysis and return on common equity
Learning Objectives 2, 4
2. 2016 10.2%
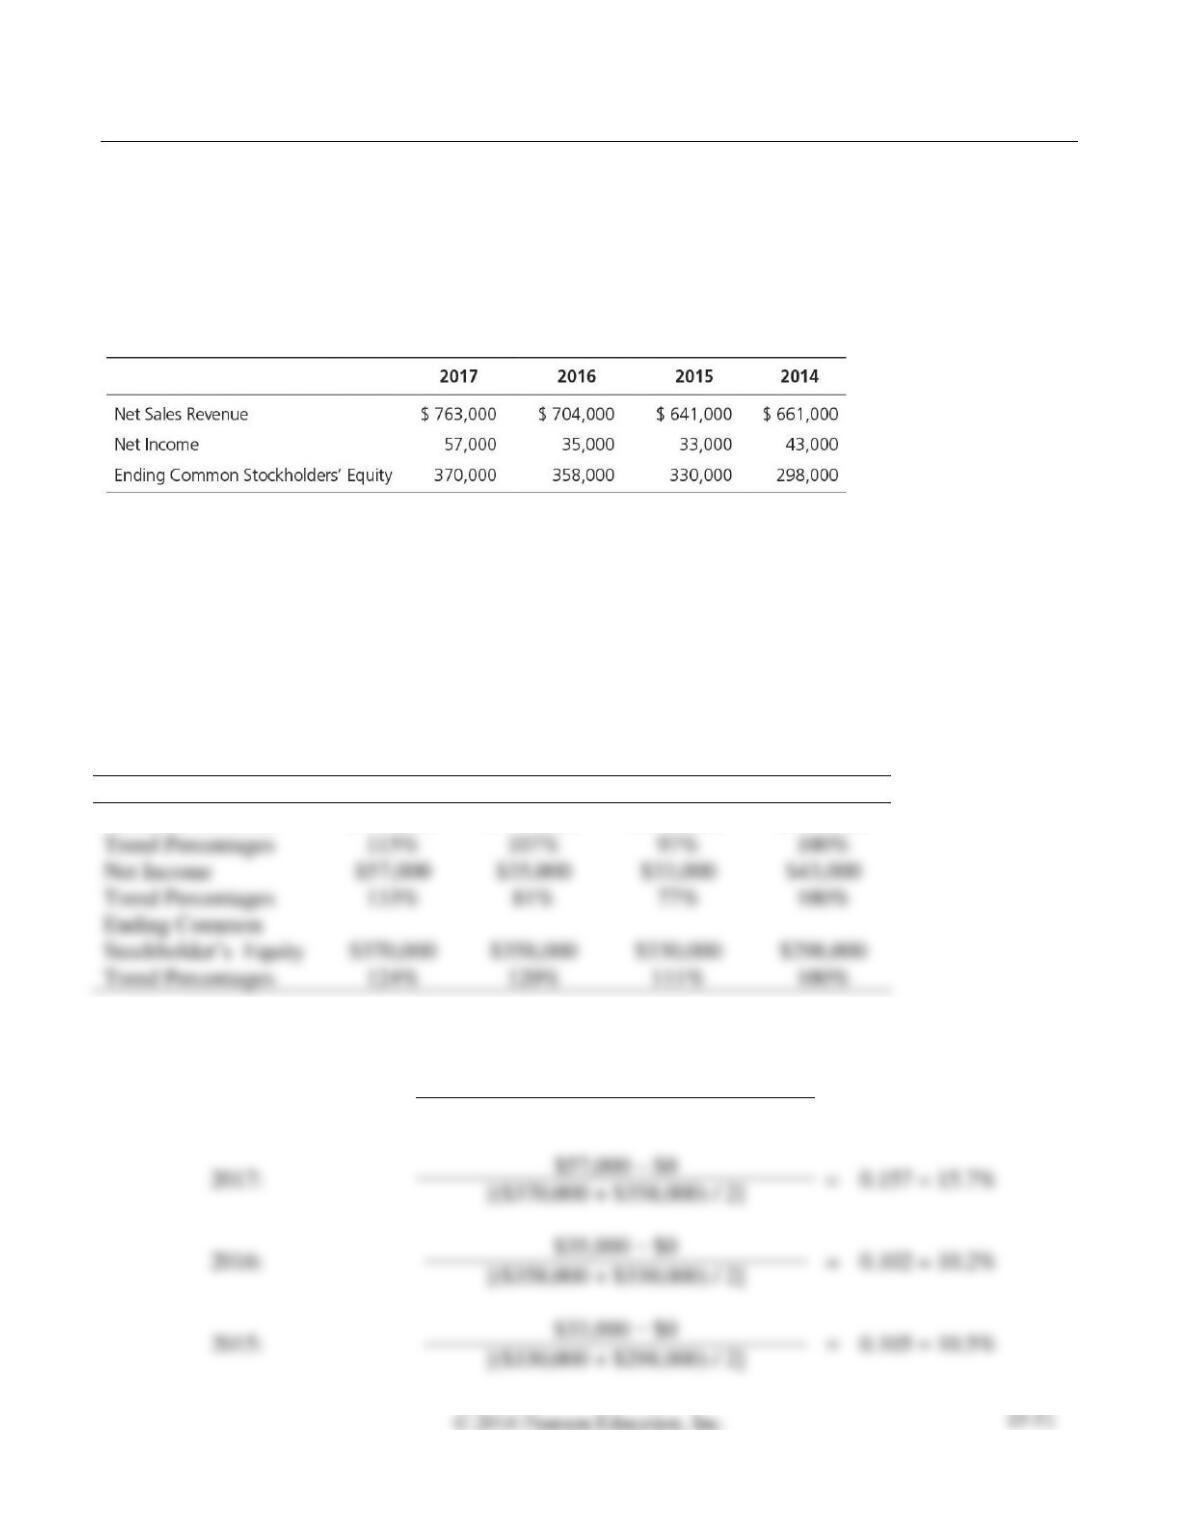
Net sales revenue, net income, and common stockholders’ equity for Atkinson Mission Corporation, a
manufacturer of contact lenses, follow for a four-year period.
Requirements
1. Compute trend analyses for each item for 2015–2017. Use 2014 as the base year, and round to the
nearest whole percent.
2. Compute the rate of return on common stockholders’ equity for 2015–2017, rounding to three
decimal places.
SOLUTION
Requirement 1
2017
2016
2015
2014
Net Sales Revenue
$ 763,000
$ 704,000
$ 641,000
$ 661,000
Trend Percentages
115%
Net Income
$35,000
$43,000
Trend Percentages
133%
$358,000
$298,000
Trend Percentages
124%
Requirement 2
Rate of return on common
stockholders’ equity
=
Net income – Preferred dividends
Average common stockholders’ equity
=
0.157 = 15.7%
P15-35B Performing vertical analysis
Learning Objective 2
1. Net Income 10.9%
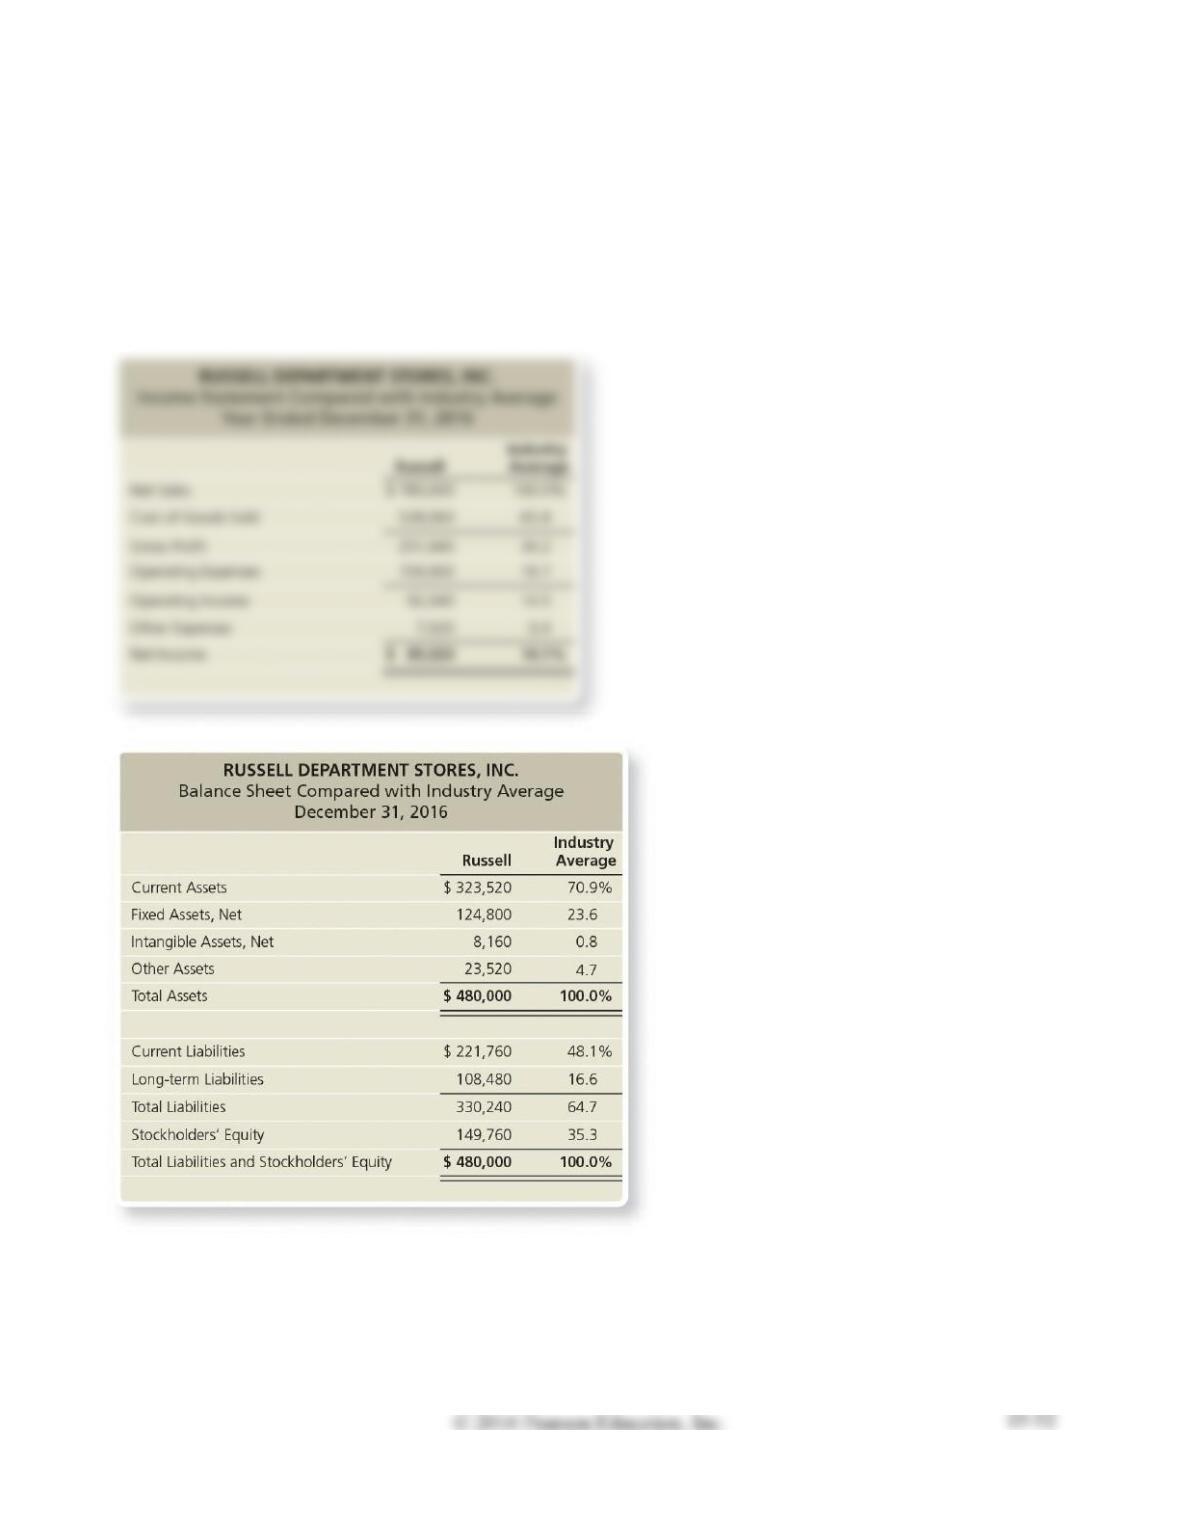
The Russell Department Stores, Inc. chief executive officer (CEO) has asked you to compare the
company’s profit performance and financial position with the averages for the industry. The CEO has
given you the company’s income statement and balance sheet as well as the industry average data for
retailers.
Requirements
1. Prepare a vertical analysis for Russell for both its income statement and balance sheet.
2. Compare the company’s profit performance and financial position with the average for the industry.
SOLUTION
Requirement 1
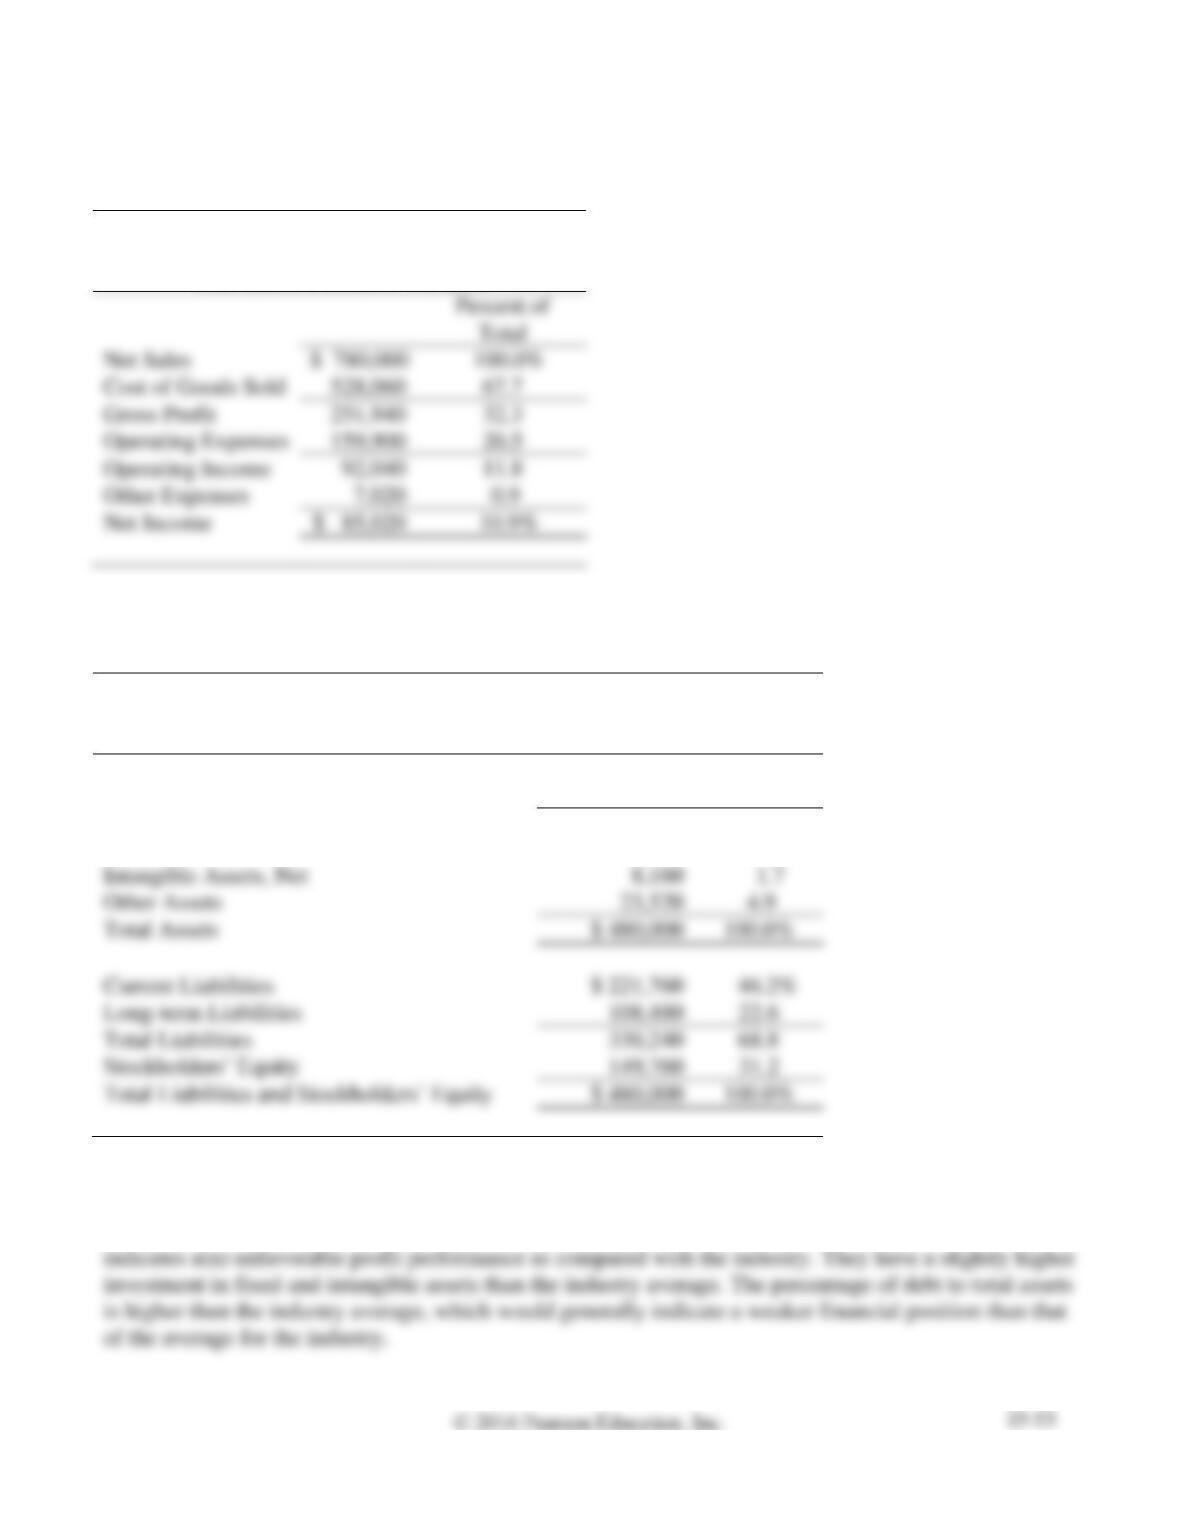
RUSSELL DEPARTMENT STORES, INC.
Income Statement
Year Ended December 31, 2016
Net Sales
$ 780,000
Cost of Goods Sold
Gross Profit
Operating Expenses
Operating Income
Other Expenses
Net Income
P15-35B
Requirement 1, cont.
RUSSELL DEPARTMENT STORES, INC.
Balance Sheet
December 31, 2016
Percent of
Total
Current Assets
$ 323,520
67.4%
Fixed Assets, Net
124,800
26.0
Intangible Assets, Net
Other Assets
23,520
Total Assets
$ 480,000
Current Liabilities
$ 221,760
46.2%
Long-term Liabilities
22.6
Total Liabilities
330,240
68.8
31.2
$ 480,000
Requirement 2
Russell’s gross profit percentage and profit margin ratio are both less than the industry average, which
Note: Problem P15-35B must be completed before attempting Problem P15-36B.
P15-36B Preparing common-size statements, analysis of profitability and financial position,
comparison with the industry, and using ratios to evaluate a company
Learning Objectives 3, 4
1. Current Assets 67.4%
Consider the data for Russell Department Stores presented in Problem P15-35B.
Requirements
1. Prepare a common-size income statement and balance sheet for Russell. The first column of each
statement should present Russell’s common-size statement, and the second column, the industry
averages.
2. For the profitability analysis, compute Russell’s (a) gross profit percentage and (b) profit margin
ratio. Compare these figures with the industry averages. Is Russell’s profit performance better or
worse than the industry average?
3. For the analysis of financial position, compute Russell’s (a) current ratio and (b) debt to equity ratio.
Compare these ratios with the industry averages. Assume the current ratio industry average is 1.47,
and the debt to equity industry average is 1.83. Is Russell’s financial position better or worse than
the industry averages?
SOLUTION
Requirement 1
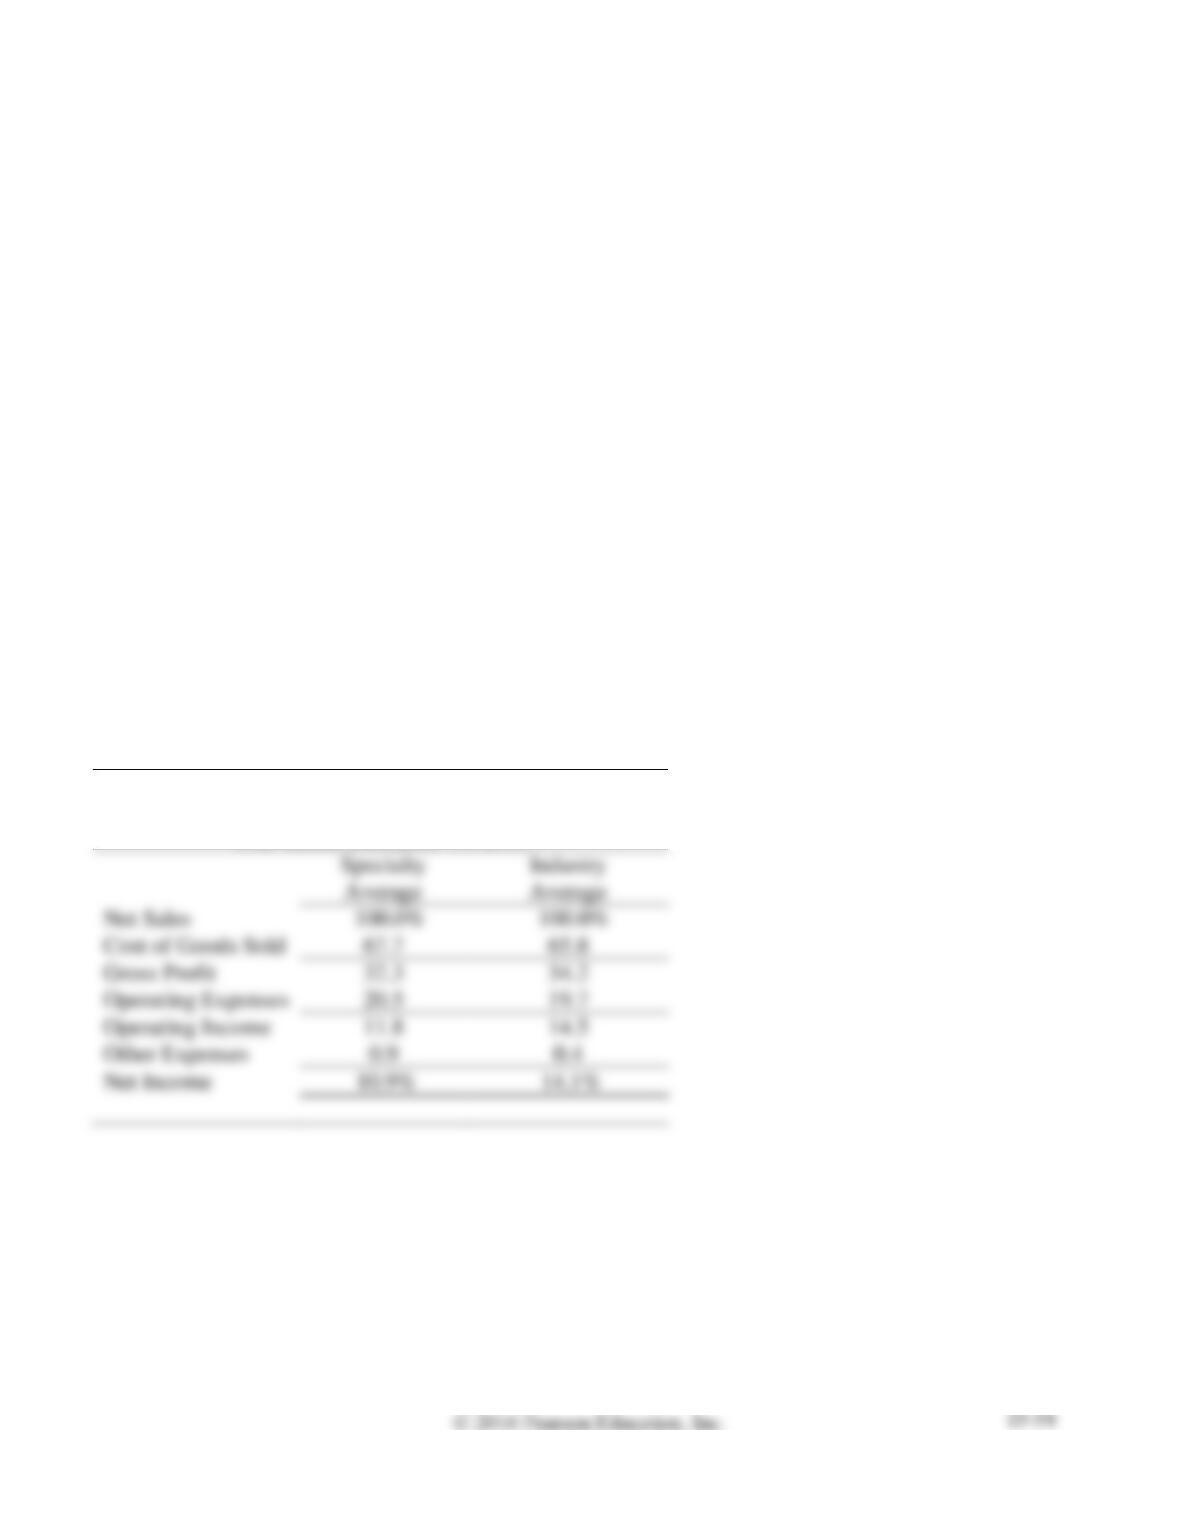
RUSSELL DEPARTMENT STORES, INC.
Common-Size Income Statement
Year Ended December 31, 2016
P15-36B
Requirement 1, cont.
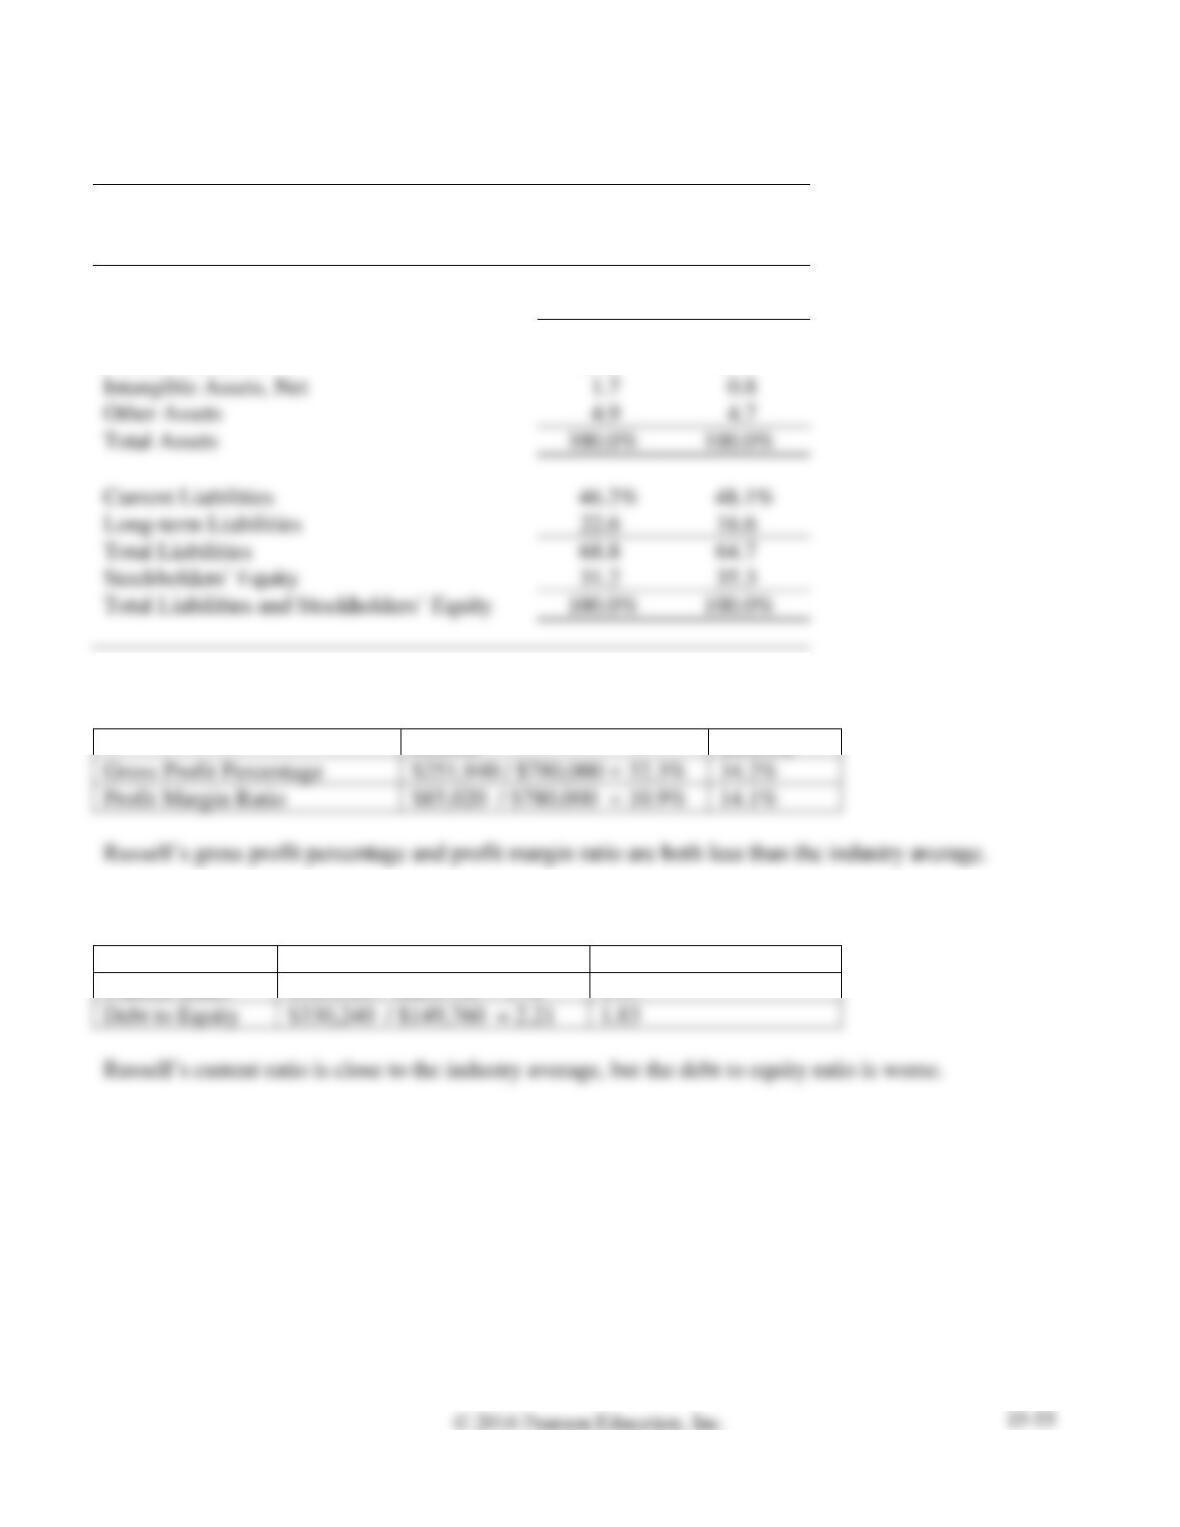
RUSSELL DEPARTMENT STORES, INC.
Common-Size Balance Sheet
December 31, 2016
Russell
Average
Industry
Average
Current Assets
67.4%
70.9%
Fixed Assets, Net
26.0
23.6
Intangible Assets, Net
1.7
0.8
Other Assets
4.9
4.7
Total Assets
100.0%
100.0%
Current Liabilities
46.2%
48.1%
Long-term Liabilities
22.6
16.6
Total Liabilities
68.8
64.7
31.2
35.3
100.0%
100.0%
Requirement 2
Russell
Industry
Gross Profit Percentage
$251,940 / $780,000 = 32.3%
34.2%
Requirement 3
Russell
Industry
Current Ratio
$323,520 / $221,760 = 1.46
1.47
Debt to Equity
$330,240 / $149,760 = 2.21
1.83
P15-37B Determining the effects of business transactions on selected ratios
Learning Objective 4
1. Earnings per Share $1.83
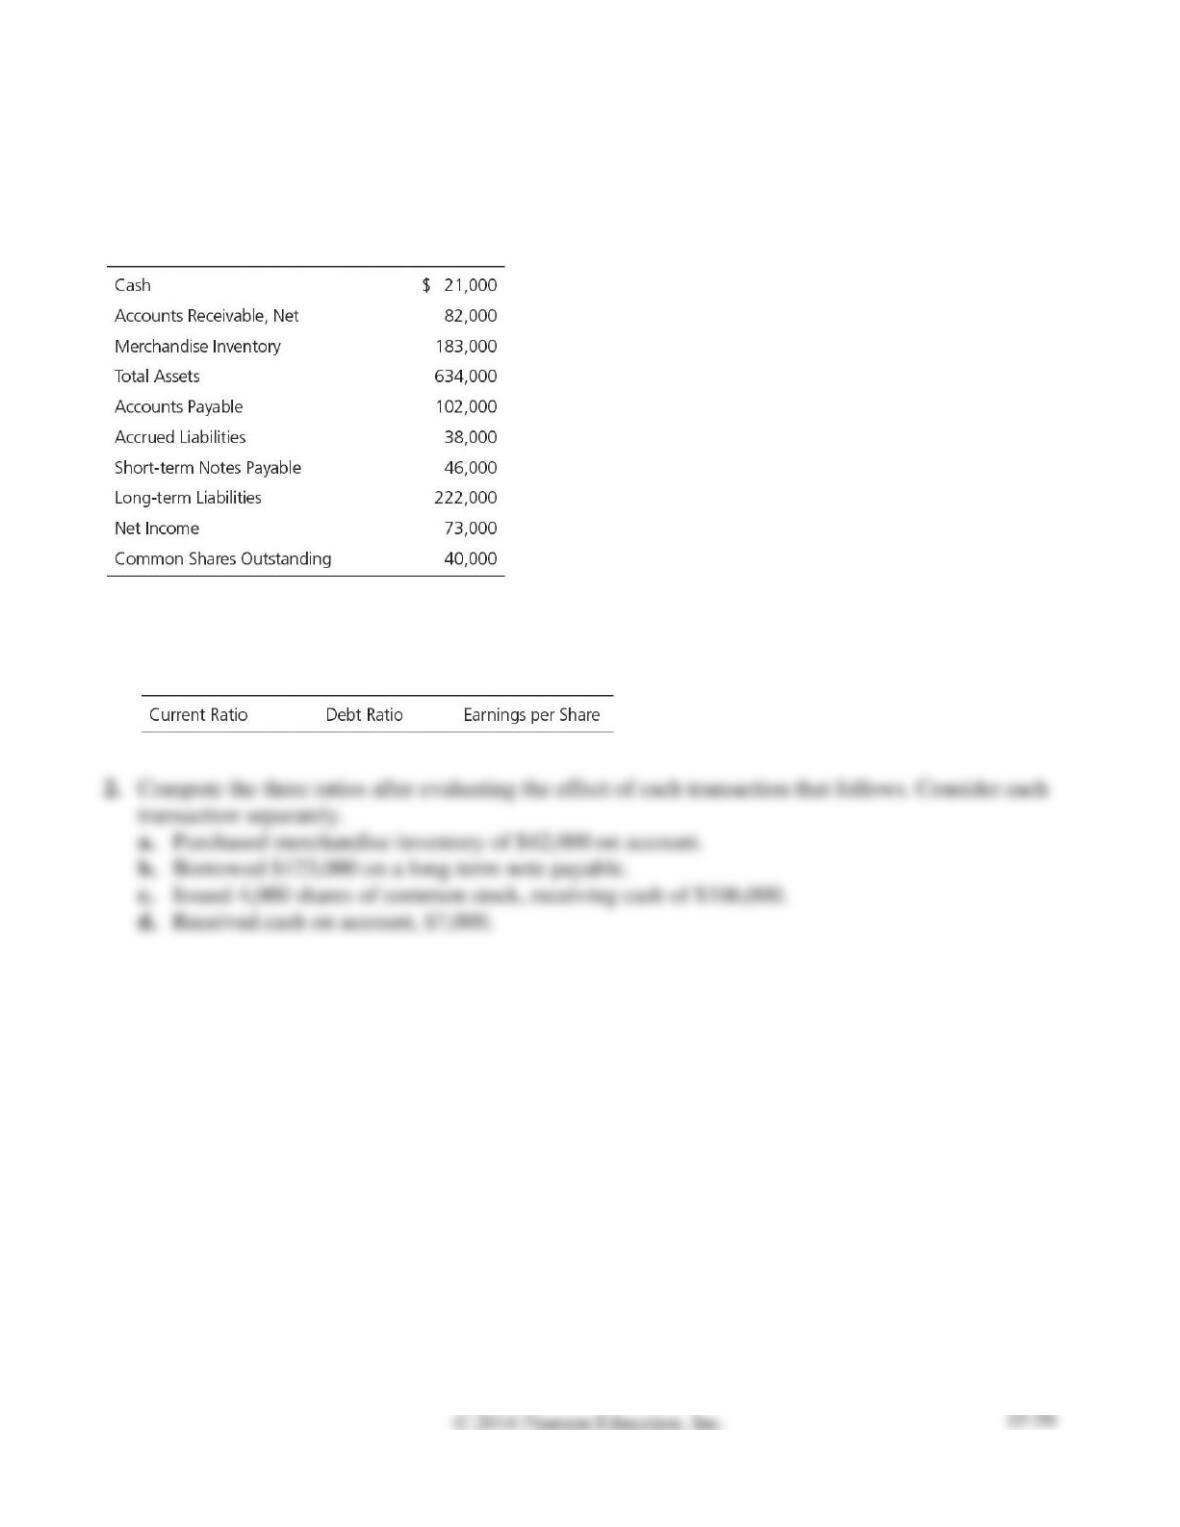
Financial statement data of Yankee Traveler’s Magazine include the following items:
Requirements
1. Compute Yankee Traveler’s current ratio, debt ratio, and earnings per share. Round all ratios to two
decimal places, and use the following format for your answer:
SOLUTION
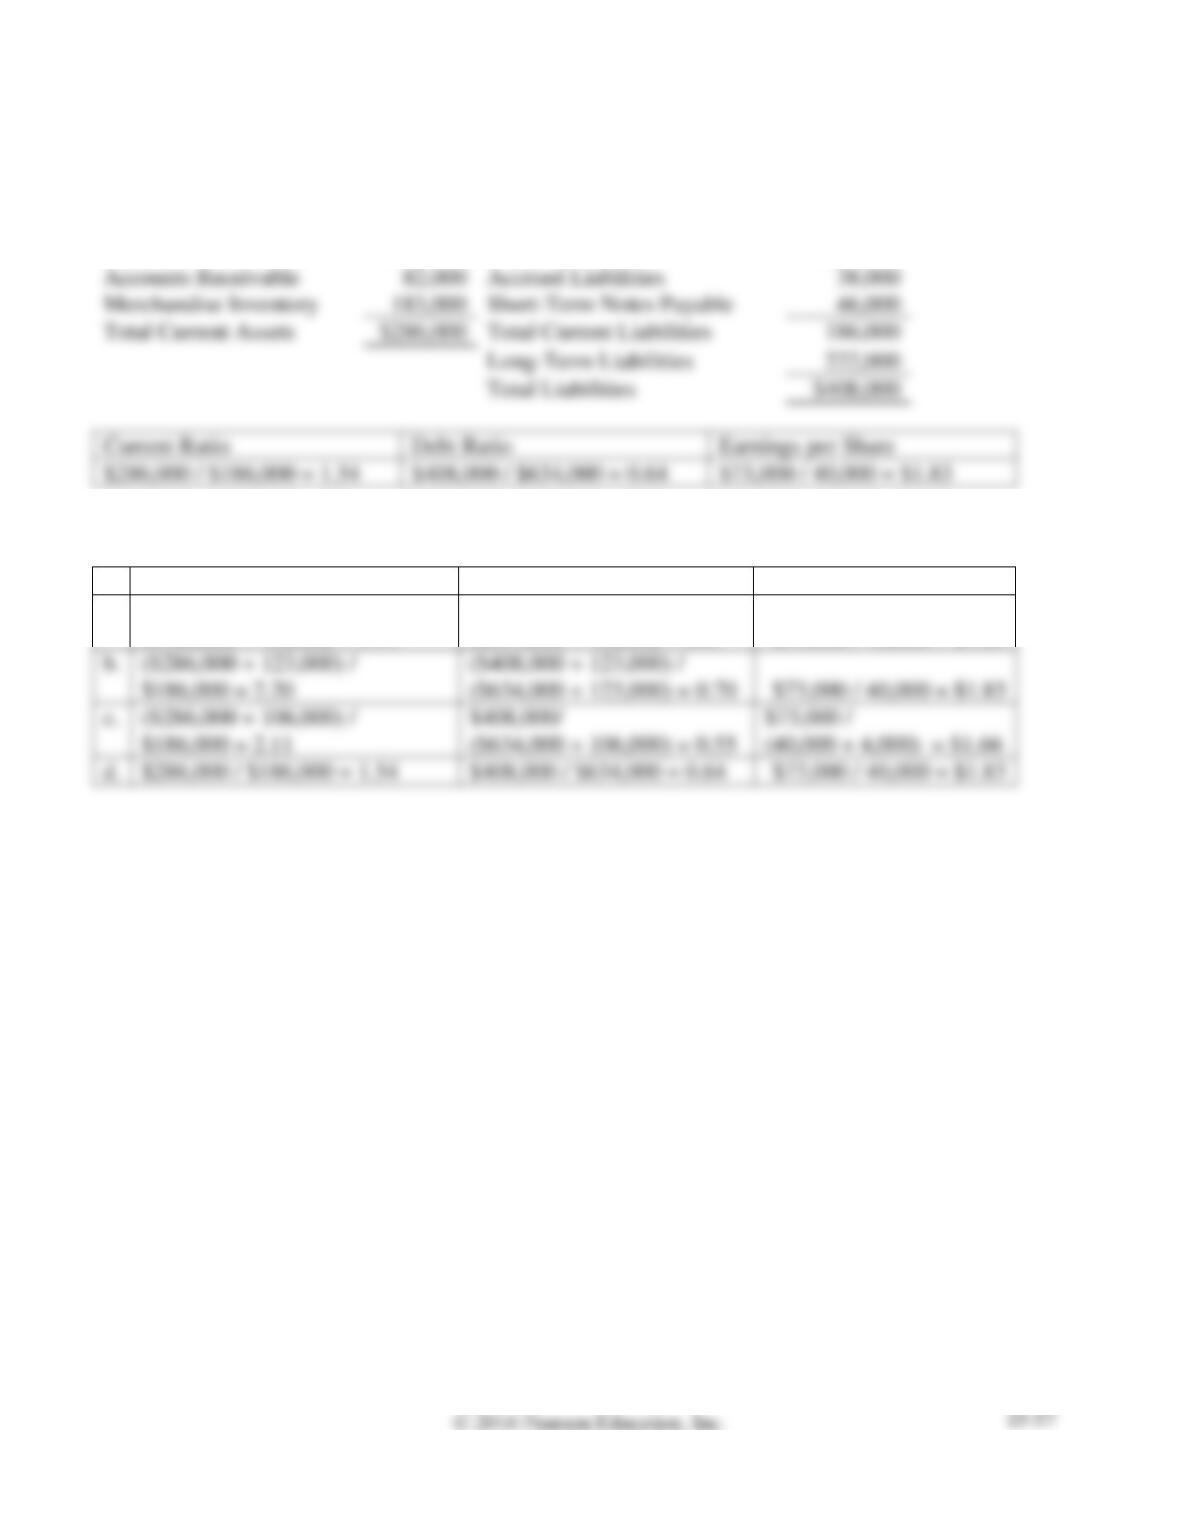
Requirement 1
Current Assets:
Current Liabilities:
Cash
$ 21,000
Accounts Payable
$102,000
Accounts Receivable
82,000
Accrued Liabilities
38,000
Merchandise Inventory
183,000
Short-Term Notes Payable
46,000
Total Current Assets
$286,000
Total Current Liabilities
Long-Term Liabilities
Total Liabilities
$408,000
Current Ratio
Debt Ratio
Earnings per Share
Requirement 2
Current Ratio
Debt Ratio
Earnings per Share
a.
($286,000 + 42,000) /
($186,000 + 42,000) = 1.44
($408,000 + 42,000) /
($634,000 + 42,000) = 0.67
$73,000 / 40,000 = $1.83
b.
($286,000 + 123,000) /
$186,000 = 2.20
($408,000 + 123,000) /
($634,000 + 123,000) = 0.70
$73,000 / 40,000 = $1.83
c.
($286,000 + 106,000) /
$186,000 = 2.11
$408,000/
($634,000 + 106,000) = 0.55
$73,000 /
d.
$286,000 / $186,000 = 1.54
$408,000 / $634,000 = 0.64
$73,000 / 40,000 = $1.83
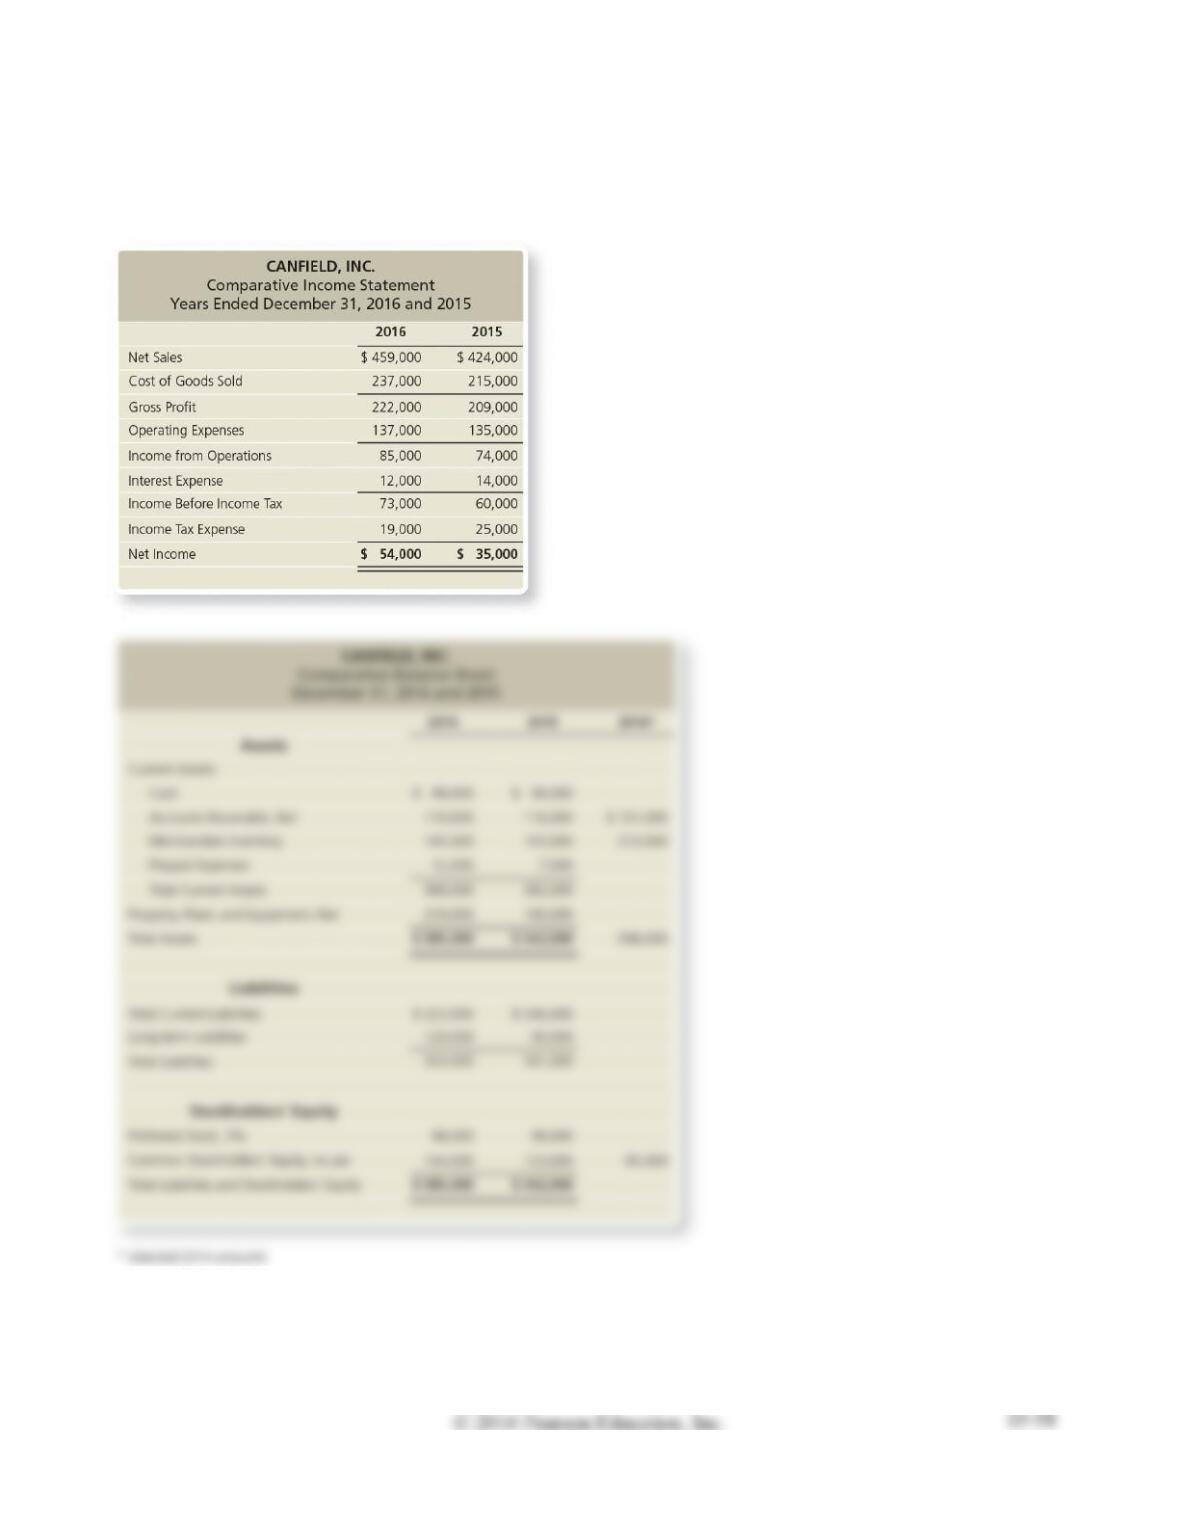
P15-38B Using ratios to evaluate a stock investment
Learning Objective 4
1. 2015 d. 1.15
Comparative financial statement data of Canfield, Inc. follow:
1. Market price of Canfield’s common stock: $84.32 at December 31, 2016, and $51.75 at December
31, 2015.
2. Common shares outstanding: 10,000 during 2016 and 9,000 during 2015 and 2014.
3. All sales are on credit.