E15-17 Performing vertical analysis of a balance sheet
Learning Objective 3
2016 Current Assets: 15.7%
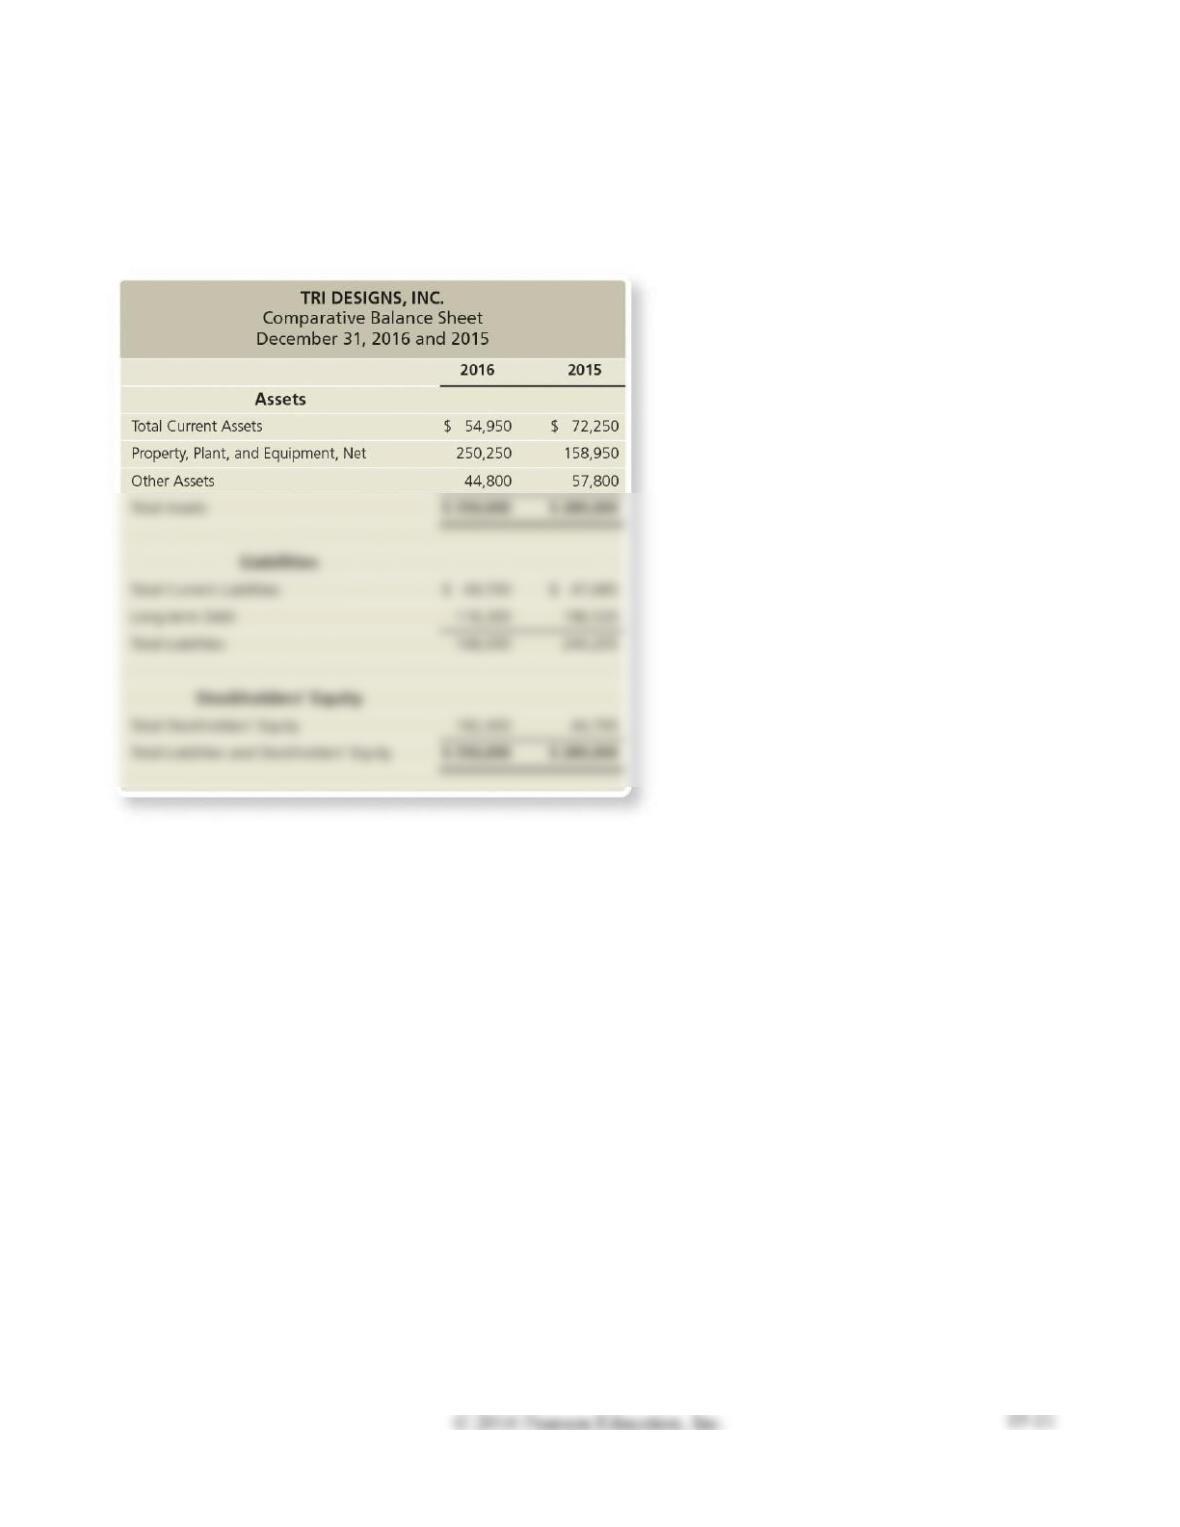
Tri Designs, Inc. has the following data:
Perform a vertical analysis of Tri Designs’s balance sheet for each year.
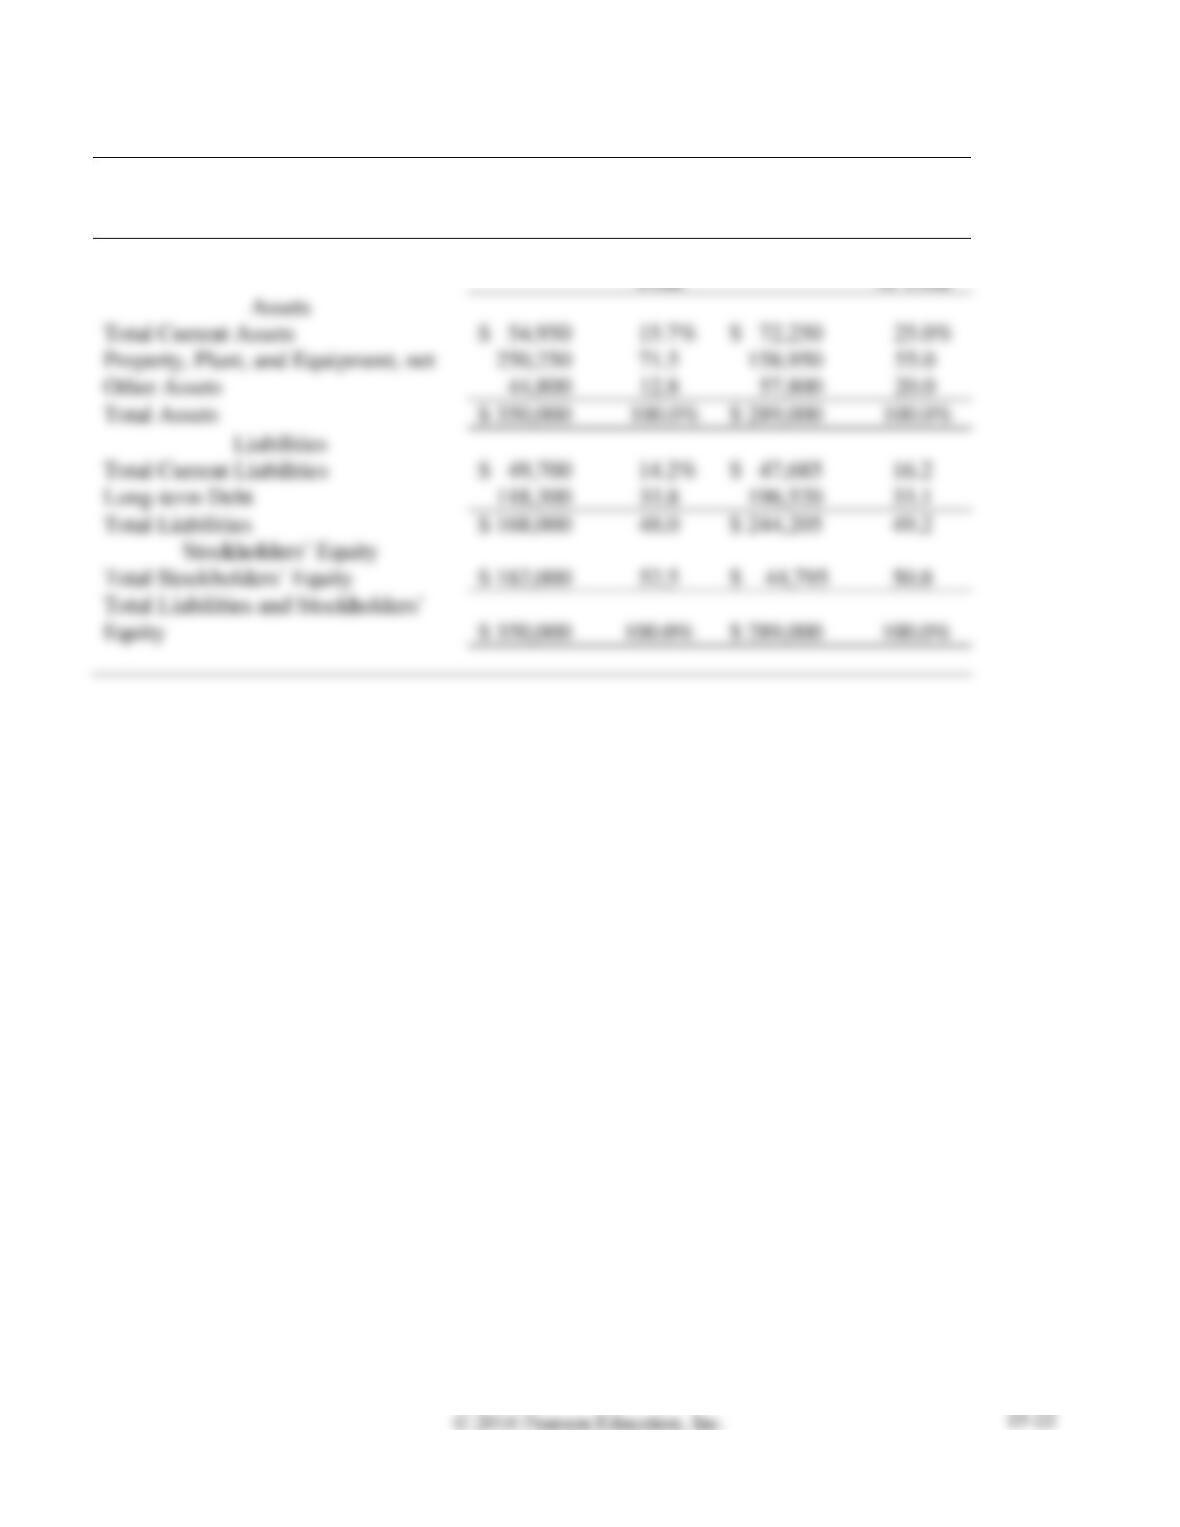
SOLUTION
TRI DESIGNS, INC.
Comparative Balance Sheet
December 31, 2016 and 2015
2016
Percent of
Total
2015
Percent
of Total
55.0
20.0
100.0%
E15-18 Preparing common-size income statements
Learning Objective 3
1. 2016 Net Income 28.1%
Refer to the data presented for McCormick Designs, Inc. in Exercise E15-15.
Requirements
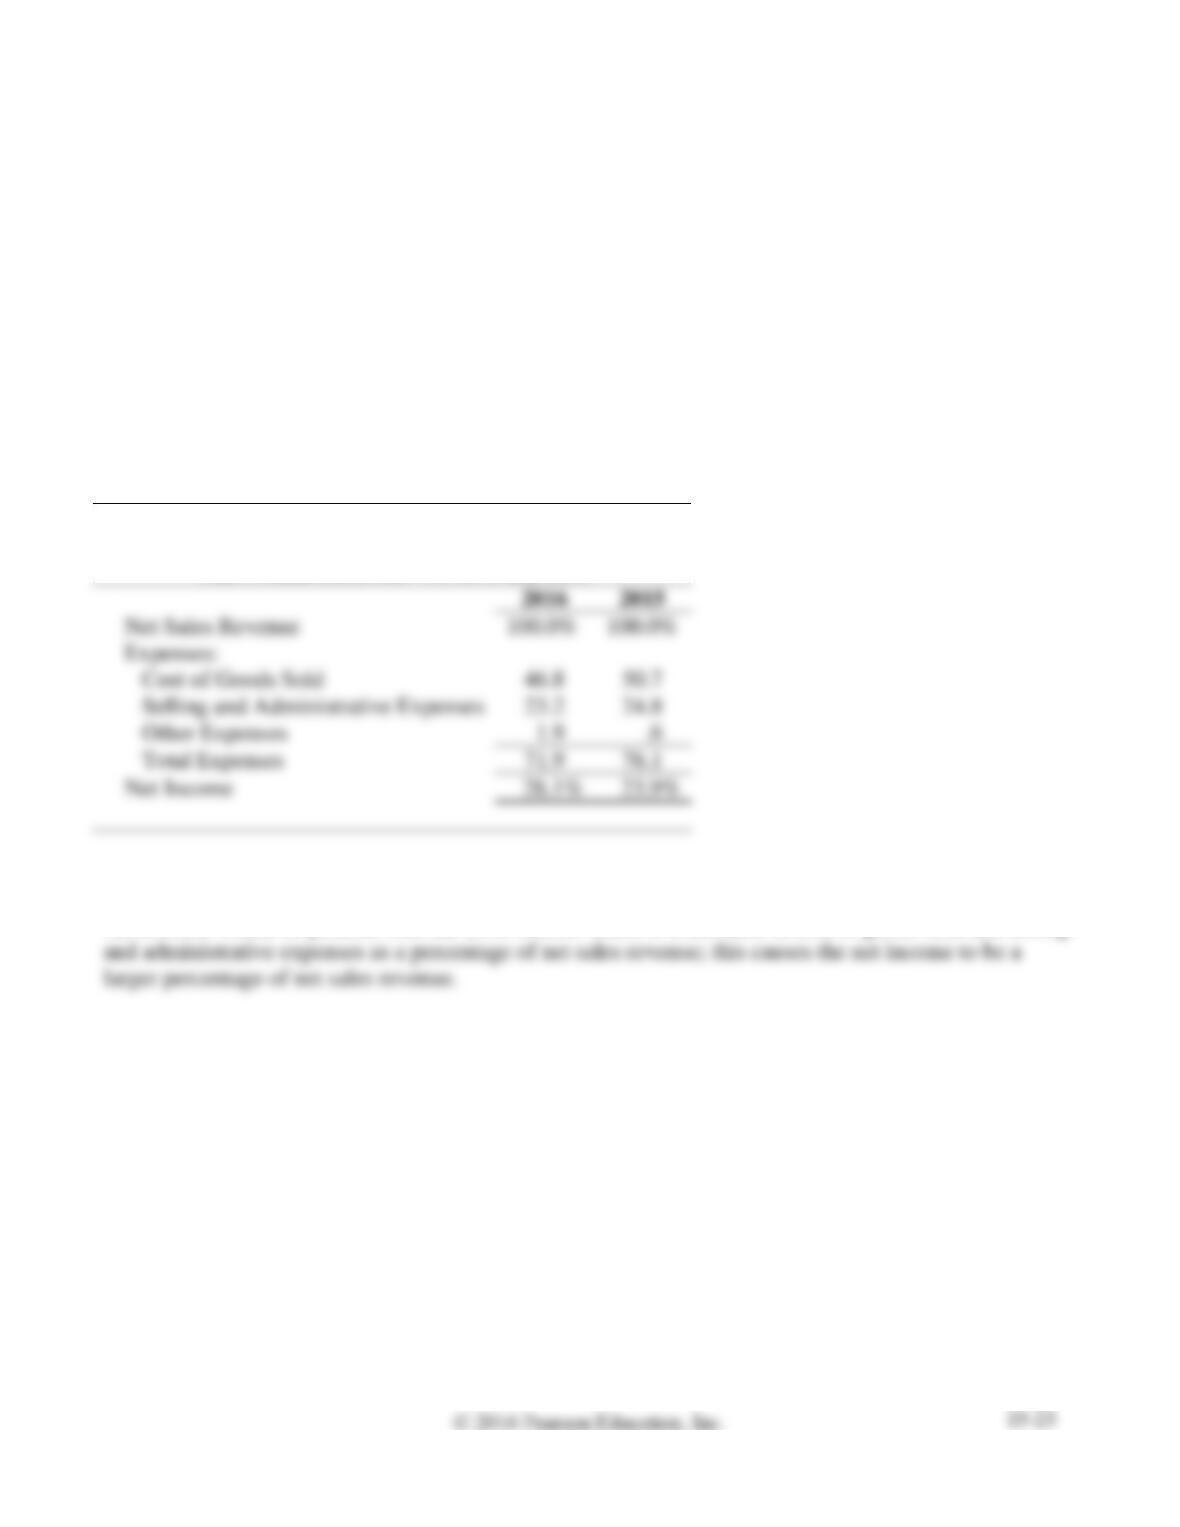
1. Prepare a comparative common-size income statement for McCormick Designs, Inc. using the 2016
and 2015 data. Round percentages to one-tenth percent (three decimal places).
2. To an investor, how does 2016 compare with 2015? Explain your reasoning.
SOLUTION
Requirement 1
MCCORMICK DESIGNS, INC.
Comparative Common-Size Income Statement
Years Ended December 31, 2016 and 2015
Requirement 2
An investor would be pleased with the 2016 results. There is a decrease in cost of goods sold and selling
E15-19 Computing working capital changes
Learning Objective 4
2017 Working Capital $200,000
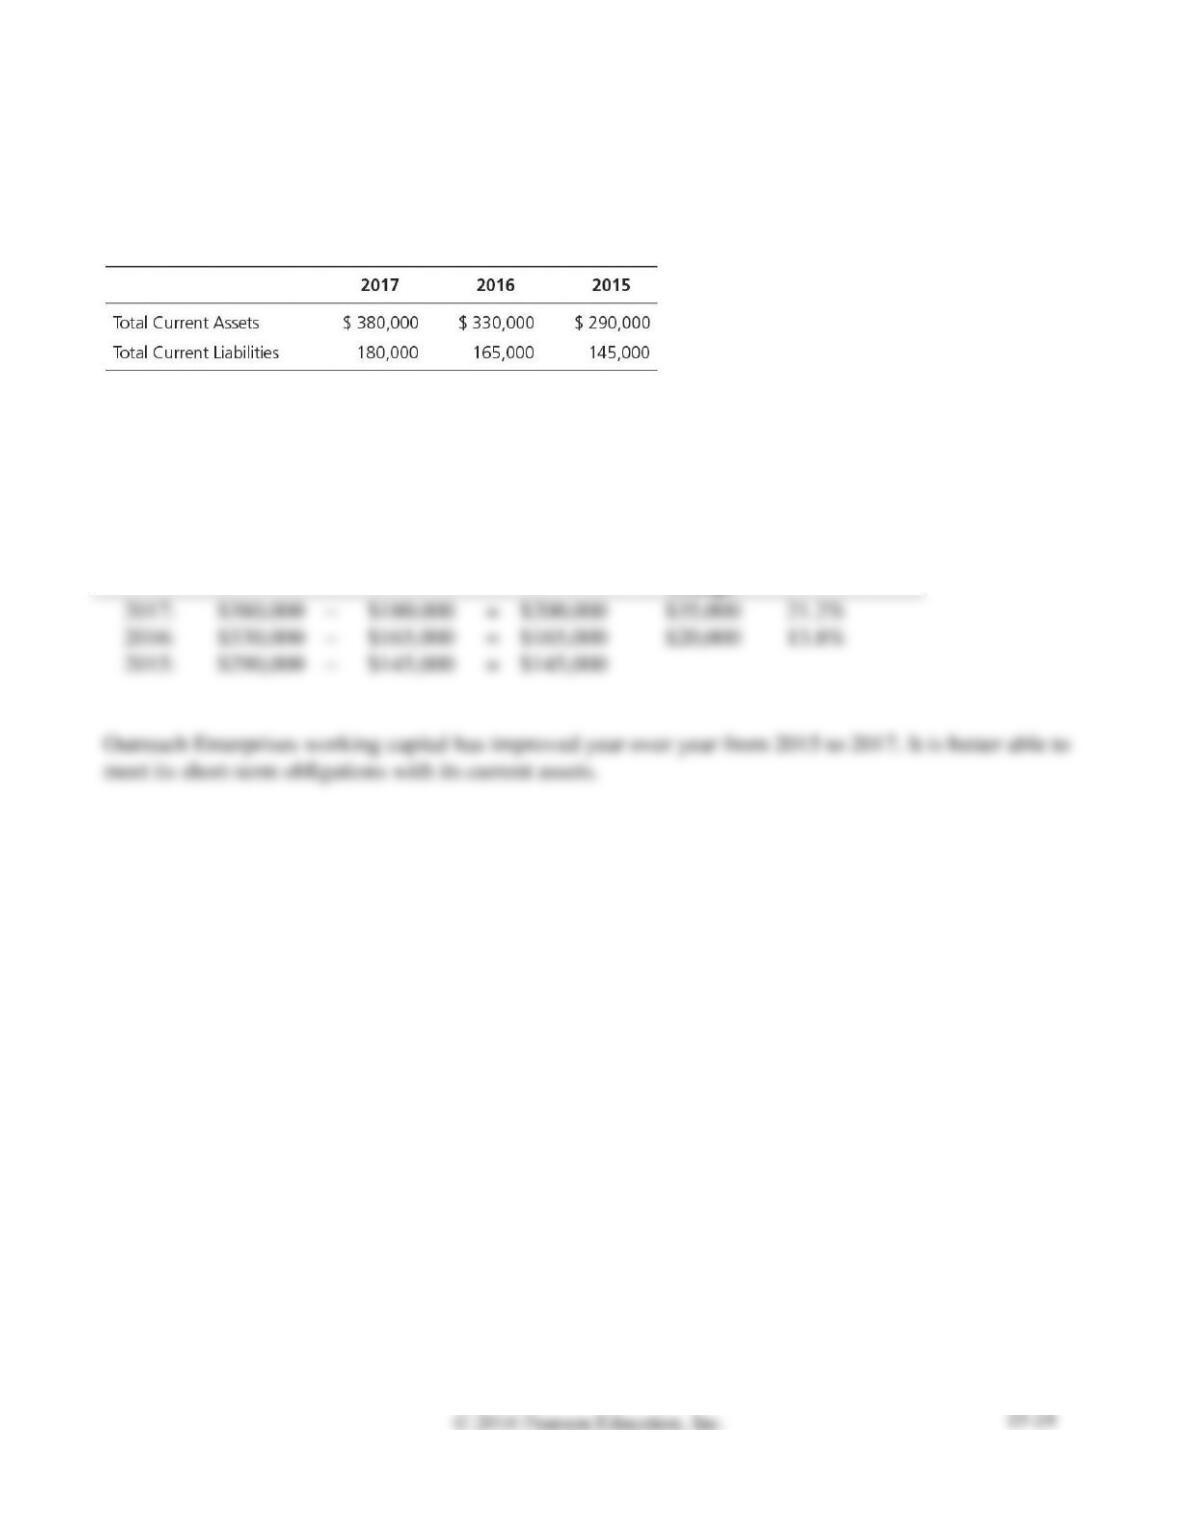
Data for Outreach Enterprises follows:
Compute the dollar amount of change and the percentage of change in Outreach Enterprises’s working
capital each year during 2017 and 2016. What do the calculated changes indicate?
SOLUTION
Current
Assets
–
Current
Liabilities
=
Working
Capital
Dollar
amount of
change
Percentage of
Change
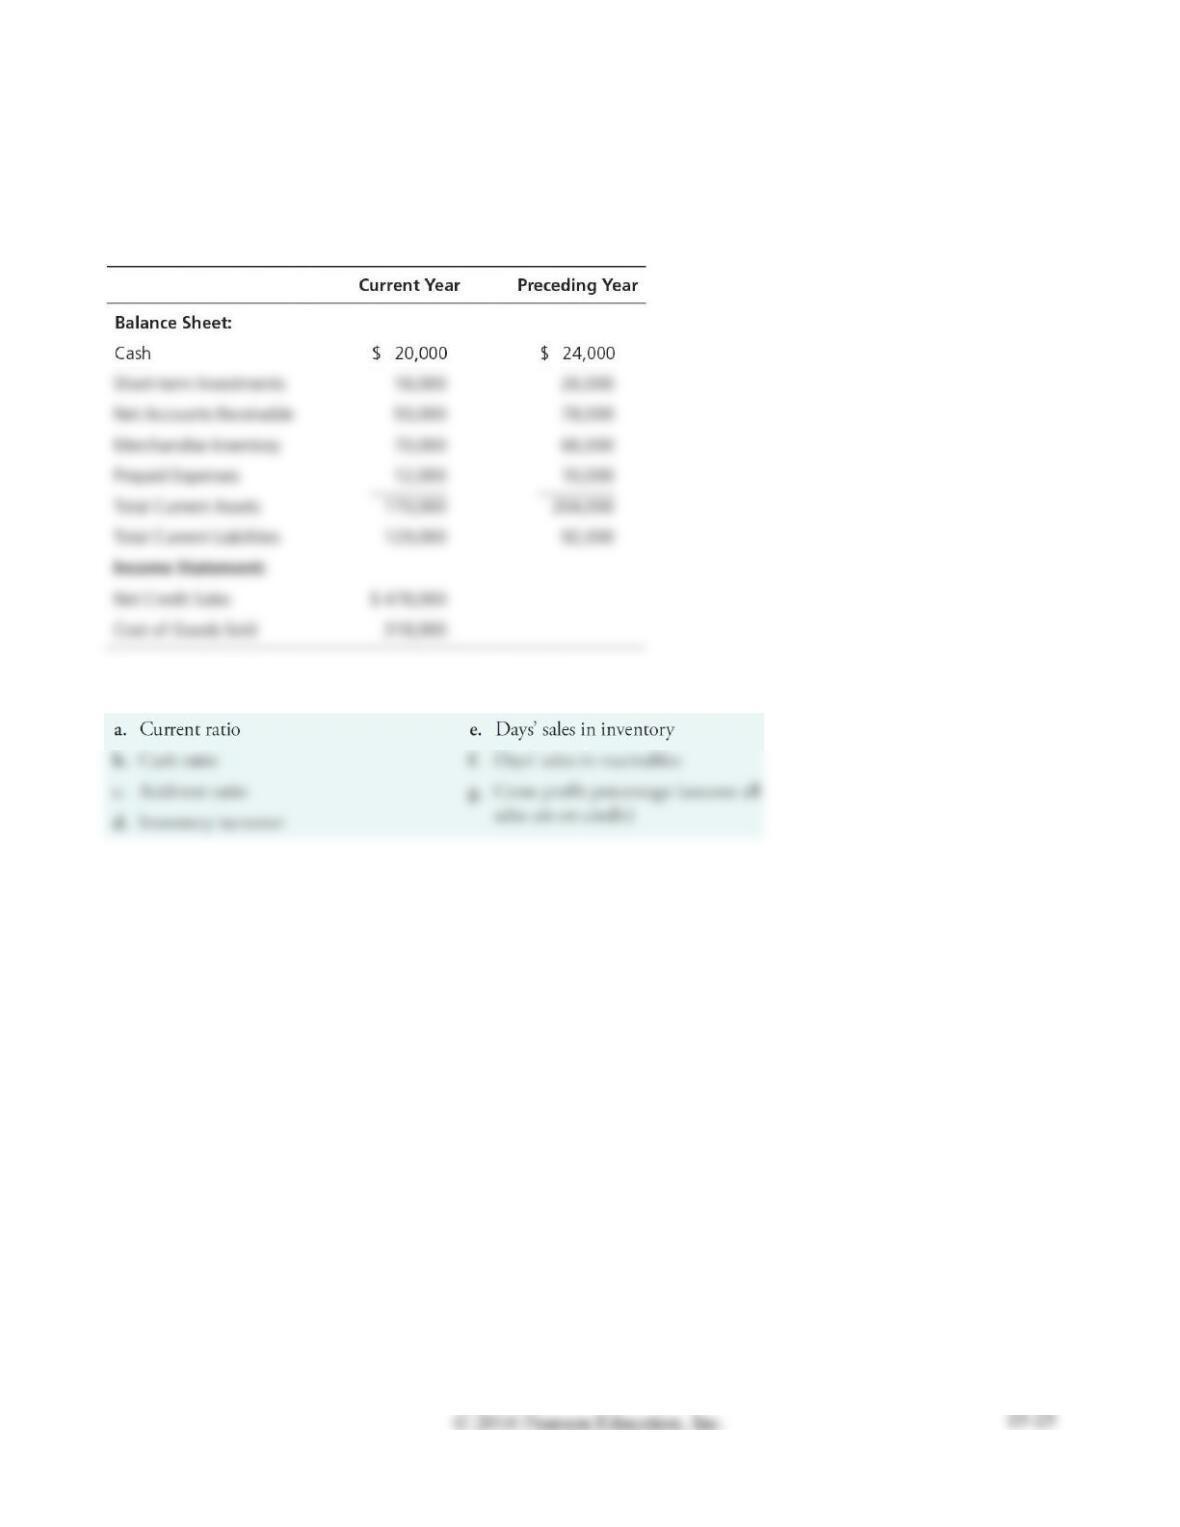
E15-20 Computing key ratios
Learning Objective 4
e. 78 days
The financial statements of Victory’s Natural Foods include the following items:
Compute the following ratios for the current year:
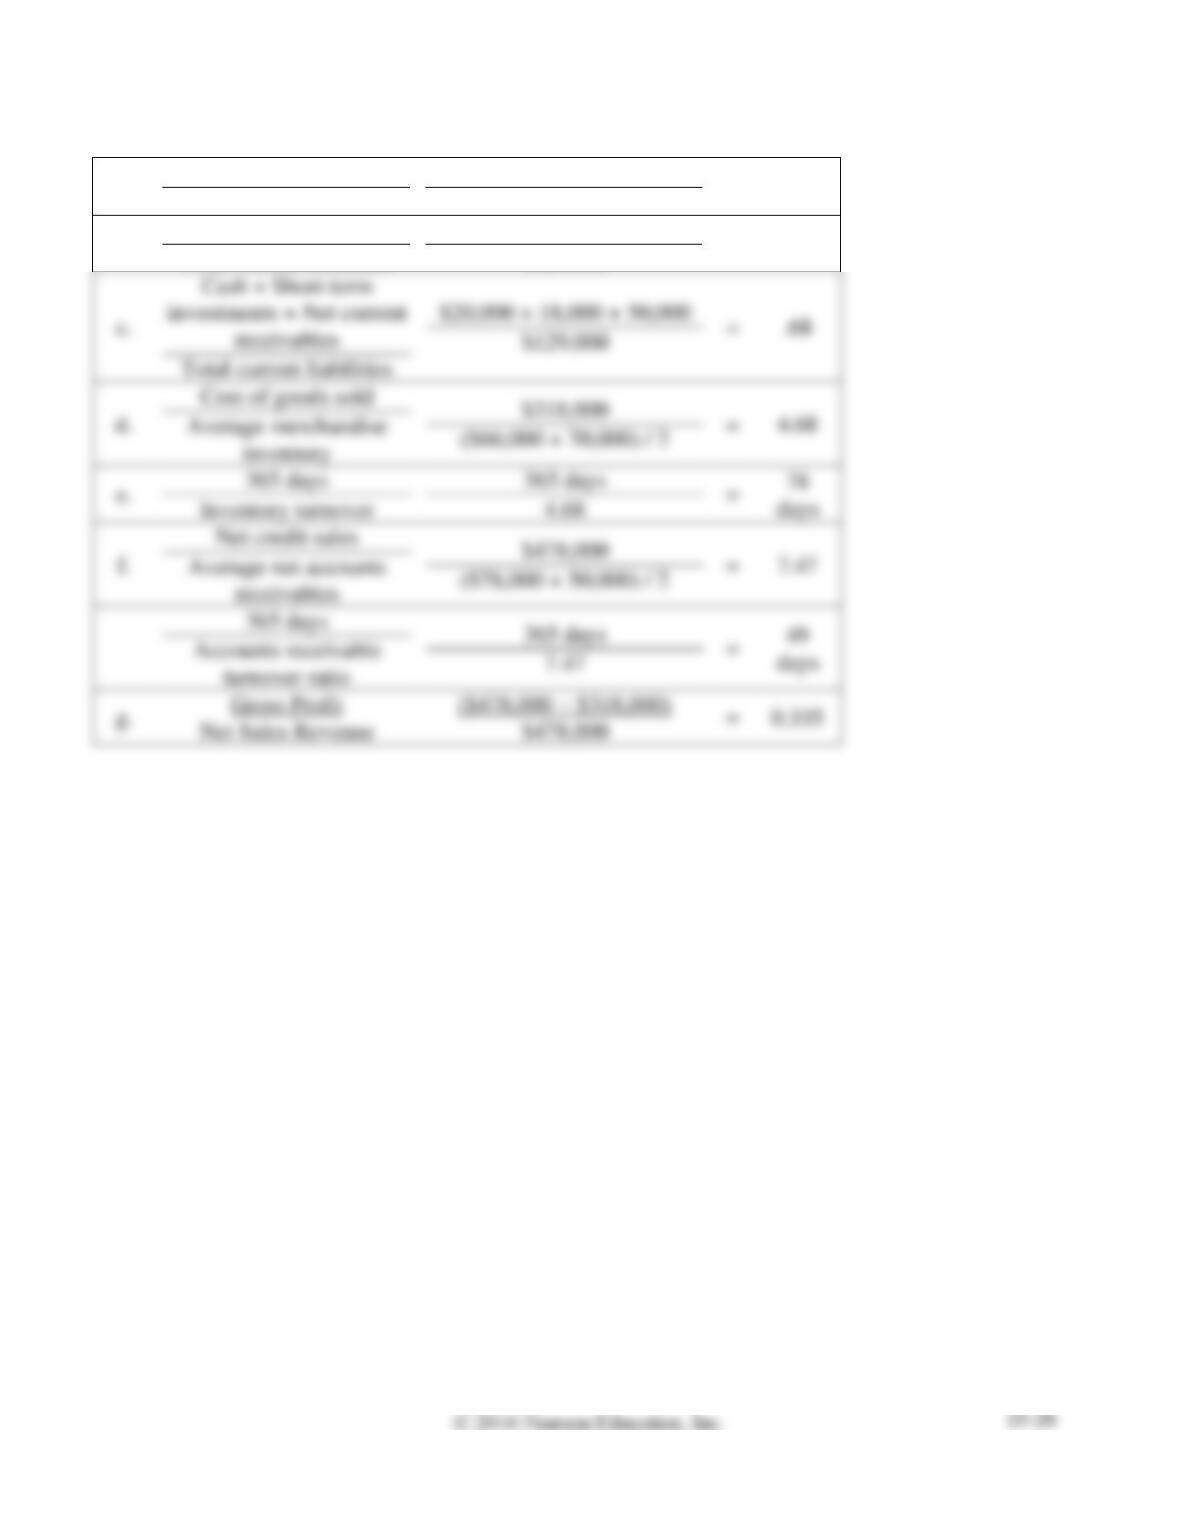
SOLUTION
a.
Total current assets
Total current liabilities
$170,000
$129,000
=
1.32
b.
Cash + Cash equivalents
Total current liabilities
$20,000 + 0
$129,000
=
.16
Total current liabilities
e.
365 days
=
days
$478,000
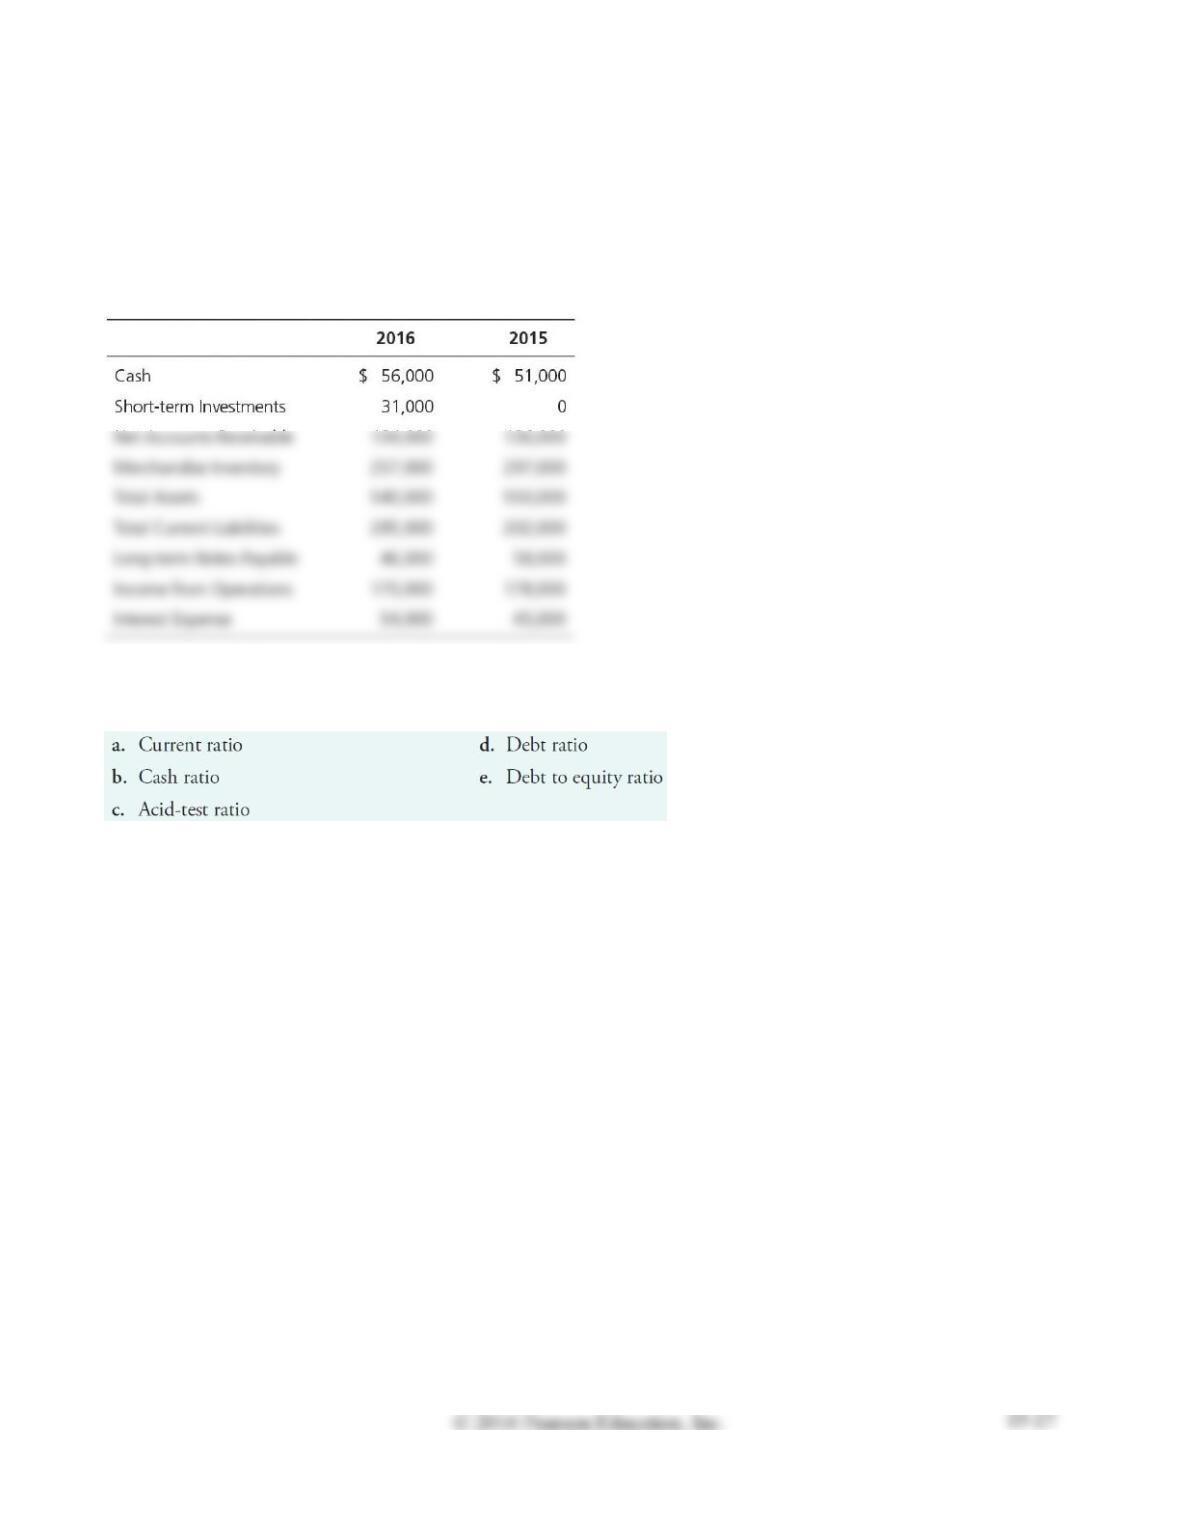
E15-21 Analyzing the ability to pay liabilities
Learning Objective 4
d. 2016 0.61
Big Bend Photo Shop has asked you to determine whether the company’s ability to pay current liabilities
and total liabilities improved or deteriorated during 2016. To answer this question, you gather the
following data:
Compute the following ratios for 2016 and 2015, and evaluate the company’s ability to pay its current
liabilities and total liabilities:
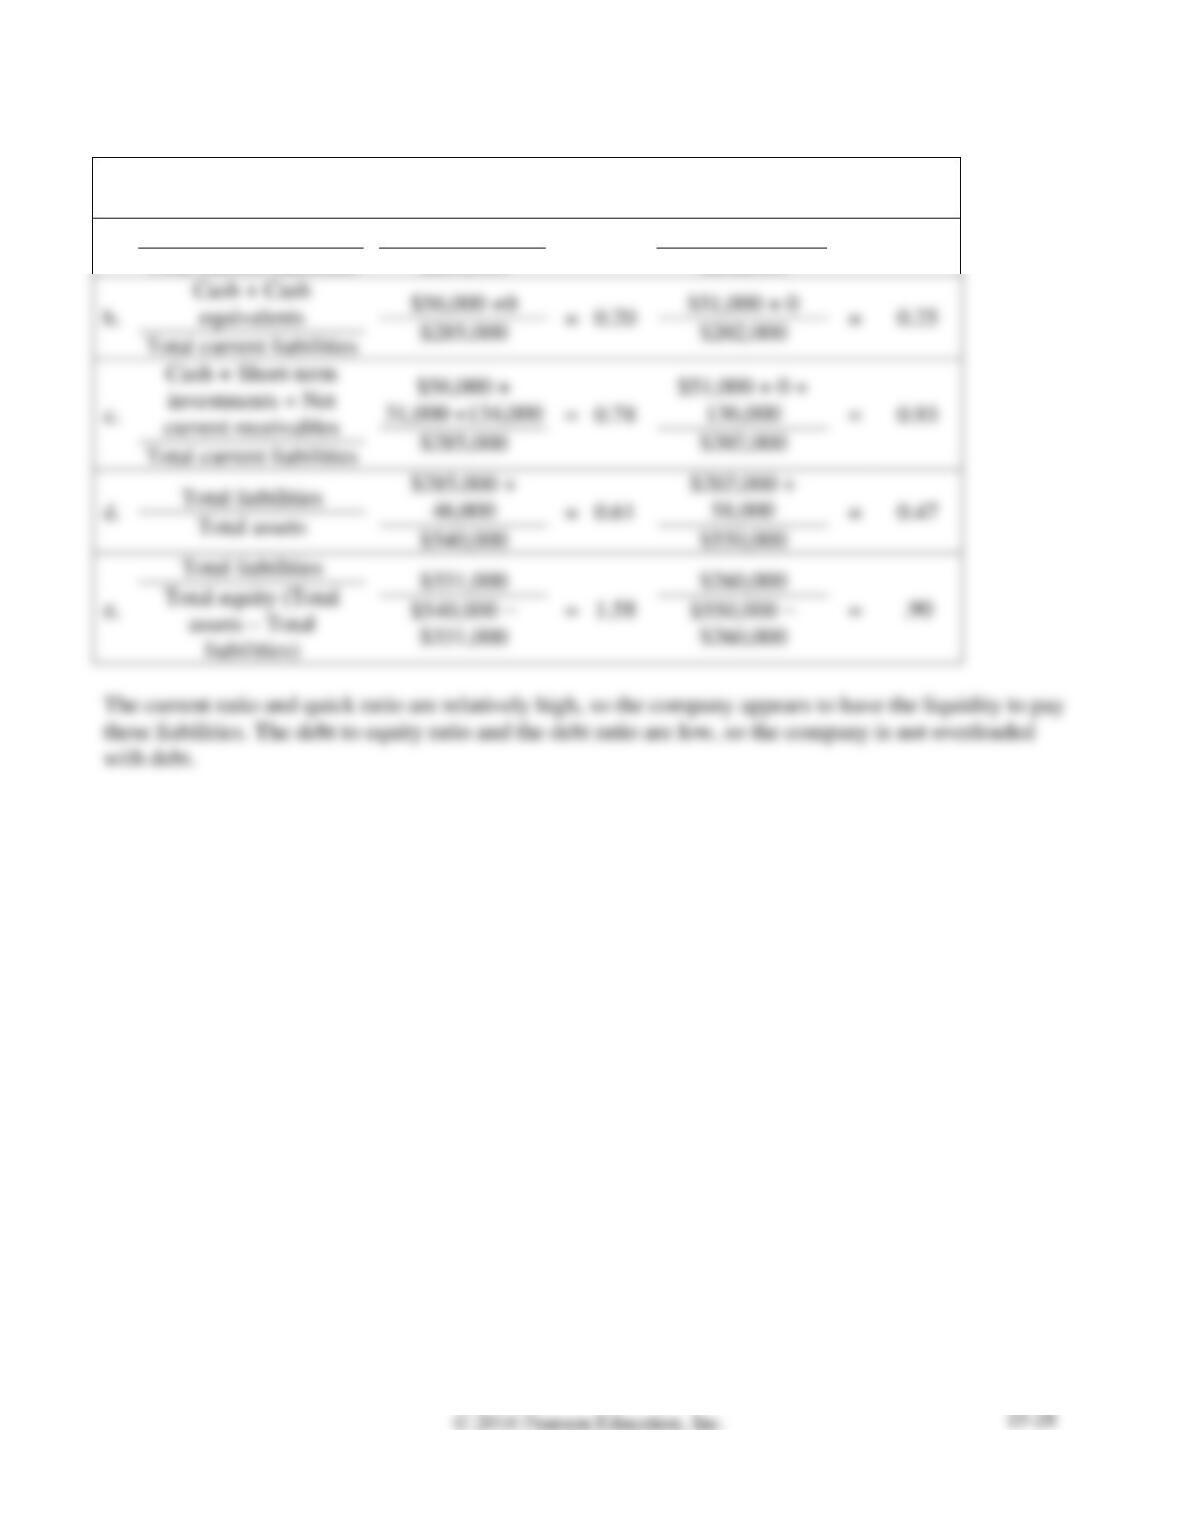
SOLUTION
2016
2015
a.
Total current assets
Total current liabilities
$478,000
$285,000
=
1.68
$484,000
$202,000
=
2.40
Total current liabilities
Total current liabilities
$540,000
$550,000
E15-22 Analyzing profitability
Learning Objective 4
1. 2017 11.6%
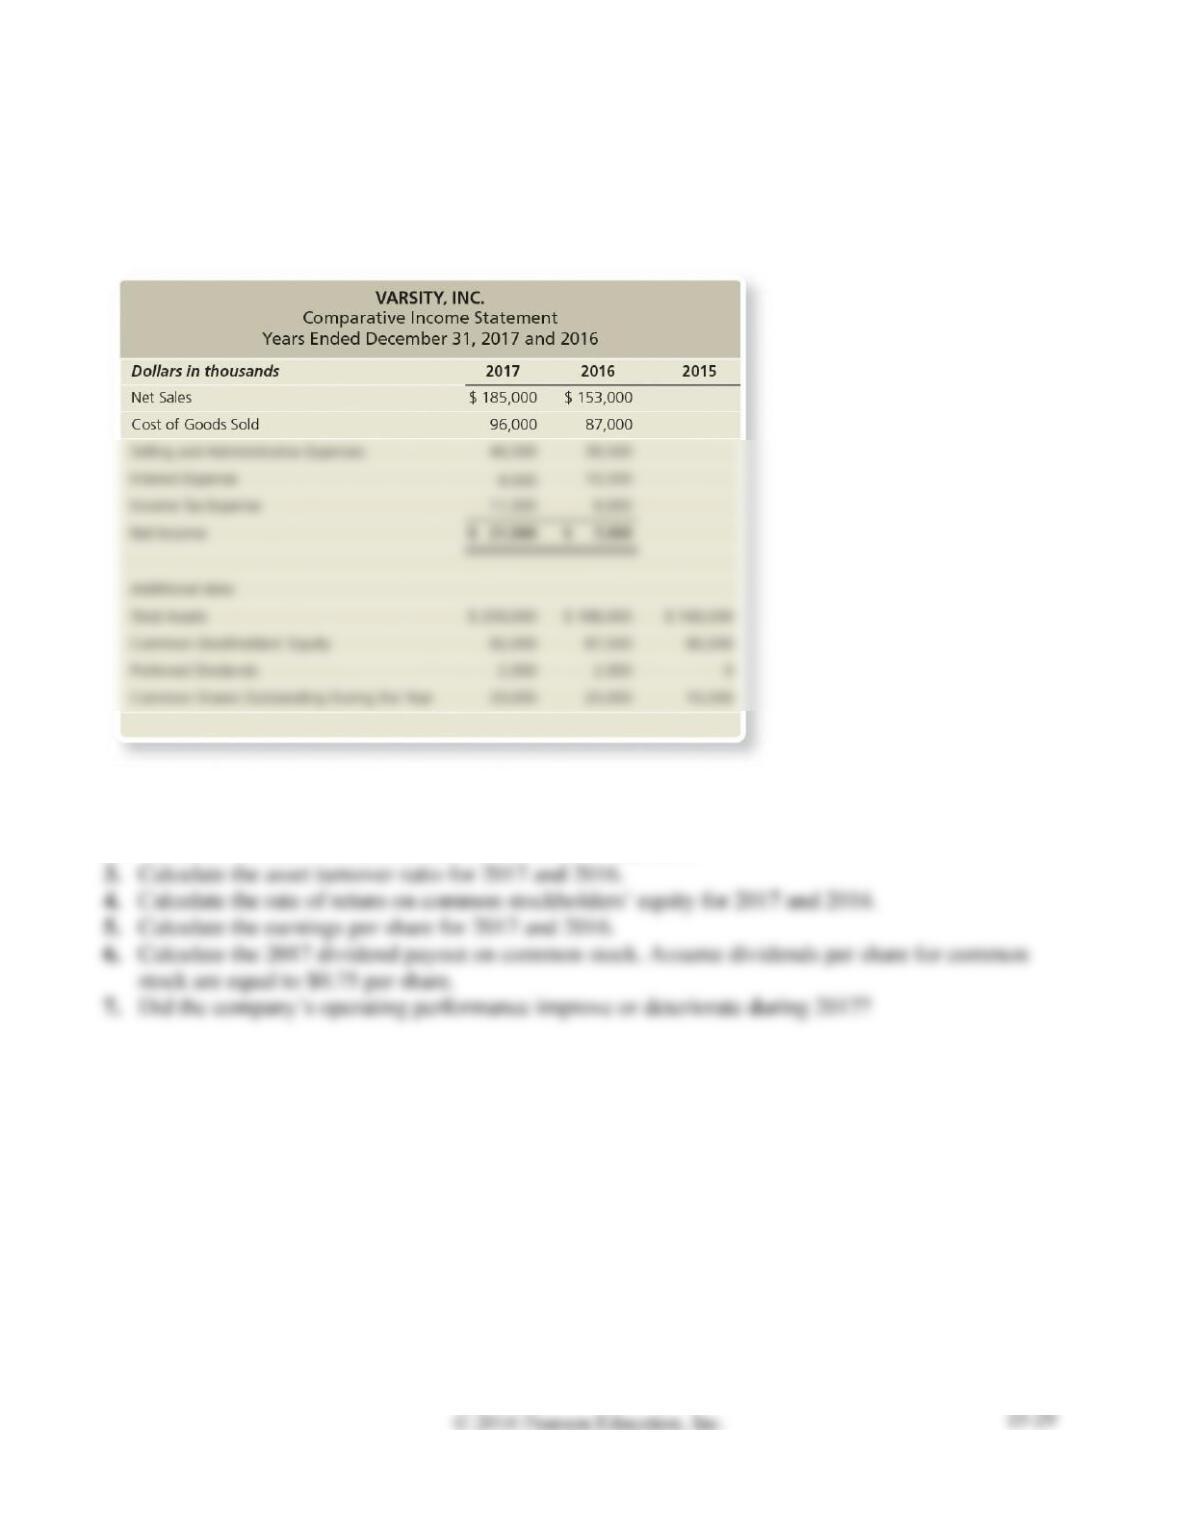
Varsity, Inc.’s comparative income statement follows. The 2015 data are given as needed.
Requirements
1. Calculate the profit margin ratio for 2017 and 2016.
2. Calculate the rate of return on total assets for 2017 and 2016.
SOLUTION
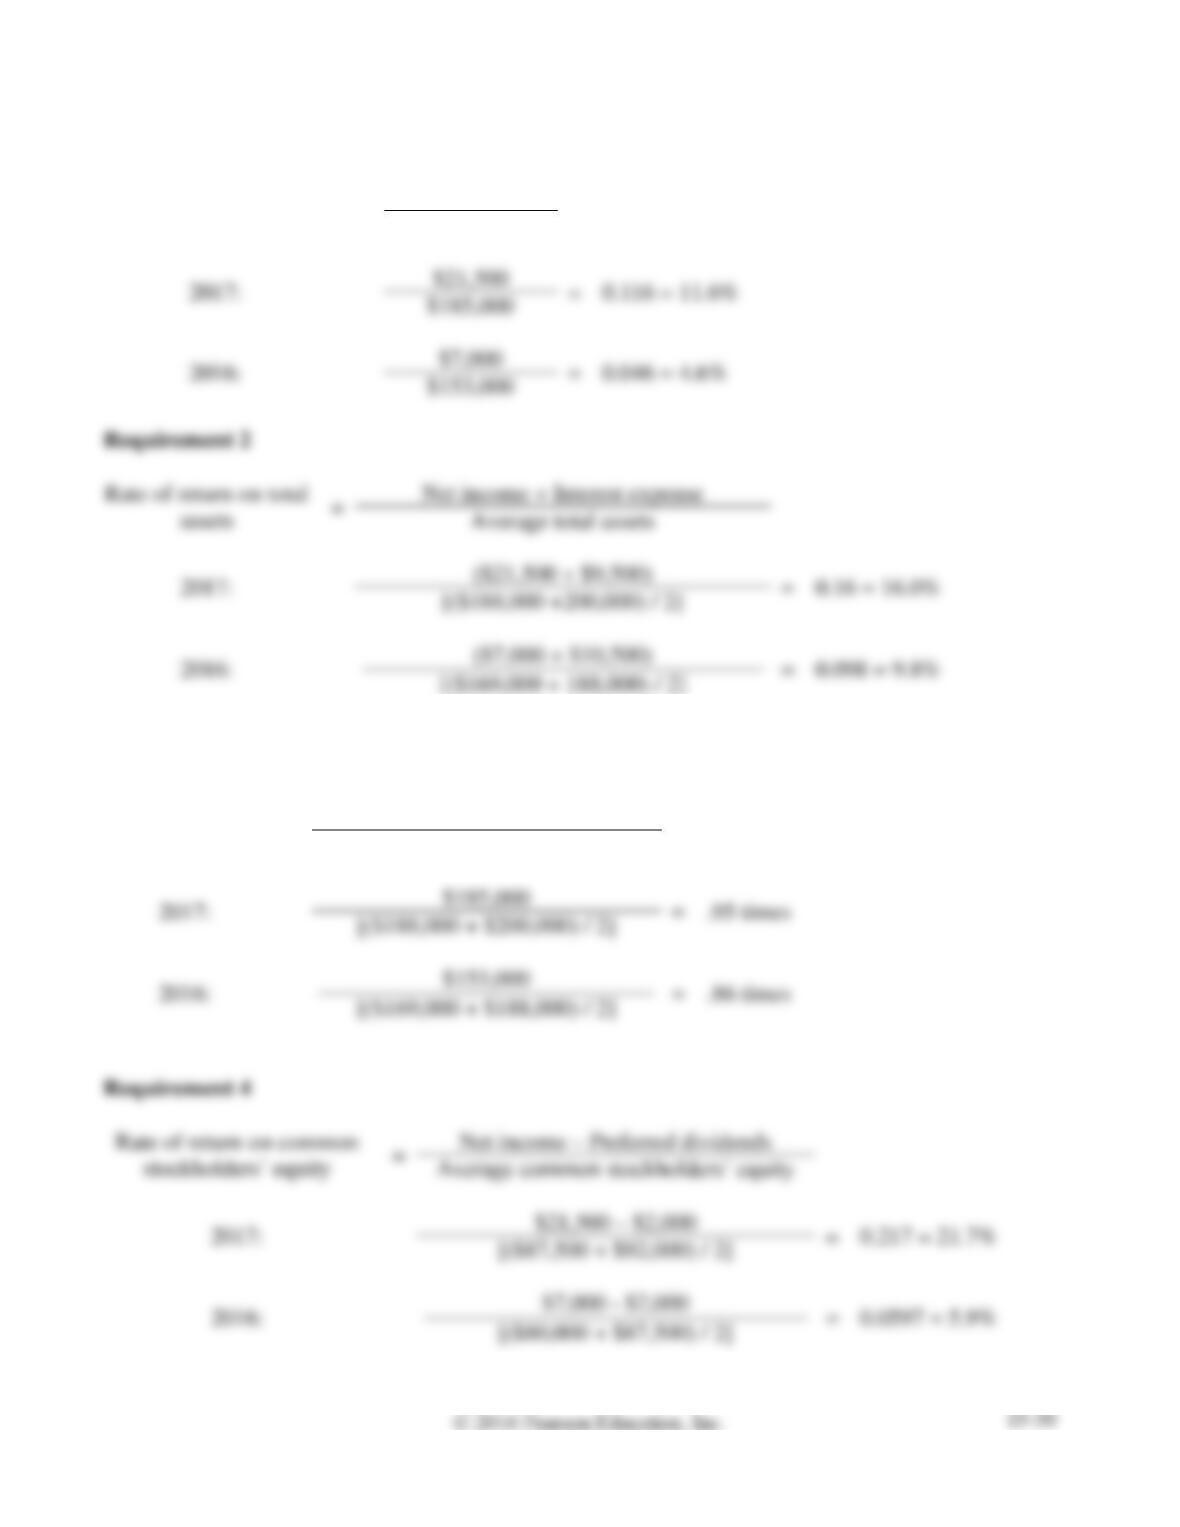
Requirement 1
Profit margin ratio
=
Net income
Net sales
=
0.116 = 11.6%
$185,000
=
0.046 = 4.6%
$153,000
Requirement 3
Asset turnover
ratio
=
Net sales
Average total assets
=
.95 times
Net income – Preferred dividends
=
0.217 = 21.7%
E15-22, cont.
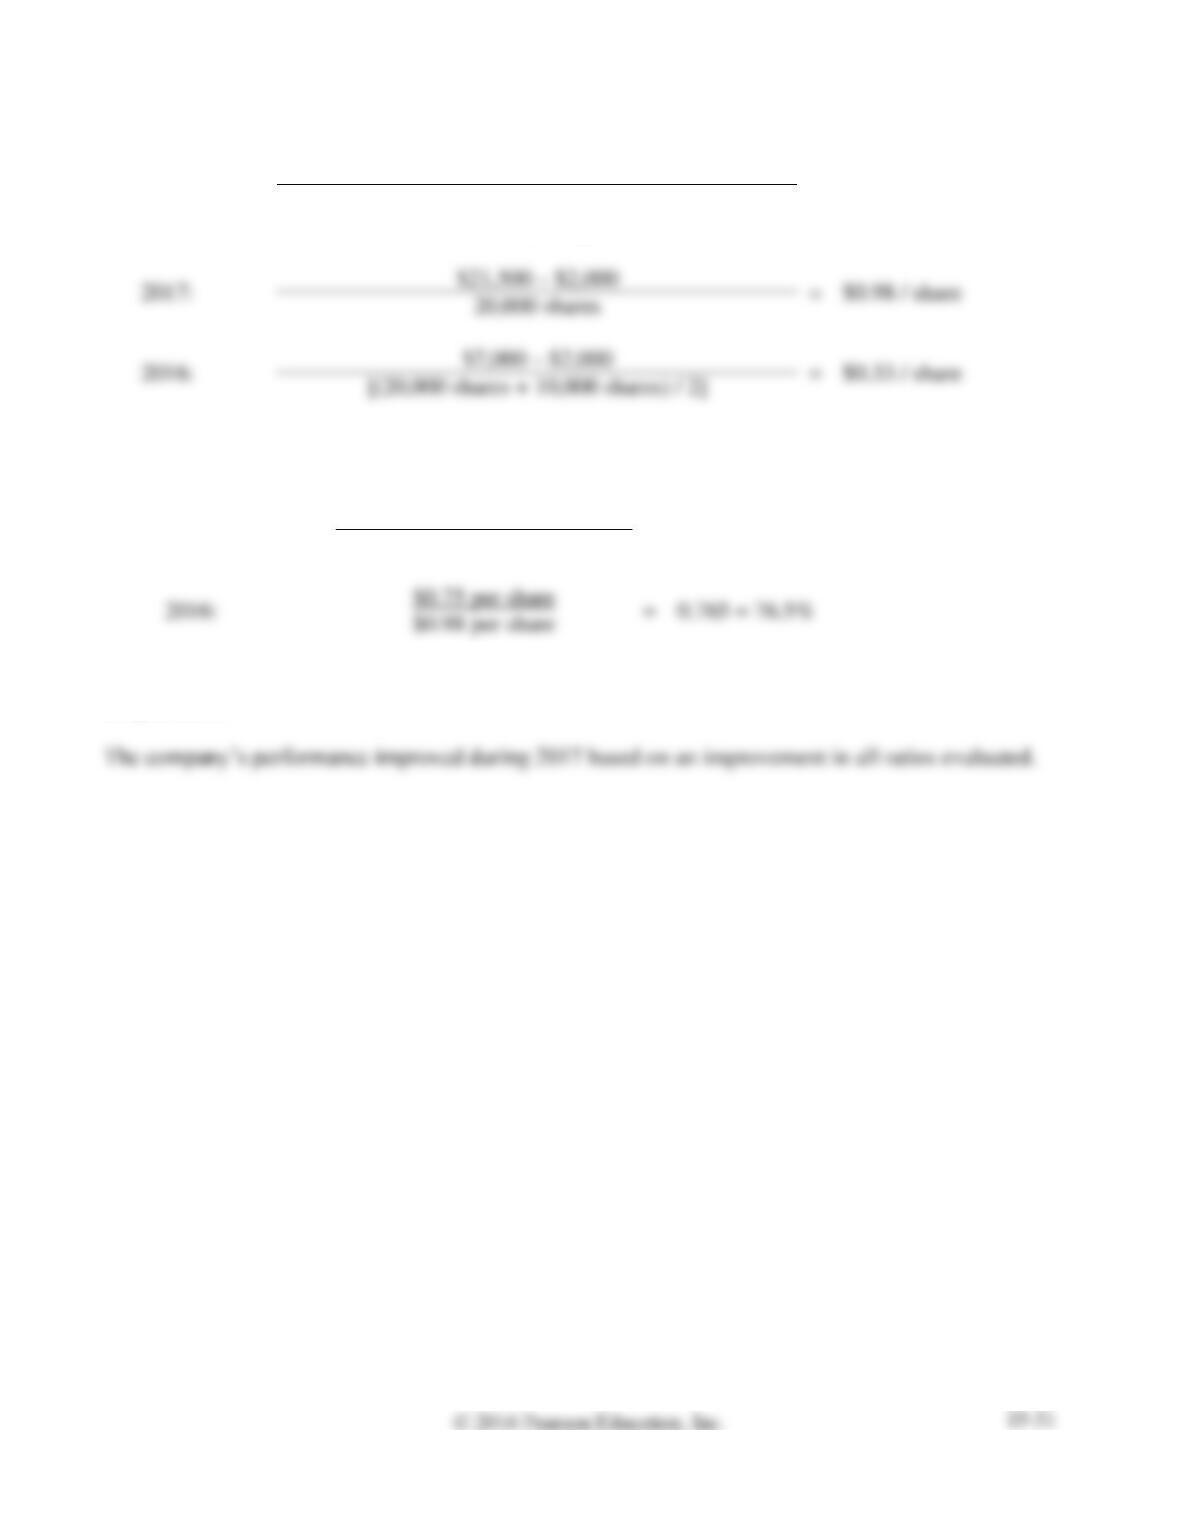
Requirement 5
Earnings per
share
=
Net income – Preferred dividends
Weighted average number of common shares
outstanding
Requirement 6
Dividend payout
=
Annual dividend per share
Earnings per share
=
0.765 = 76.5%
Requirement 7
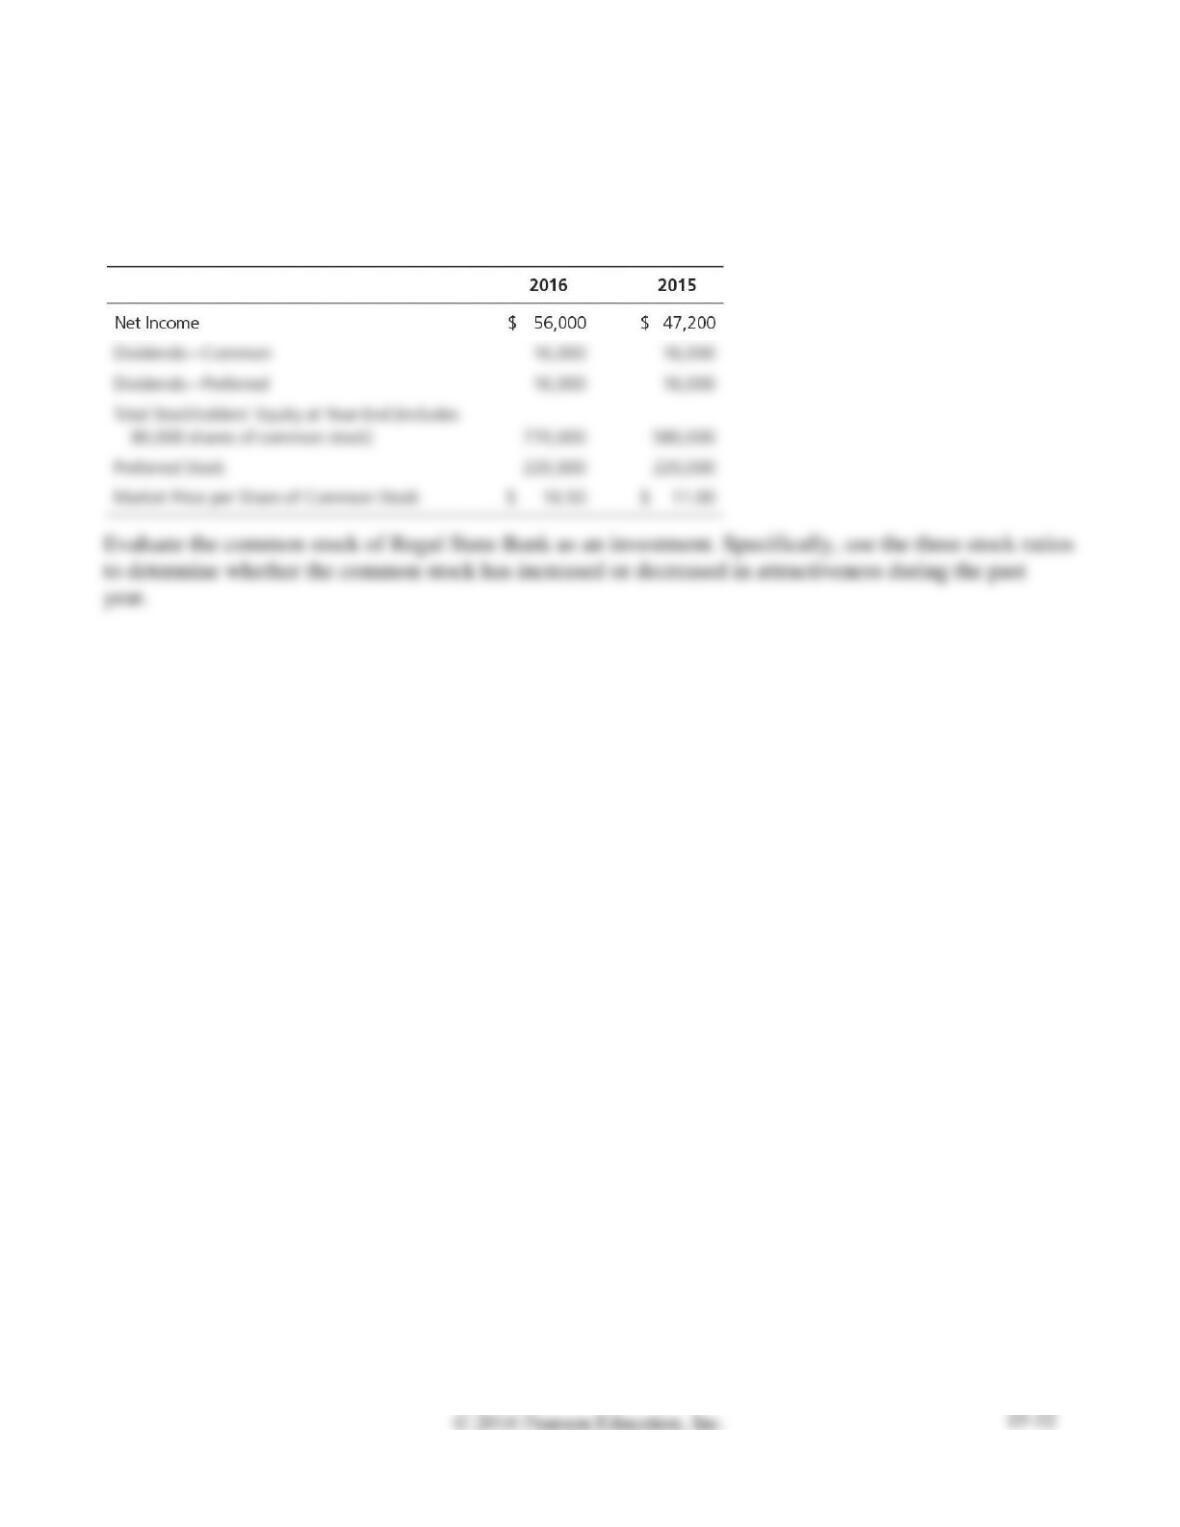
E15-23 Evaluating a stock as an investment
Learning Objective 4
Dividend Yield 2016 1.2%
Data for Regal State Bank follow:
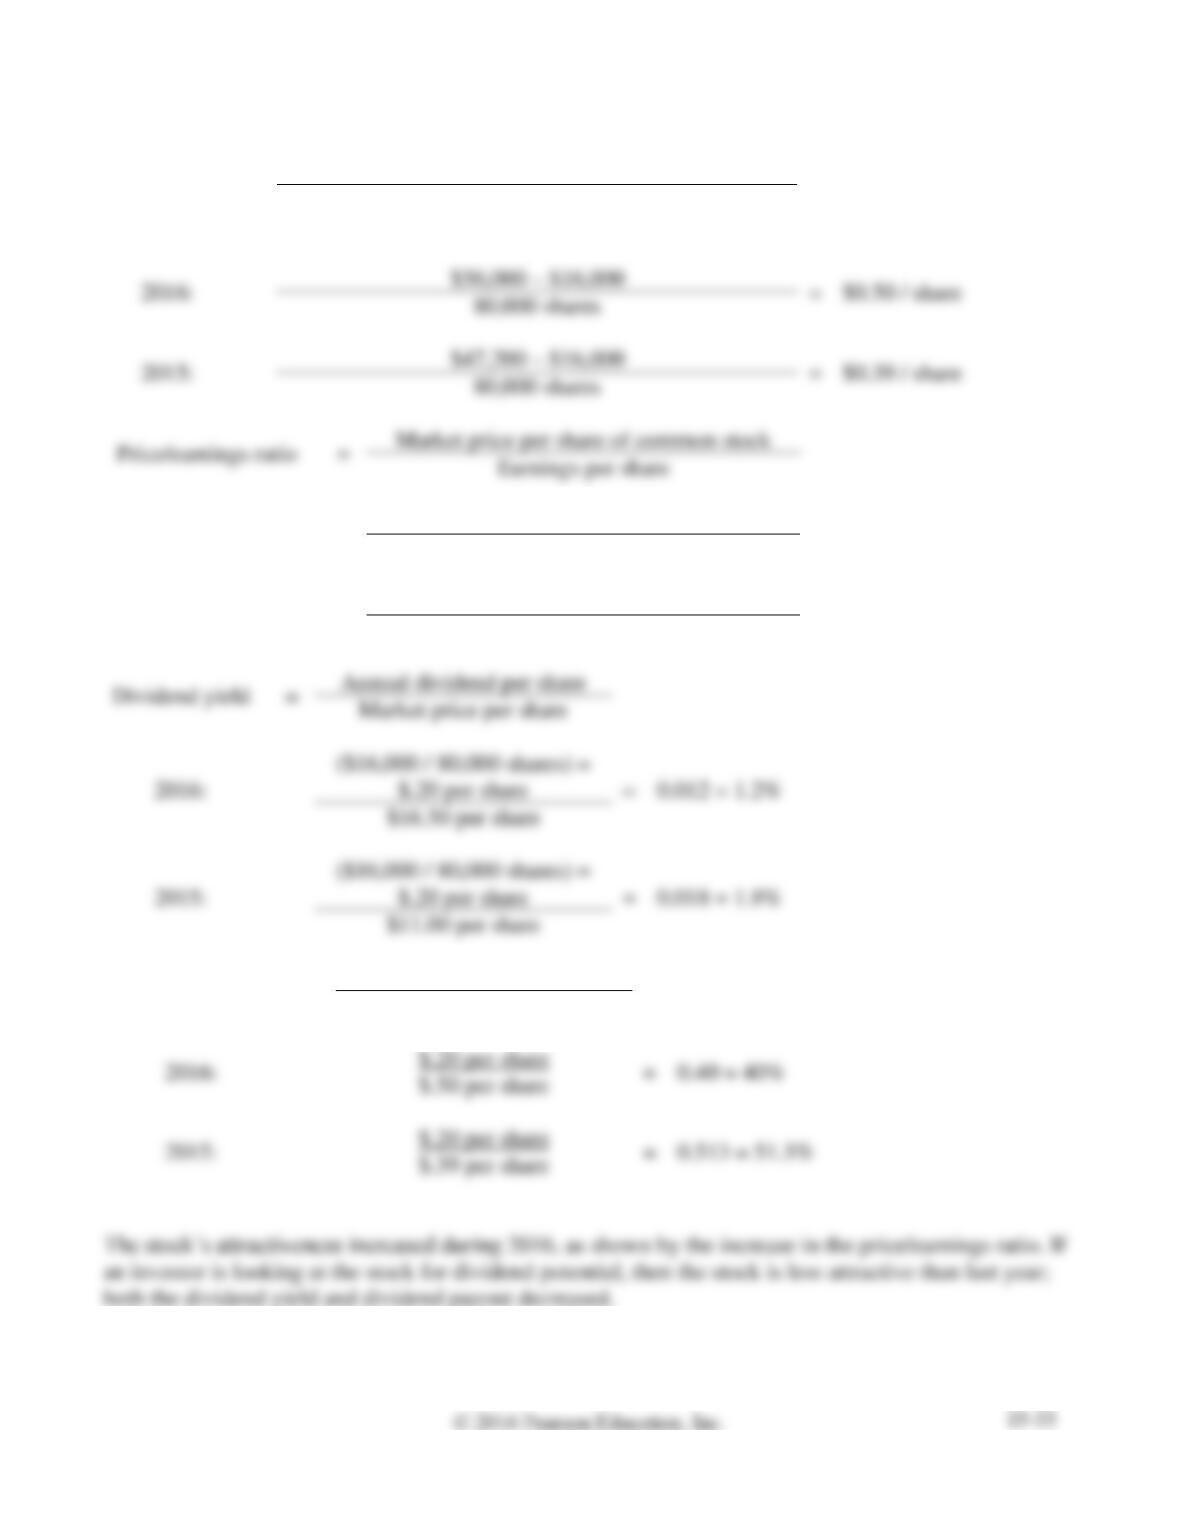
SOLUTION
Earnings per
share
=
Net income – Preferred dividends
Weighted average number of common shares
outstanding
2016:
$16.50 per share
=
33.00
$0.50 per share
2015:
$11.00 per share
=
28.21
$0.39 per share
Annual dividend per share
=
0.018 = 1.8%
Dividend payout
=
Annual dividend per share
Earnings per share
=
0.40 = 40%
=
0.513 = 51.3%
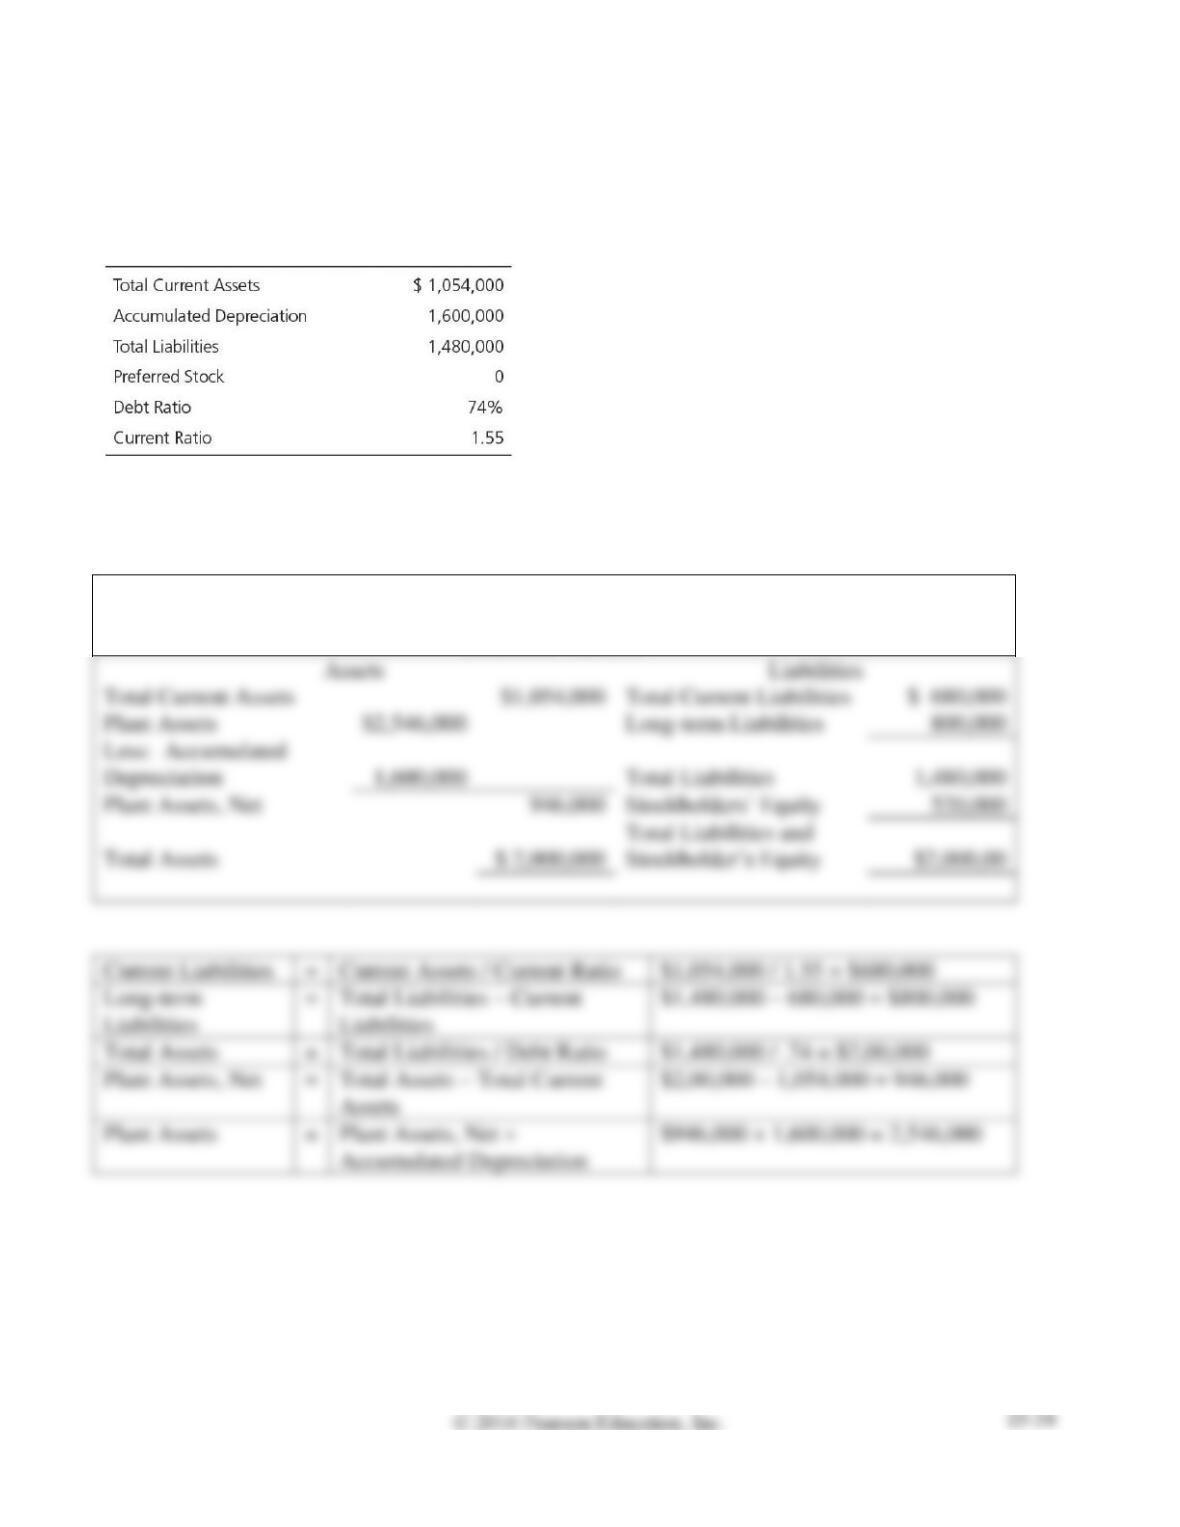
E15-24 Using ratios to reconstruct a balance sheet
Learning Objective 4
Total Assets $2,000,000
The following data are adapted from the financial statements of Jim’s Shops, Inc.:
Prepare Jim’s condensed balance sheet as of December 31, 2016.
SOLUTION
JIM’S SHOPS INC.
Balance Sheet
December 31, 2016
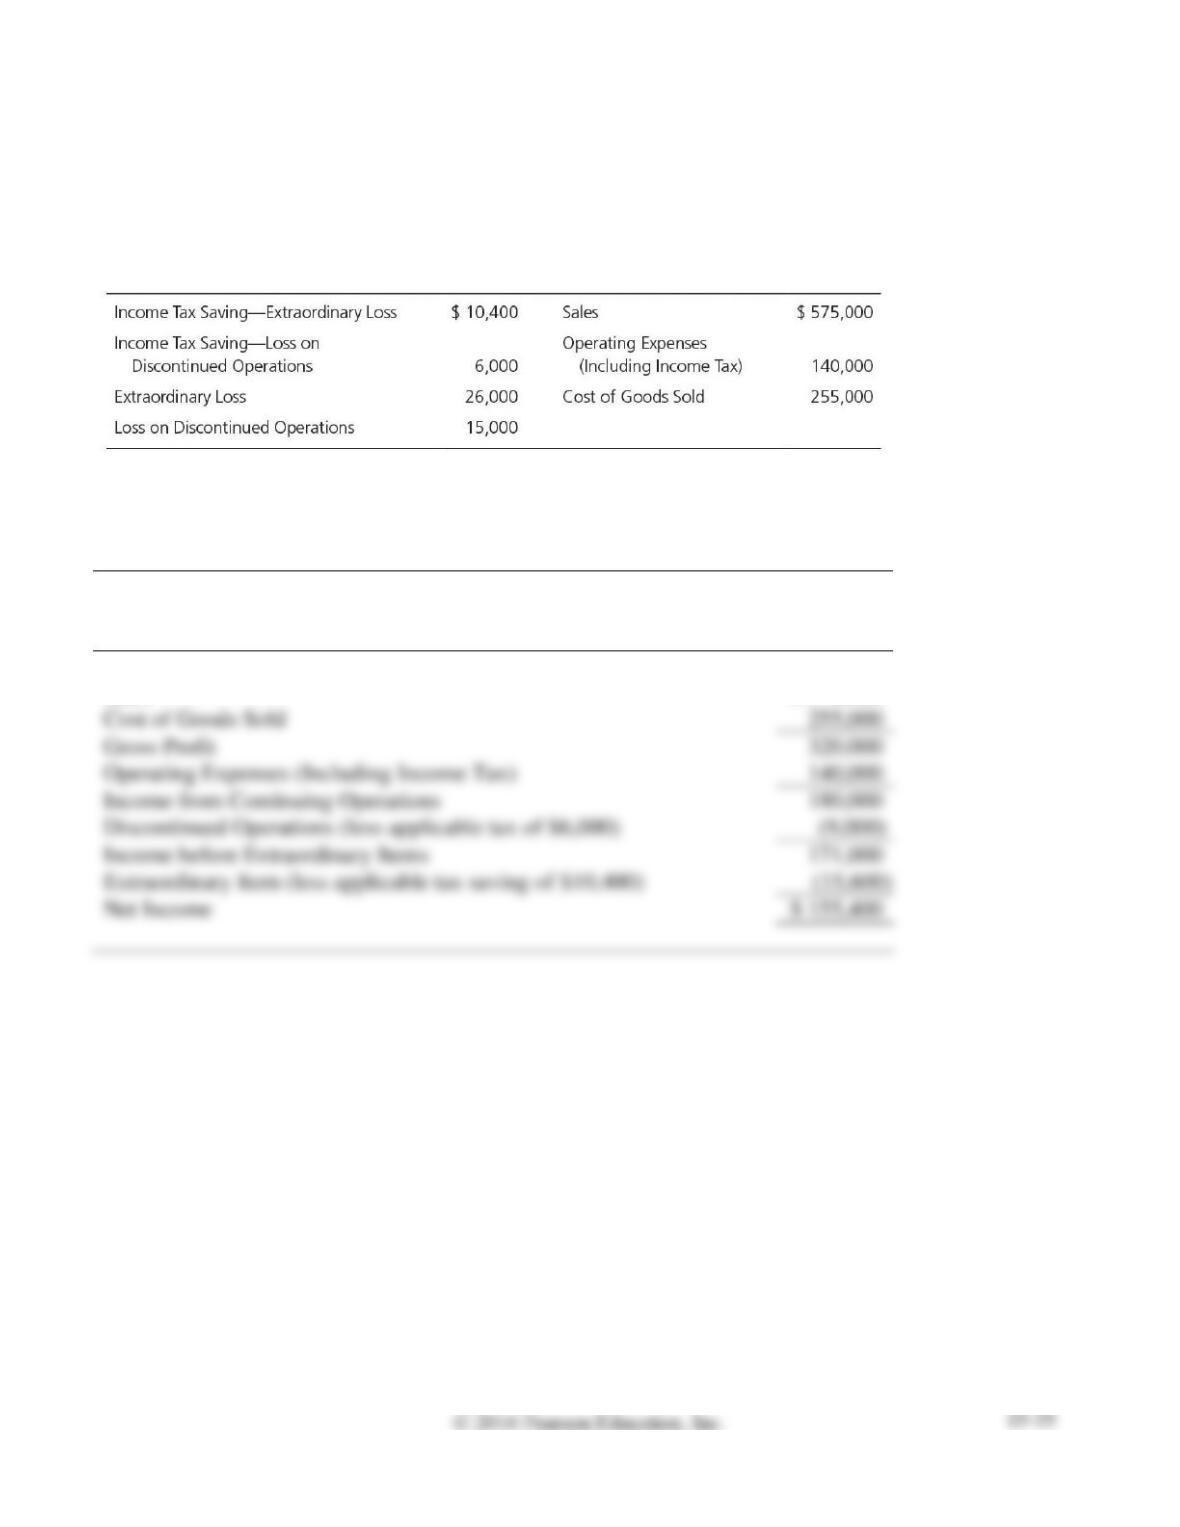
E15A-25 Preparing a multi-step income statement
Learning Objective 5
Appendix 15A
Net Income $155,400
Cloud Photographic Supplies, Inc.’s accounting records include the following for 2016:
Prepare Cloud’s multi-step income statement for 2016. Omit earnings per share.
SOLUTION
CLOUD PHOTOGRAPHIC SUPPLIES, INC.
Income Statement
Year Ended December 31, 2016
Sales
$ 575,000
Cost of Goods Sold
Gross Profit
Operating Expenses (Including Income Tax)
Income from Continuing Operations
Discontinued Operations (less applicable tax of $6,000)
Income before Extraordinary Items
Extraordinary Item (less applicable tax saving of $10,400)
Net Income
$ 155,400
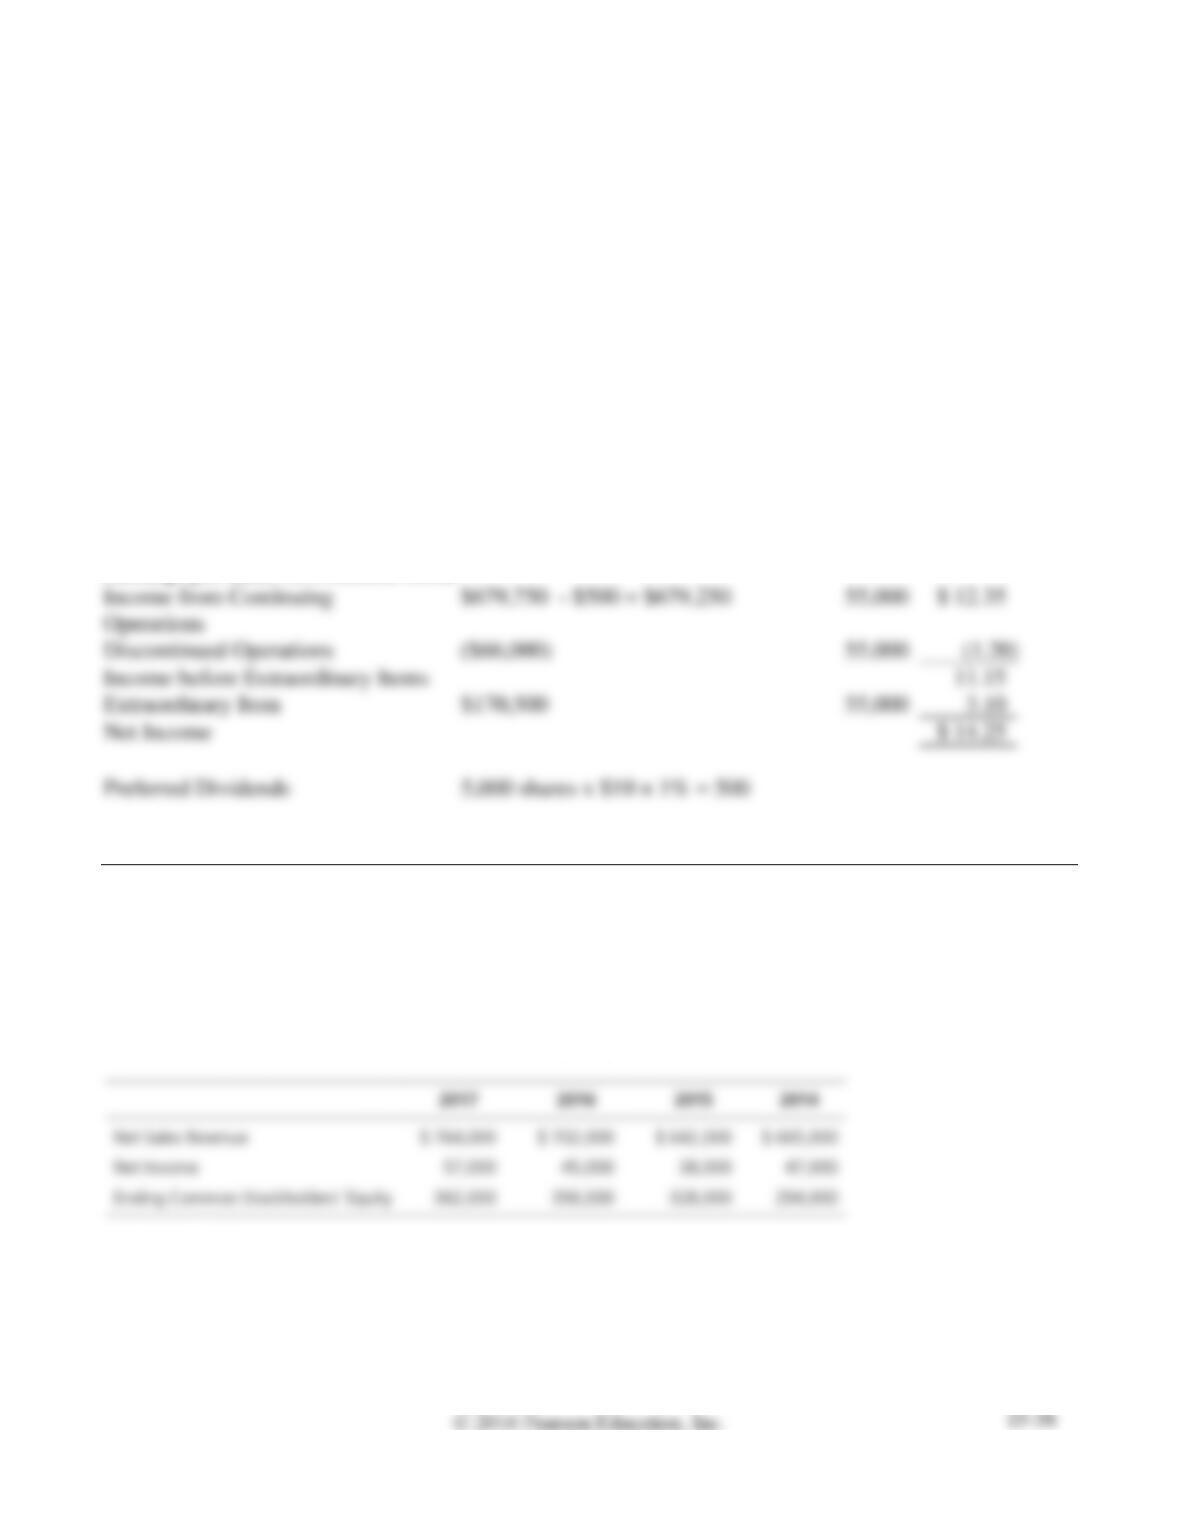
E15A-26 Computing earnings per share
Learning Objective 5
Appendix 15A
Net Income $14.25
Falconi Academy Surplus had 55,000 shares of common stock and 5,000 shares of 1%, $10 par value
preferred stock outstanding through December 31, 2016. Income from continuing operations for 2016
was $679,750, and loss on discontinued operations (net of income tax saving) was $66,000. Falconi also
had an extraordinary gain (net of tax) of $170,500.
Compute Falconi’s earnings per share for 2016, starting with income from continuing operations.
SOLUTION
Common
Shares
Outstanding
Earnings per Share of Common Stock
Discontinued Operations
Income before Extraordinary Items
Extraordinary Item
$170,500
Net Income
Preferred Dividends
5,000 shares x $10 × 1% = 500
Problems (Group A)
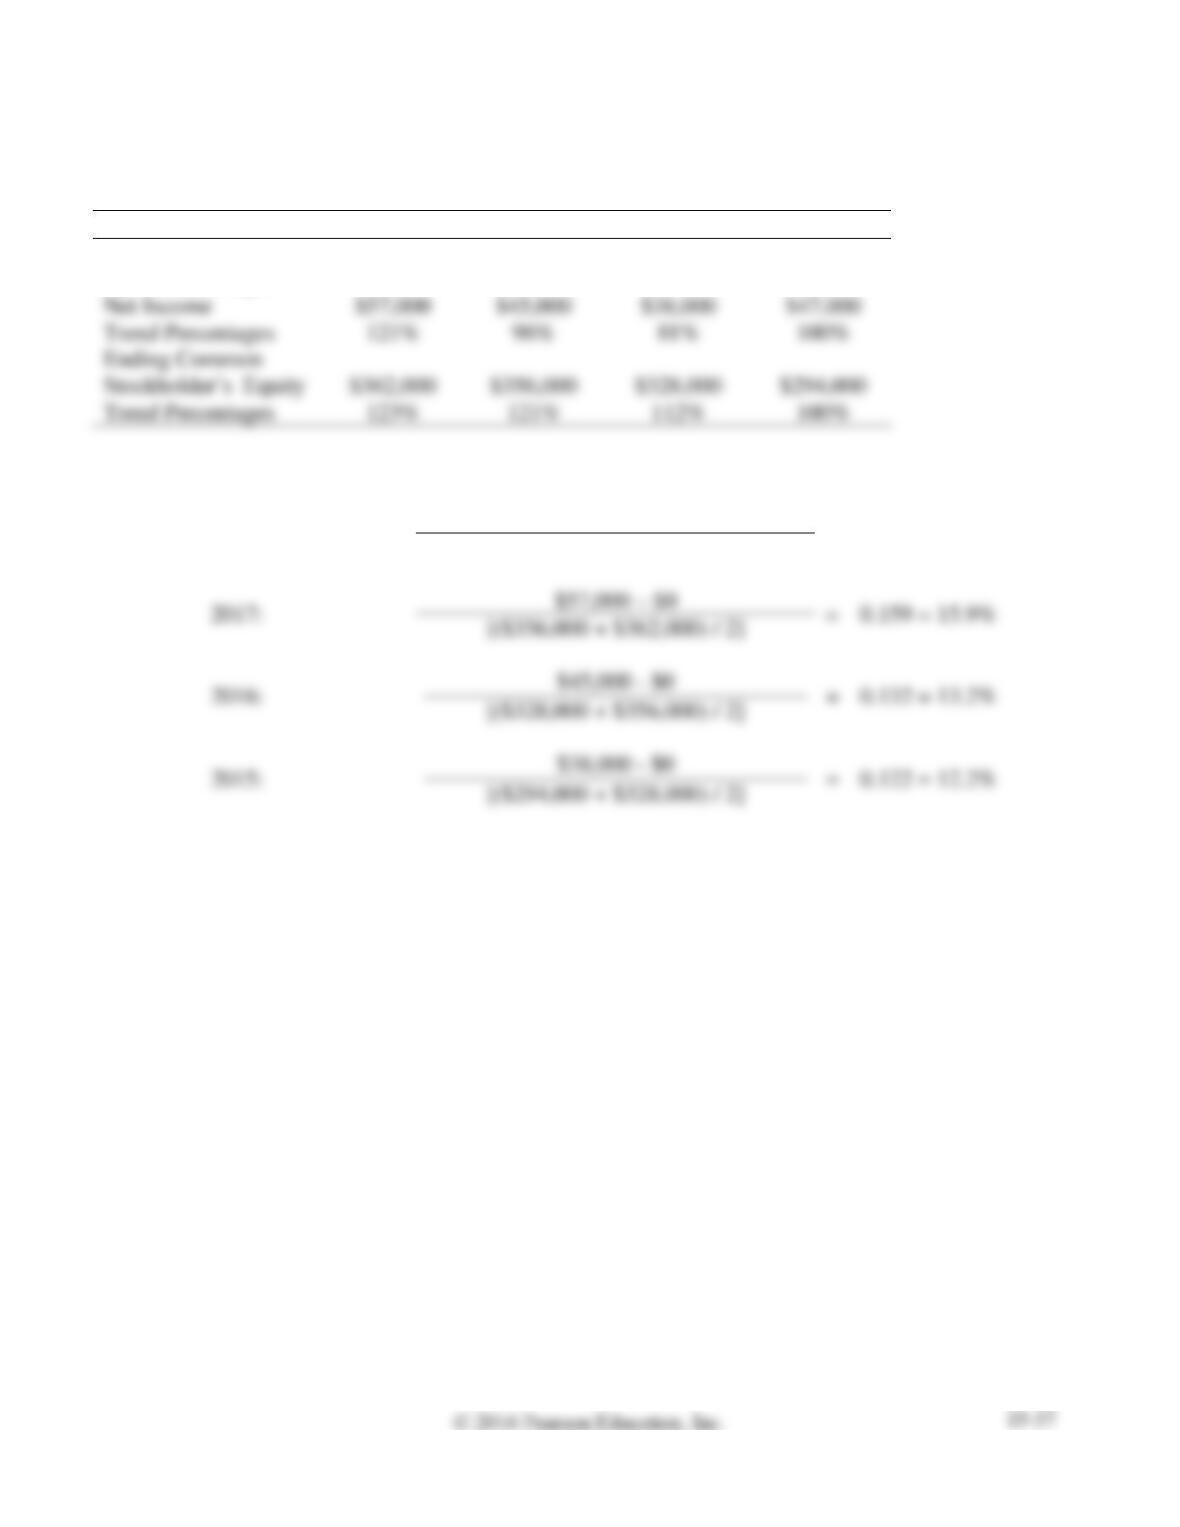
P15-27A Computing trend analysis and return on common equity
Learning Objectives 2, 4
2. 2017 15.9%
Net sales revenue, net income, and common stockholders’ equity for Shawnee Mission Corporation, a
manufacturer of contact lenses, follow for a four-year period.
Requirements
1. Compute trend analyses for each item for 2015–2017. Use 2014 as the base year, and round to the
nearest whole percent.
2. Compute the rate of return on common stockholders’ equity for 2015–2017, rounding to three
decimal places.
SOLUTION
Requirement 1
2017
2016
2015
2014
Net Sales Revenue
$ 764,000
$ 702,000
$ 642,000
$ 665,000
Trend Percentages
115%
106%
97%
100%
Net Income
$45,000
$47,000
Trend Percentages
121%
81%
100%
Trend Percentages
123%
121%
112%
100%
Requirement 2
Rate of return on common
stockholders’ equity
=
Net income – Preferred dividends
Average common stockholders’ equity
=
0.159 = 15.9%
P15-28A Performing vertical analysis
Learning Objective 2
1. Net Income 10.7%
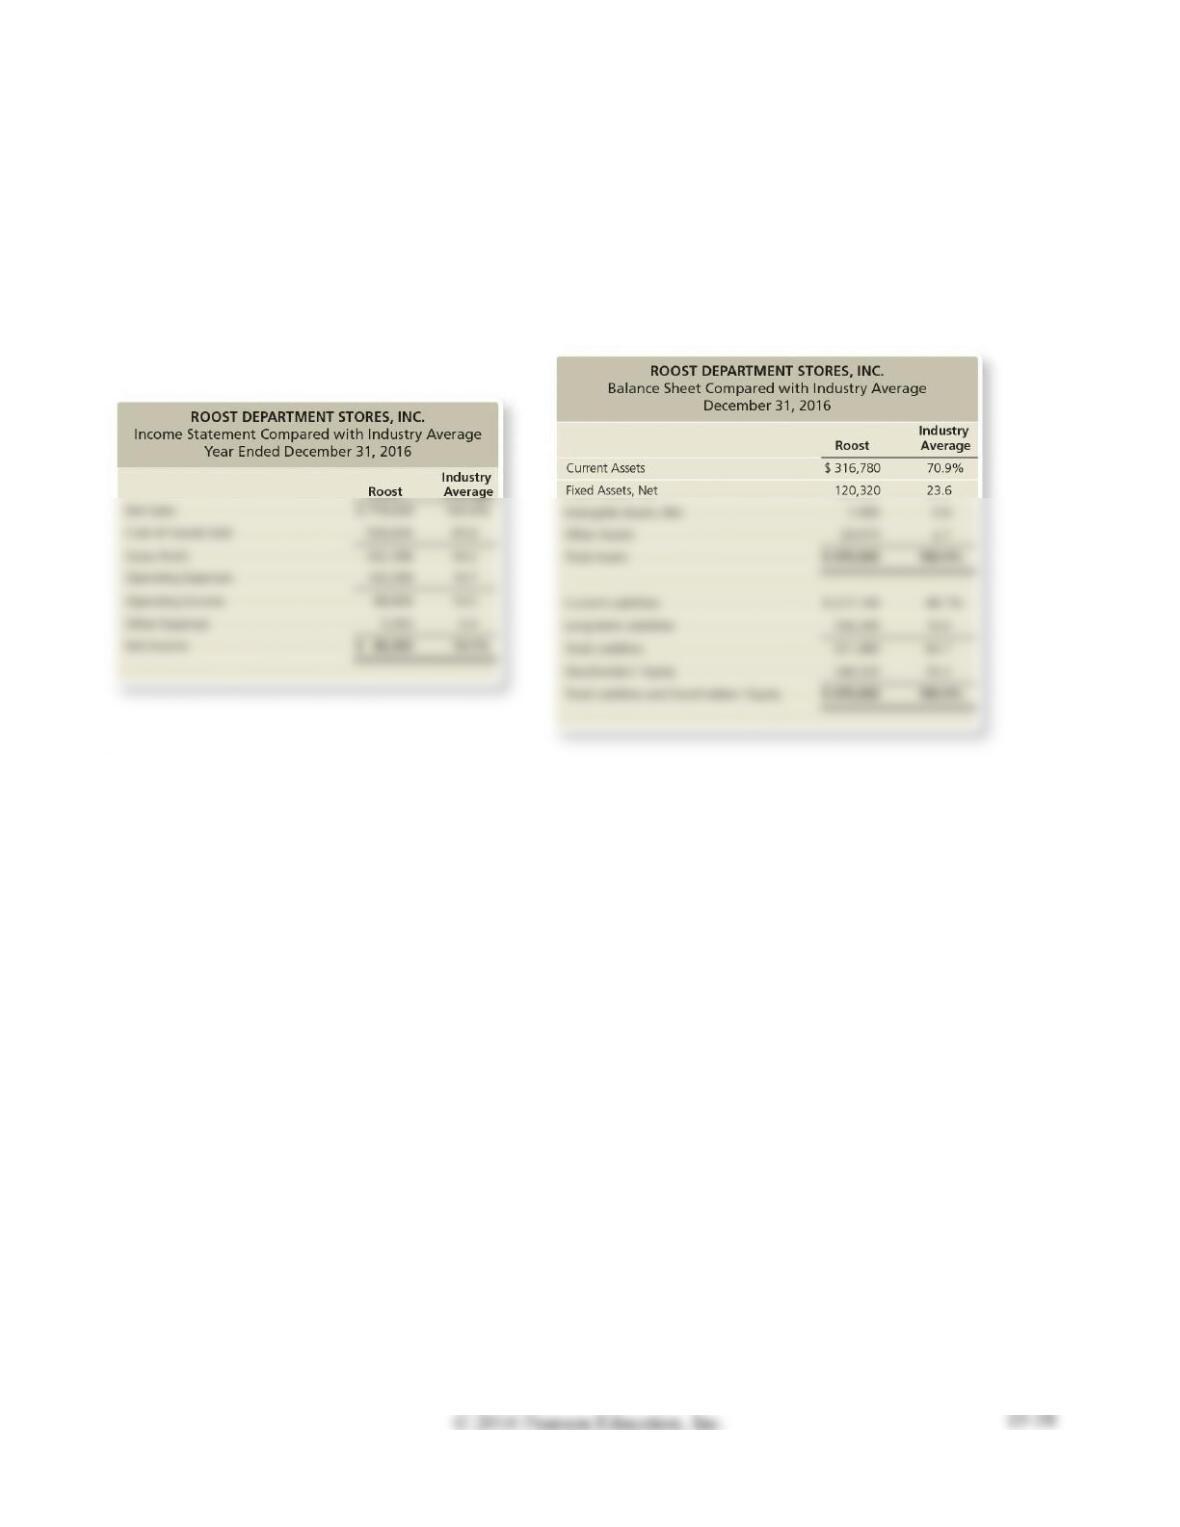
The Roost Department Stores, Inc. chief executive officer (CEO) has asked you to compare the
company’s profit performance and financial position with the averages for the industry. The CEO has
given you the company’s income statement and balance sheet as well as the industry average data for
retailers.
Requirements
1. Prepare a vertical analysis for Roost for both its income statement and balance sheet.
2. Compare the company’s profit performance and financial position with the average for the industry.
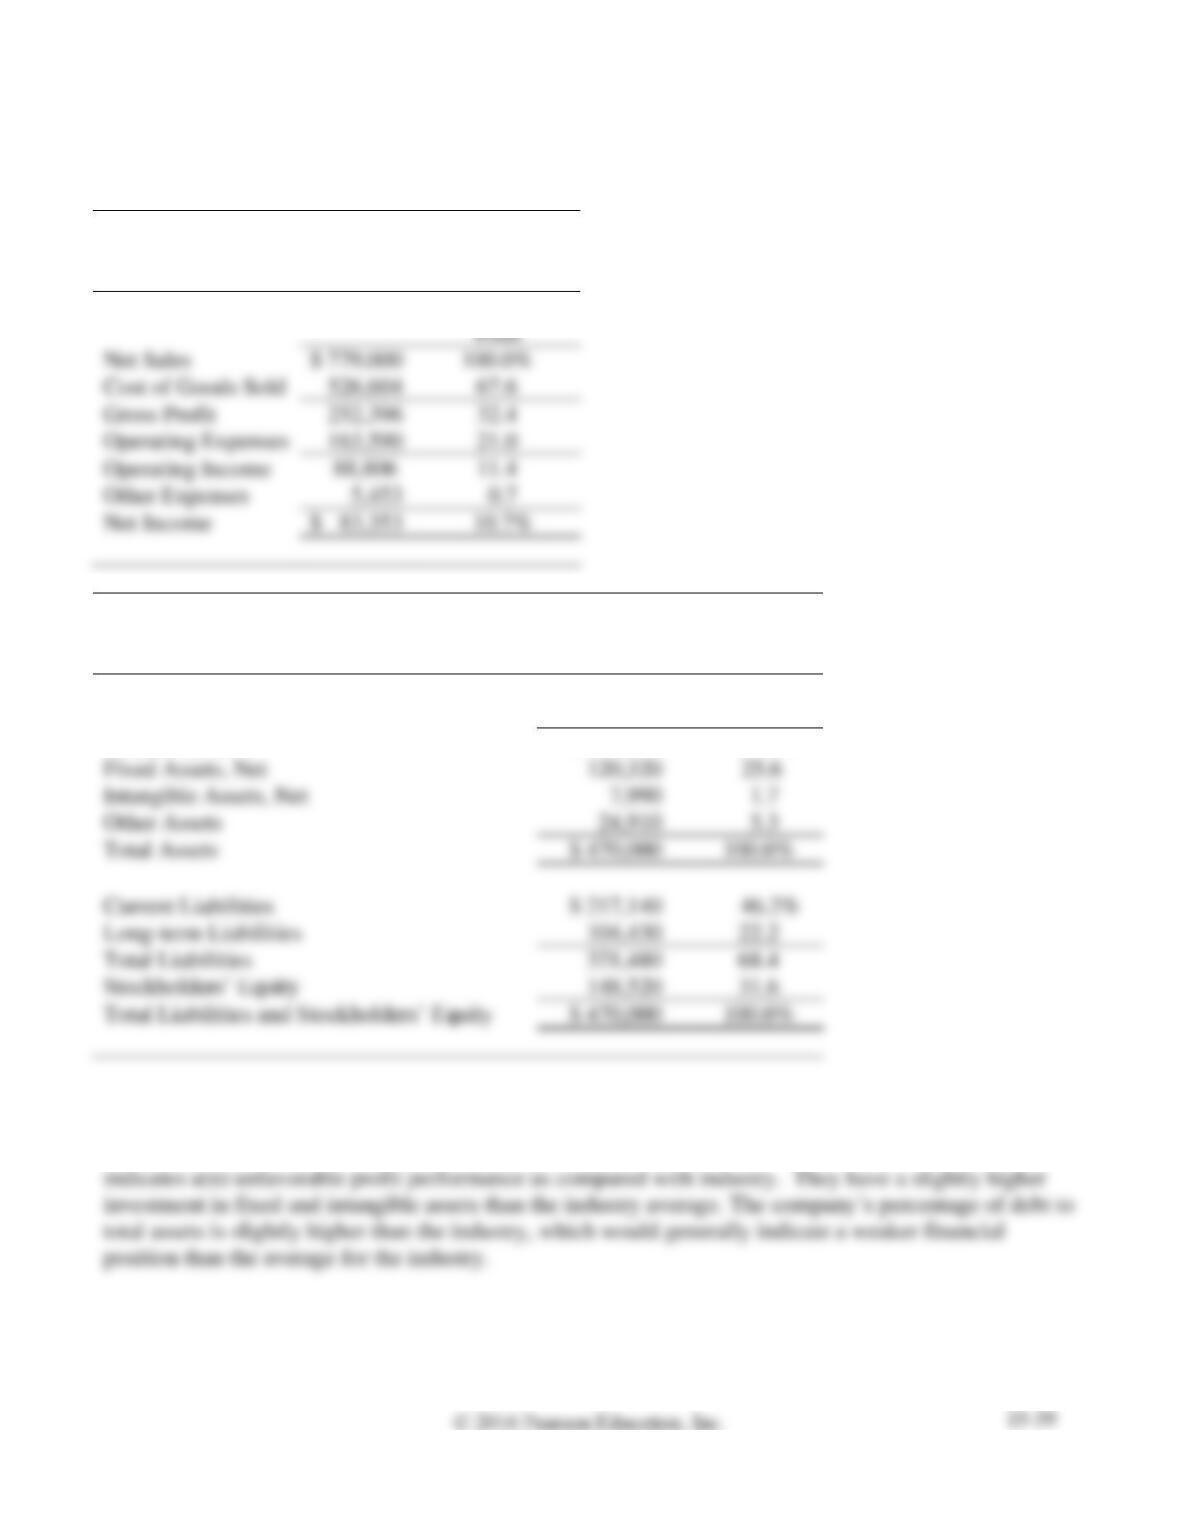
SOLUTION
Requirement 1
ROOST DEPARTMENT STORES, INC.
Income Statement
Year Ended December 31, 2016
Net Sales
$ 779,000
Cost of Goods Sold
526,604
Gross Profit
252,396
Operating Expenses
163,590
Operating Income
Other Expenses
5,453
Net Income
$ 83,353
Percent of
ROOST DEPARTMENT STORES, INC.
Balance Sheet
December 31, 2016
Percent of
Total
Current Assets
$ 316,780
67.4%
Fixed Assets, Net
120,320
Other Assets
24,910
Total Assets
$ 470,000
Current Liabilities
$ 217,140
46.2%
Long-term Liabilities
104,430
Total Liabilities
321,480
148,520
Total Liabilities and Stockholders’ Equity
$ 470,000
Requirement 2
Roost’s gross profit percentage and profit margin ratio are both less than the industry average, which
Note: Problem P15-28A must be completed before attempting Problem P15-29A.
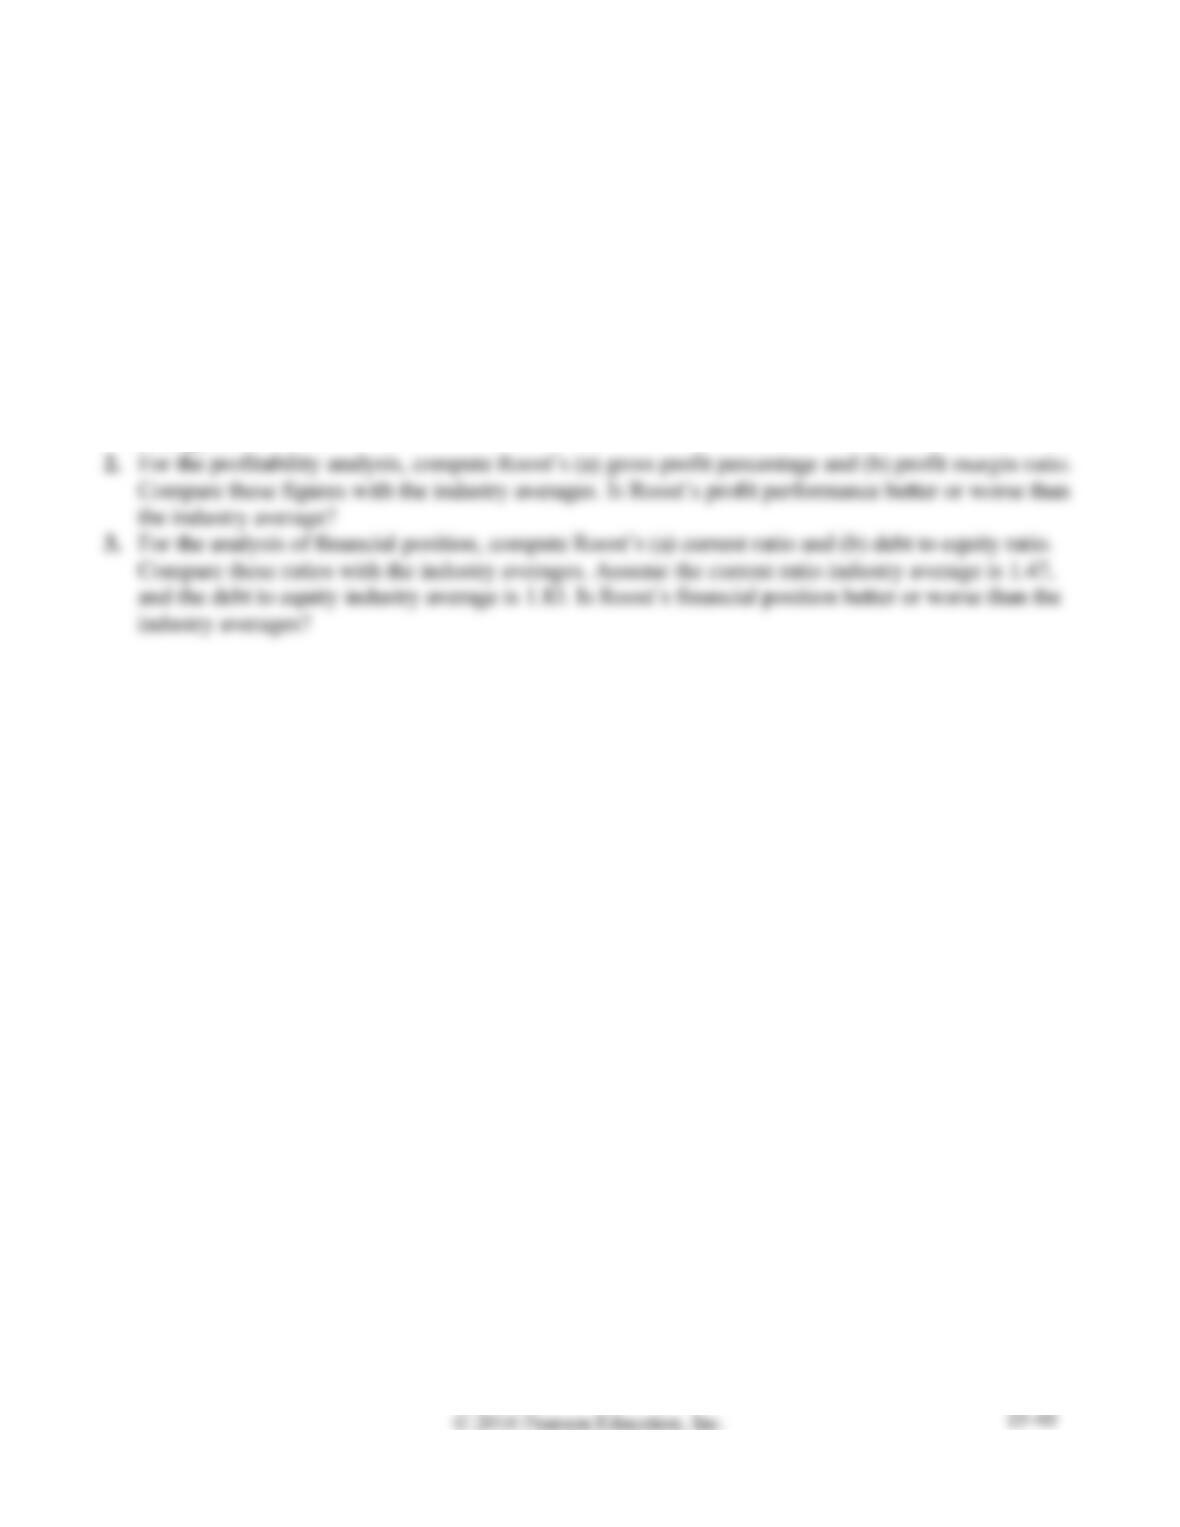
P15-29A Preparing common-size statements, analysis of profitability and financial position,
comparison with the industry, and using ratios to evaluate a company
Learning Objectives 3, 4
2. Gross Profit Percentage 32.4%
Consider the data for Roost Department Stores presented in Problem P15-28A.
Requirements
1. Prepare a common-size income statement and balance sheet for Roost. The first column of each
statement should present Roost’s common-size statement, and the second column, the industry
averages.