nearly 30% premium, Baxalta’s board rejected the offer claiming that it undervalued the firm and insisted that any
bid should contain a substantial amount of cash.
Shire countered that since 80.5% of its shares1 had been spun off from Baxter International in July 2015 that any
cash used in the Baxalta takeover bid could jeopardize the nontaxable status under U.S. law of the of the spin-off to
its shareholders.2 Despite its reservations, Shire revised the cash and stock bid to include $18 billion in cash plus
.1482 shares of its American Depository Shares3 for each outstanding common share of Baxalta in January 2016. At
closing, Shire shareholders will own 66% of the combined firms and Baxalta shareholders the remainder, which
appeared to preserve the tax status of the spinoff.4
Shire would be able to determine the implications of an all stock versus a cash and stock deal on the combined
firms’ earnings per share and credit rating due to the resulting increased leverage, as well as postclosing ownership
distribution. Such models provide estimates of synergy from potential cost savings or revenue enhancements needed
to determine if the proposed purchase premium could be earned back within a reasonable time period enabling the
firm to earn its cost of capital. Moreover, models could be used to display on a proforma (or adjusted) basis the
impact of tax savings resulting from Baxalta paying an effective U.S. tax rate of 23% versus 17% if incorporated in
Ireland. Models also are helpful in determining the impact of concessions demanded by the regulators to approve the
deal on the attractiveness of the deal.
Thus, from start to finish, financial models can play a key role in the M&A process. First by providing a baseline
financial projection reflecting the firm’s current strategy and later the ability to see how certain acquisitions and
investments could impact the baseline projection. In addition, once a target has been identified, financial models
1Baxter International retained a 19.5% interest in Shire following the spinoff.
2For spinoffs to be non-taxable to a firm’s shareholders, it must satisfy certain IRS rules. One requirement is the
parent’s shareholders must retain a continuing interest in both the parent and subsidiary (subject to a spinoff) for a
period of 4 years beginning 2 years prior to the spinoff and extending 2 years after the spinoff. The continuity of
Comcast Bids for Time Warner Cable—Evaluating Proposals and Counter Proposals
A sometimes bitter eight month long struggle between Charter Communications Inc. (Charter) and Time Warner
Cable Inc. (TWC) came to an end with the joint announcement by Comcast Corporation (Comcast) on February 14,
2014 that it had signed a merger agreement with TWC. The deal involved the merger of the largest and second
largest cable companies in terms of subscribers in the U.S. and faced major regulatory hurdles if it were to reach
completion. What follows is a discussion based on SEC filings of the dynamic ebb and flow of the negotiating
process involving at various times three different parties: TWC, Charter, and Comcast. Given the sophistication of
the participants, it is highly likely that financial models played a critical role in the underlying decision-making
process.
At the time of this writing, the combination of Comcast and Time Warner had not yet received regulatory
approval. The reasons for regulatory concerns are explained later in this case. However, regardless of the final
decision made by the regulators, the negotiation between these firms illustrates how financial models can be used in
M&A deal making.
The drama started on May 22, 2013 when Charter, the nation’s fourth largest cable operator backed by its largest
investor Liberty Media Corporation (Liberty) led by cable industry pioneer John Malone, approached TWC about
$132.50. All three were rejected by TWC as too low. TWC CEO Rob Marcus clearly set expectations by saying
publicly he wanted $160 per share.
While Liberty and Charter’s approaches to TWC had been public for months, Comcast’s interest did not become
public until November 2013. Comcast had entered the fray in mid-2013 when the firm’s CEO Brian Roberts queried
informally TWC’s then CEO Glenn Britt about the possibility of a merger. These discussions stalled over the size of
the purchase price and its composition.
Comcast had also been talking with Charter about possibly participating in Charter’s bid for TWC during late
2013, but those talks broke down on February 4, 2014 according to SEC filings. Within a few days Comcast’s board
authorized CEO Brian Roberts to offer $150 per share for all outstanding TWC shares to be paid in Comcast shares
on the condition there would be no breakup fee if regulatory approval could not be achieved. The pace of
discussions intensified with TWC responding on February 6, 2014 saying it would agree to a deal without a breakup
fee as long as Comcast offered a price of $160 per share. The final all-stock deal was signed a week later based on
Comcast’s closing share price on February 12, 2014 of $158.82.
The catalyst fueling the acceleration in discussions may have been the news on February 2, 2013 that Charter had
nominated in advance of the TWC spring 2014 annual meeting a group of thirteen candidates to replace the entire
The final agreement reflected the intensity of the last minute discussions with neither side getting all it wanted.
Comcast paid far more than what it had hoped but did avoid a breakup fee and having to use cash as a portion of the
purchase price. The final purchase price was very close to what TWC’s CEO Rob Marcus had stated publicly as the
firm’s asking price. However, TWC did not get the cash and stock deal it had sought earlier and incurred the risk
that the firm would not be compensated for the substantial expenses incurred during the negotiations with the
various parties if regulatory approval could not be achieved.
Valued at $45.2 billion, the deal represented an 18% premium to TWC’s closing price the day before the deal
was announced and would result in TWC shareholders owning 23% of the combined firms. As part of the
announcement, Comcast said it would expand its share repurchase program to $10 billion to begin at the end of 2014
to offset some of the potential dilutive effects of issuing new Comcast shares in exchange for TWC shares.

Strategically, the deal made sense for Comcast. Combining TWC and Comcast is expected to generate $1.5
billion in ongoing annual cost savings, with one-half occurring in the first year. The deal is expected to be accretive
(increasing EPS) for Comcast shareholders and reflected an attractive premium for TWC shareholders. However,
TWC’s stock jumped 7.4% on the announcement to $145.36, while Comcast fell 3% to $53.59. Why did TWC’s
share price rise by less than one-half of the implied premium and Comcast’s share price plummet? Because
investors were skeptical the deal would be approved by the U.S. Justice Department and the Federal
Communications Commission.
Comcast stated publicly that they would sell three million of TWC’s eleven million subscribers to other cable
companies such as Cox and Charter and would agree to other reasonable conditions to lessen these concerns. By
selling these TWC subscribers, Comcast would keep its market share nationwide below 30%, a figure that had
proven acceptable to regulators in two previous acquisitions of cable firms by Comcast in 2002 and 2006.
After eight months of exchanging proposals and counter-proposals with various parties, the final deal came
together in less than two weeks. The dynamic nature of the negotiations required the decision makers to evaluate
their options quickly to bring the negotiations to a satisfactory conclusion. Financial models often serve as an
important tool in such situations.
Using proforma financial statements to illustrate what the combined firms would look like, Comcast was able to
determine the implications of an all stock versus a cash and stock deal on the combined firms’ earnings per share
and credit rating. Such models provided estimates of potential synergy needed to determine if the proposed purchase
premium could be earned back within a reasonable time period enabling the firm to earn its cost of capital. TWC
could have used models to evaluate the attractiveness of various offers made by Comcast and Charter and to provide
their own estimate of potential synergy, allowing it to argue that TWC shareholders should be compensated at least
for the amount of additional value they are contributing to the merged companies. Models also are helpful in
determining the impact of concessions demanded by the regulators on the attractiveness of the deal. Thus, from start
to finish, financial models can play a key role in the M&A process.
Mars Buys Wrigley in One Sweet Deal
Under considerable profit pressure from escalating commodity prices and eroding market share, Wrigley
Corporation, a U.S.-based leader in gum and confectionery products, faced increasing competition from Cadbury
Schweppes in the U.S. gum market. Wrigley had been losing market share to Cadbury since 2006. Mars
Corporation, a privately owned candy company with annual global sales of $22 billion, sensed an opportunity to
achieve sales, marketing, and distribution synergies by acquiring Wrigley Corporation.
On April 28, 2008, Mars announced that it had reached an agreement to merge with Wrigley Corporation for $23
billion in cash. Under the terms of the agreement, which were unanimously approved by the boards of the two firms,
shareholders of Wrigley would receive $80 in cash for each share of common stock outstanding, a 28 percent
premium to Wrigley’s closing share price of $62.45 on the announcement date. The merged firms in 2008 would
As of the September 28, 2008 closing date, Wrigley became a separate stand-alone subsidiary of Mars, with $5.4
billion in sales. The deal is expected to help Wrigley augment its sales, marketing, and distribution capabilities. To
provide more focus to Mars’s brands in an effort to stimulate growth, Mars would in time transfer its global
nonchocolate confectionery sugar brands to Wrigley. Bill Wrigley Jr., who controls 37 percent of the firm’s
outstanding shares, remained the executive chairman of Wrigley. The Wrigley management team also remained in
place after closing.
The combined companies would have substantial brand recognition and product diversity in six growth
categories: chocolate, nonchocolate confectionary, gum, food, drinks, and pet care products. While there is little
product overlap between the two firms, there is considerable geographic overlap. Mars is located in 100 countries,
while Wrigley relies heavily on independent distributors in its growing international distribution network.
Furthermore, the two firms have extensive sales forces, often covering the same set of customers.
While mergers among competitors are not unusual, the deal’s highly leveraged financial structure is atypical of
transactions of this type. Almost 90 percent of the purchase price would be financed through borrowed funds, with
the remainder financed largely by a third-party equity investor. Mars’s upfront costs would consist of paying for
closing costs from its cash balances in excess of its operating needs. The debt financing for the transaction would
consist of $11 billion and $5.5 billion provided by J.P. Morgan Chase and Goldman Sachs, respectively. An
additional $4.4 billion in subordinated debt would come from Warren Buffet’s investment company, Berkshire
Hathaway, a nontraditional source of high-yield financing. Historically, such financing would have been provided
by investment banks or hedge funds and subsequently repackaged into securities and sold to long-term investors,
such as pension funds, insurance companies, and foreign investors. However, the meltdown in the global credit
markets in 2008 forced investment banks and hedge funds to withdraw from the high-yield market in an effort to
strengthen their balance sheets. Berkshire Hathaway completed the financing of the purchase price by providing
$2.1 billion in equity financing for a 9.1 percent ownership stake in Wrigley.
Discussion Questions:
1. Why was market share in the confectionery business an important factor in Mars’ decision to acquire
Wrigley?
Answer: Firm’s having substantial market relative to their next largest competitor are likely to have lower
cost structures due to economies of scale and purchasing, as well as lower sales, general and administrative
2. It what way did the acquisition of Wrigley’s represent a strategic blow to Cadbury?
Answer: Not only did this acquisition topple Cadbury from its number one position in the confectionery
3. How might the additional product and geographic diversity achieved by combining Mars and Wrigley
benefit the combined firms?
Answer: The broader array of products from chocolate to gum to pet care could insulate the firm to
4. Speculate as to the potential sources of synergy associated with the deal. Based on this speculation what
additional information would you want to know in order to determine the potential value of this synergy?
Answer: The product offerings of the two firms show little duplication. Therefore, there is significant
potential for cross-selling each firm’s products into the other’s customers. This would require training the
sales forces in each firm’s product offering. The cost of this training would need to be estimated and
deducted from cash flows generated by cross-selling.
5. Given the terms of the agreement, Wrigley shareholders would own what percent of the combined
companies? Explain your answer
Answer: Wrigley shareholders would not own any portion of the combined firms, as the purchase was an
Tribune Company Acquires the Times Mirror Corporation
in a Tale of Corporate Intrigue
Background: Oh, What Tangled Webs We Weave. .
.
CEO Mark Willes had reason to be optimistic about the future. Operating profits had grown at a double-digit rate,
and earnings per share had grown at a 55% annual rate between 1995 to 1999. Many shareholders appeared to be
satisfied. However, some were not. Although pleased with the improvement in profitability, they were concerned
about the long-term growth prospects of the firm. Reflecting this disenchantment, Times Mirror’s largest
shareholder, the Chandler family, was contemplating the sale of the company and along with it the crown jewel Los
Angeles Times. It had been assumed for years that the Chandler family trusts made a sale of Times Mirror out of the
question. The Chandler’s super voting stock (i.e., stock with multiple voting rights) allowed them to exert a
disproportionate influence on corporate decisions. The Chandler Trusts controlled more than two-thirds of voting
shares, although the family owned only about 28% of the total shares of the outstanding stock.
In May 1999 the Tribune Chairman John Madigan contacted Willes and made an offer for the company, but Willes,
with the help of his then-chief financial officer (CFO), Thomas Unterman, made it clear to Madigan that the
company was not for sale. What Willes did not realize was that Unterman soon would be serving in a dual role as
CFO and financial adviser to the Chandlers and that he would eventually step down from his position at Times
Mirror to work directly for the family. In his dual role, he worked without Willes’ knowledge to structure the deal
with the Tribune.
Following months of secret negotiations, the Chicago-based Tribune Company and the Times Mirror Corporation
announced a merger of the two companies in a cash and stock deal valued at approximately $7.2 billion, including
$5.7 billion in equity and $1.5 billion in assumed debt. The transaction, announced March 13, 2000, created a media
giant that has national reach and a major presence in 18 of the nation’s top 30 U.S. markets, including New York,
Los Angeles, and Chicago. The combined company has 22 television stations, four radio stations, and 11 daily
Transaction Terms: Tribune Shareholders Get Choice of Cash or Stock
The Tribune agreed to buy 48% of the outstanding Times Mirror stock, about 28 million shares, through a tender
offer. After completion of the tender offer, each remaining Times Mirror share would be exchanged for 2.5 shares of
Tribune stock. Under the terms of the transaction, Times Mirror shareholders could elect to receive $95 in cash or
2.5 shares of Tribune common stock in exchange for each share of Times Mirror stock. Holders of 27.2 million
shares of Times Mirror stock elected to receive Tribune stock, whereas holders of 10.6 million elected to receive
cash. Because the amount of cash offered in the merger was limited and the cash election was oversubscribed, Times
Mirror shareholders electing to receive cash actually received a combination of cash and stock on a pro rata basis
(Table 1).
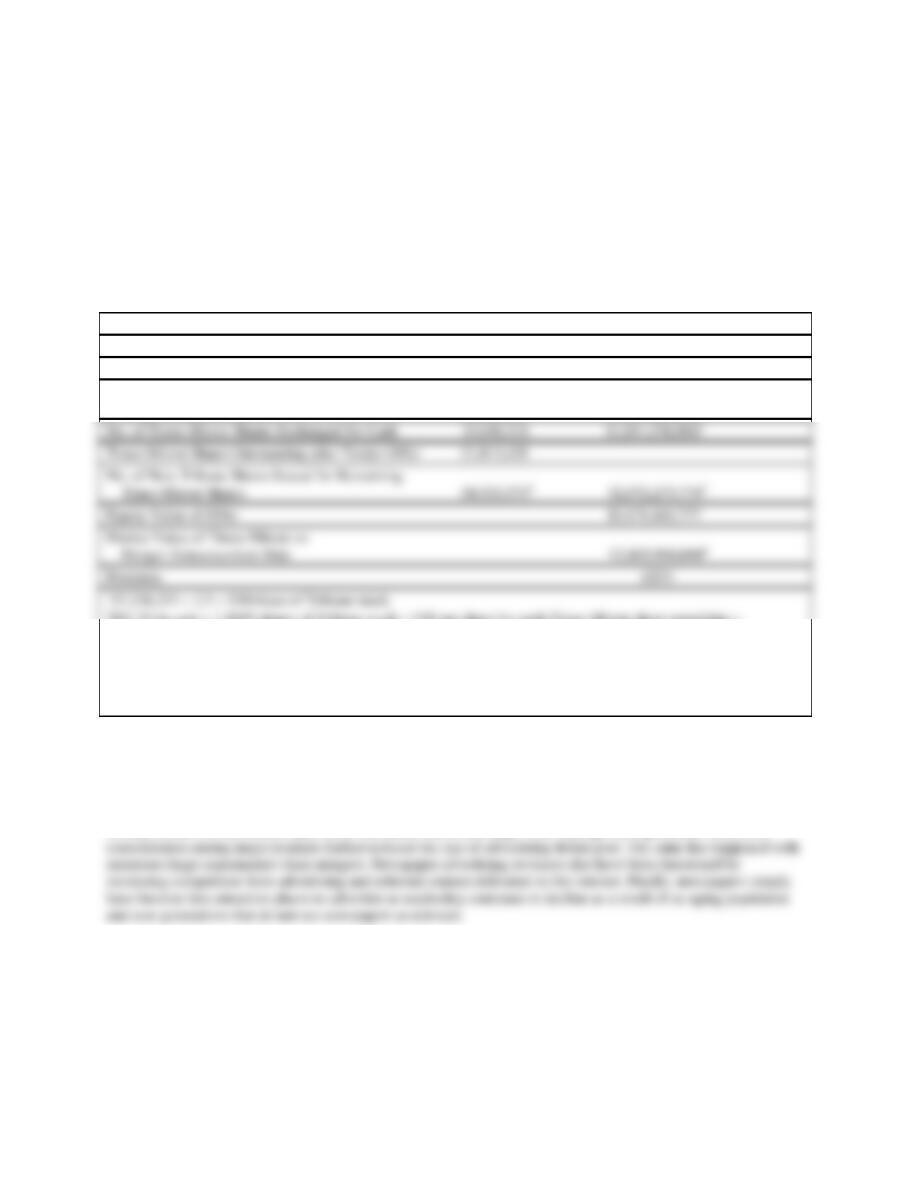
Table 1. Times Mirror Transaction Terms
As of June 12, 2000 Transaction Value
Times Mirror Shares Outstanding @ 3/13/00 59,700,000
No. of Times Mirror Shares Exchanged for 2.3
Shares of Tribune Stock 27,238,253 $2,587,634,0351
10,648,318.
3Equals 2.5 shares 21,813,429 $38 per Tribune share.
4Times Mirror share price on announcement date of $47 times 59,700,000.
5The total number of new Tribute shares issued equals 27,238,318 2.5 + 10,648,318 2.5 + 54,533, 573 or
137,537,013.
Newspaper Advertising Revenues Continue to Shrink
Most U.S. newspapers are mired in the mature or declining phase of their product life cycle. For the past half-
century, newspapers have watched their portion of the advertising market shrink because of increased competition
from radio and television. By the early 1990s, all major media began taking a significant hit in their advertising
revenue streams as businesses discovered that direct mail could target their message more precisely. Moreover,
Times Mirror: A Largely Traditional Business Model
As essentially a traditional newspaper, Times Mirror publishes five metropolitan and two suburban daily
newspapers, a variety of magazines, and professional information such as flight maps for commercial airline pilots.
The Los Angeles Times, a southern California institution founded in 1881, is Times Mirror’s largest holding and
operates some two dozen expensive foreign news bureaus—more than any other newspaper in the country. The Los
Equity Value of Offer $5,671,446,777
Premium 102%
Angeles Times has more than 1200 Los Angeles Times reporters and editors around the world (CNNfn, March 13,
2000).
Tribune Company Profile: The Face of New Media?
Unlike the Times Mirror, Tribune has built its strategy around four business groups: broadcasting, publishing,
education, and interactive. The Tribune is also an equity investor in America Online and other leading internet
companies, underscoring the company’s commitment to new-media technologies. Applying leading edge new-media
Anticipated Synergy
Cost Savings: Opportunities Abound
Cost savings are expected because of the closing of selected foreign and domestic news bureaus, a reduction in the
cost of newsprint through greater volume purchases, the closing of the Times Mirror corporate headquarters, and
elimination of corporate staff. Such savings are expected to reach $200 million per year (Table 2).
Revenue: Great Potential . . . But Is It Achievable?
The combined companies will have a major presence in 18 of the nation’s top 30 U.S. advertising markets, including
New York, Los Angeles, and Chicago. The combined companies provide unprecedented opportunities for
advertisers to reach major market consumers in any media form—broadcast, newspapers, or interactive. In addition,
Integration Challenges: Cultural Warfare?
Based on the current, traditional culture found at the Los Angeles Times and other Times Mirror properties,
integration following the merger was likely to be slow and painful. Concerns among journalists about spreading
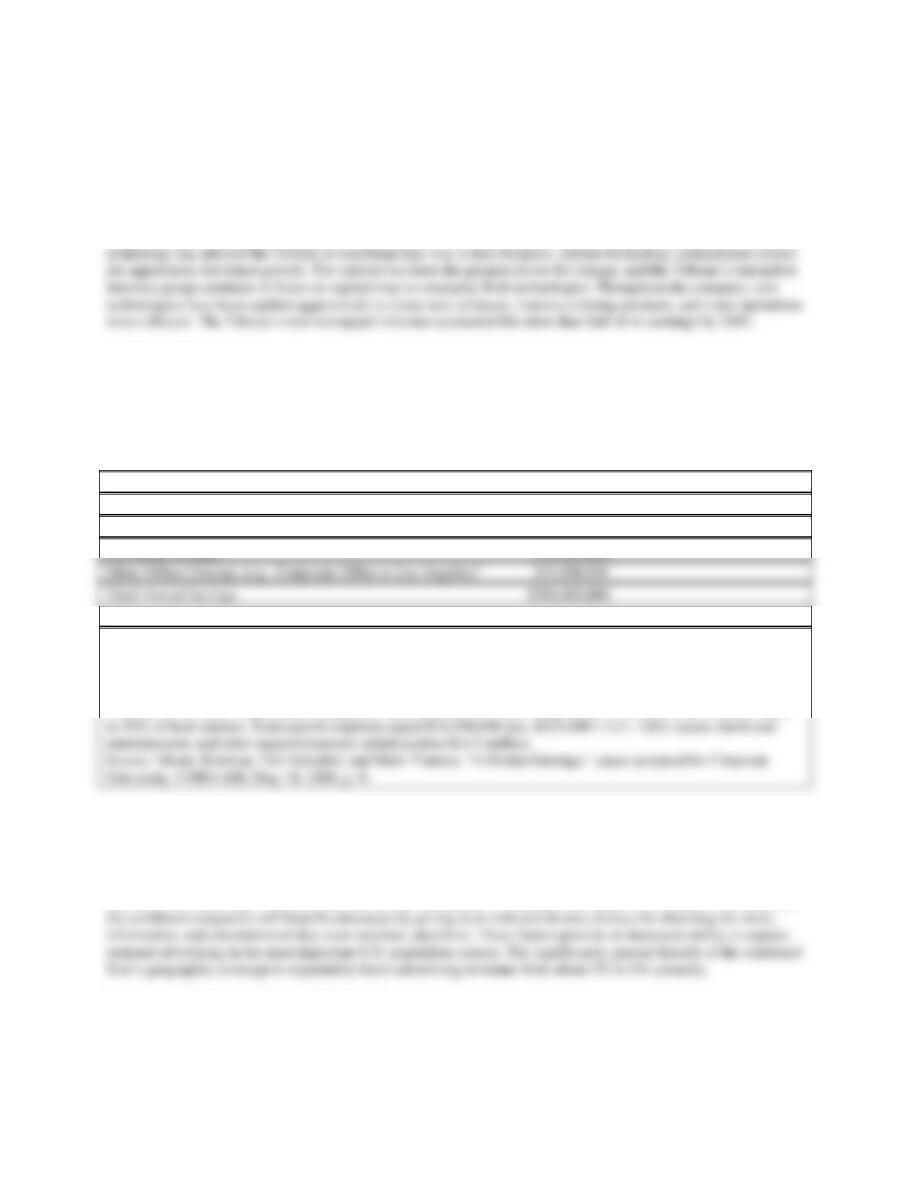
Table 2. Annual Merger-Related Cost Savings
Source of Value Annual Savings
Bureau Closings1 $73,000,000
Newsprint Savings2 $93,000,000
Other Office Closings (e.g., Corporate Office in Los Angeles)3 $34,000,000
Total Annual Savings $200,000,000
1Assumes Tribune will close overlapping bureaus in United States (9) and most of the Times Mirror’s foreign
bureaus (21 abroad).
2As a result of bulk purchasing and more favorable terms with different suppliers, 15% of the newsprint expense of
the combined companies is expected to be saved.
3Layoffs of 120 L.A. Times Mirror Corporate Office personnel at an average salary of $125,000 and benefits equal
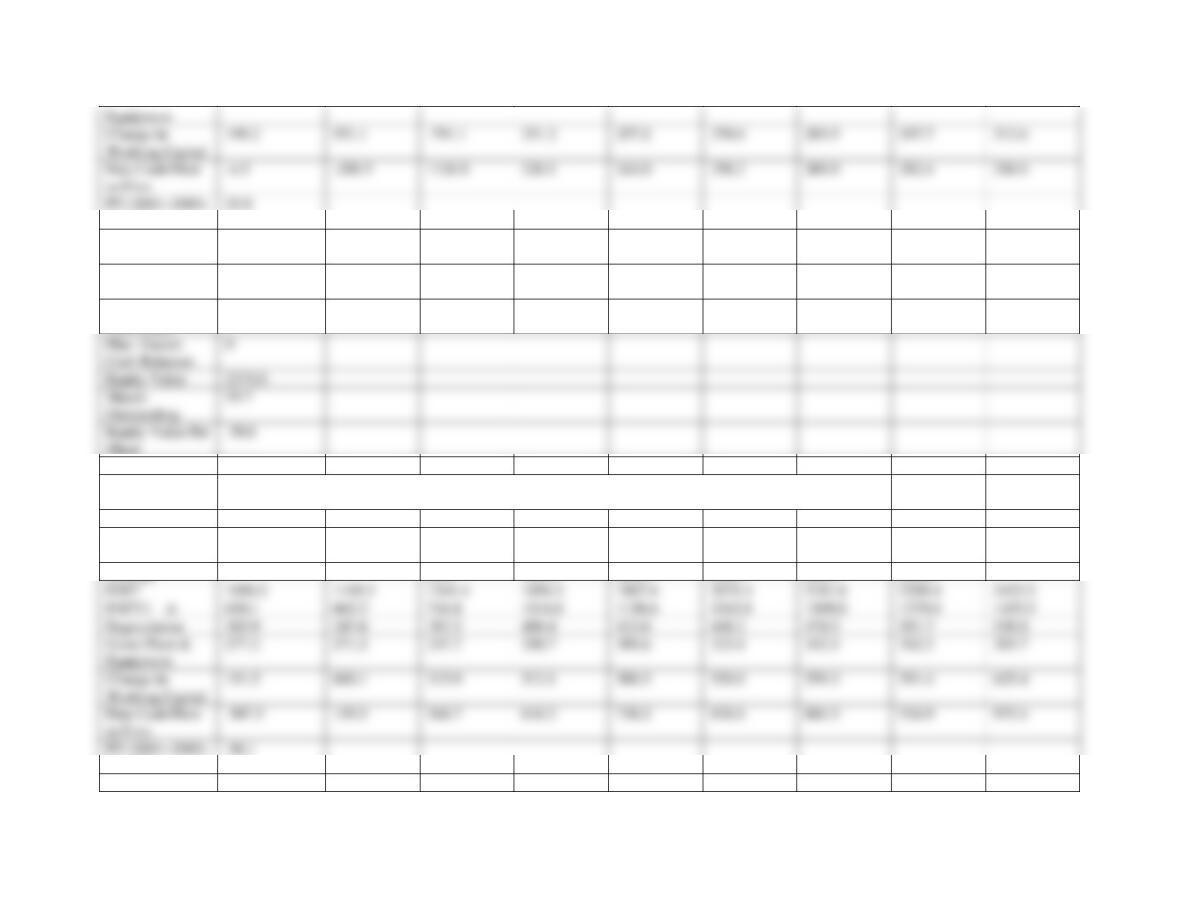
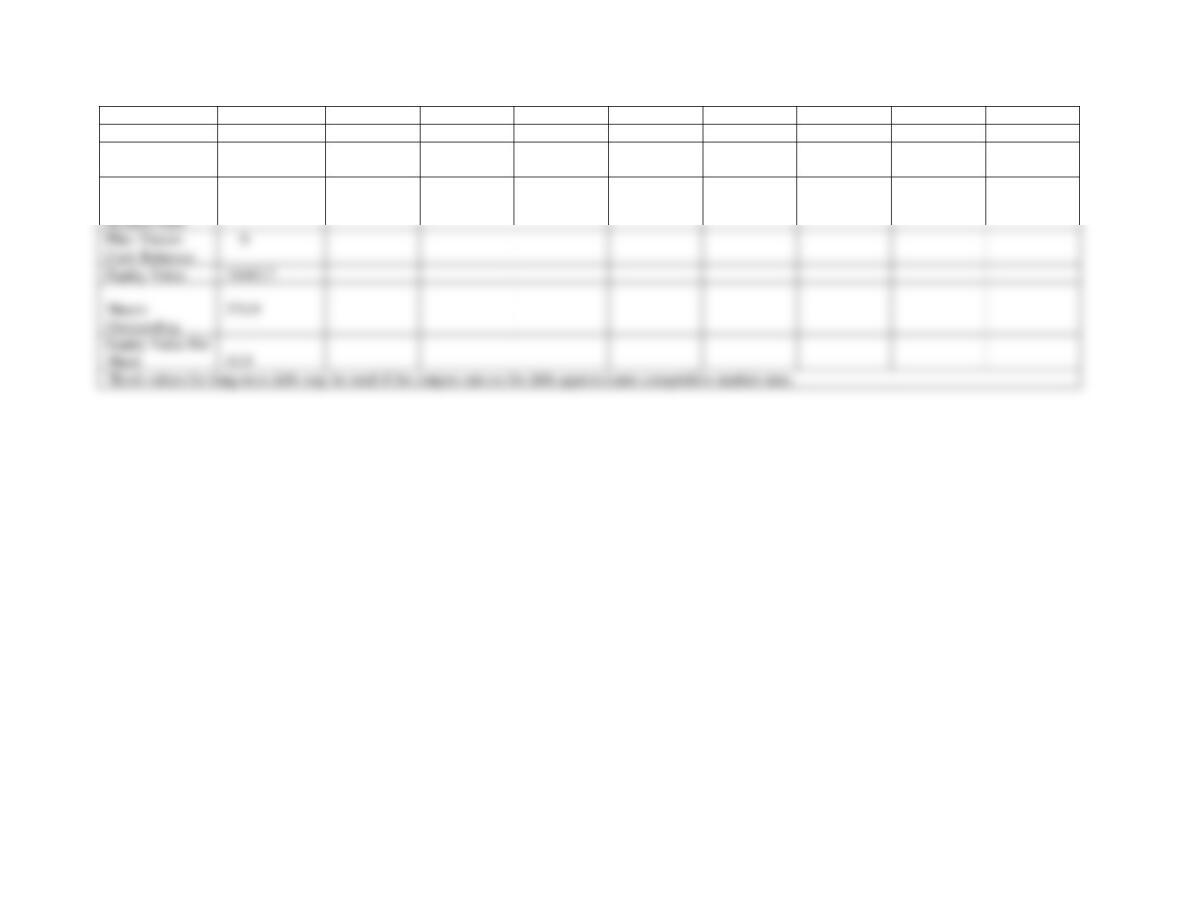
Financial Analysis
The present values of the Tribune, Times Mirror, and the combined firms are $8.5 billion, $2.4 billion, and $16.5
billion, respectively; the estimated present value of synergy is $5.6 billion (Table 3). This assumes that pretax cost
savings are phased in as follows: $25 million in 2000, $100 million in 2001, and $200 million thereafter. The cost
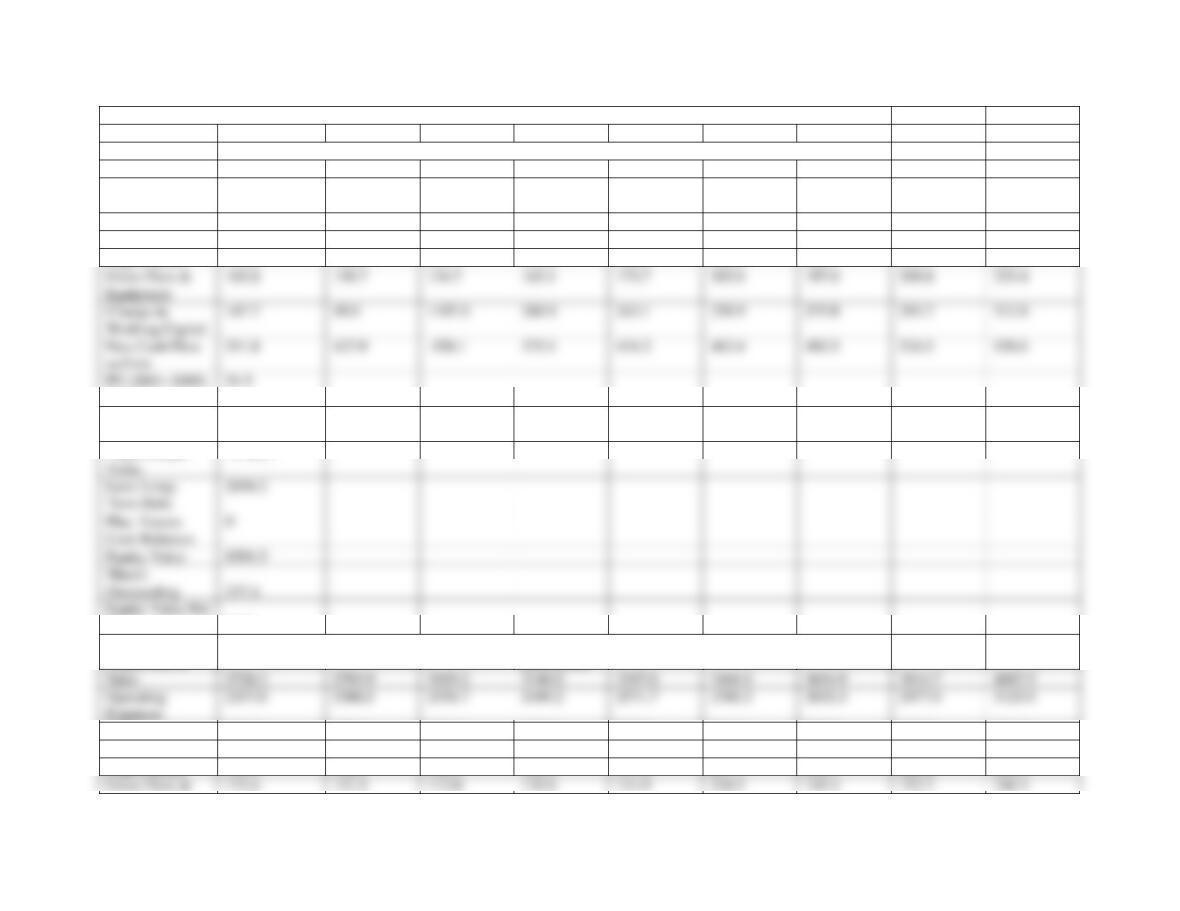
Table 3. Merger Evaluation
1997
1998
1999
2000
2001
2002
2003
2004
2005
Tribune
($ Millions)
Sales
2891.5
2980.9
3221.9
3261.5
3473.5
3699.3
3939.7
4195.8
4468.5
Operating
Expenses
2232.5
2279.0
2451.0
2283.1
2431.4
2589.5
2757.8
2937.1
3128.0
EBIT
559.0
701.9
770.9
978.5
1042.0
1109.8
1181.9
1258.7
1340.6
EBIT(1 – t)
395.4
421.1
462.5
587.1
625.2
665.9
709.2
755.2
804.3
Depreciation
172.5
195.5
221.1
212.0
225.8
240.5
256.1
272.7
290.5
@8.5
PV (Terminal
Value) @8.5
11144.2
Less: Long-
Term Debt
2694.2
Plus: Excess
Cash Balances
0
Equity Value
8501.5
Shares
Outstanding
237.4
Equity Value Per
Total Present
11195.7
Share
35.81
Times Mirror
($Millions)
Sales
2728.2
2783.9
3029.2
3140.0
3297.0
3461.9
3634.9
3816.7
4007.5
Operating
Expenses
2337.0
2380.5
2558.7
2449.2
2571.7
2700.2
2835.3
2977.0
3125.9
EBIT
391.2
403.4
470.5
690.8
725.3
761.6
799.7
839.7
881.7
EBIT(1 – t)
234.7
242.0
282.3
414.5
435.2
457.0
479.8
503.8
529.0
Depreciation
133.4
152.1
166.4
188.4
197.8
207.7
218.1
229.0
240.5
Gross Plant &
Equipment
103.8
139.7
134.7
163.1
173.7
185.0
197.0
209.8
223.4
Change in
Working Capital
147.7
49.0
1107.0
260.9
243.1
258.9
275.8
293.7
312.8
Free Cash Flow
to Firm
511.8
427.9
-558.1
375.1
434.2
462.4
492.5
524.5
558.6
PV (2001–2005)
51.5
@ 9.5%
PV (Terminal
Value) @ 9.5%
3937.2
Total Present
Value
3963.0
Less: Long-
Term Debt1
1562.2
Plus: Excess
Cash Balances
0
Equity Value
2375.0
Shares
Outstanding
59.7
Equity Value Per
Share
39.8
Combined
Firms
($Millions)
Sales
5619.7
5764.8
6251.1
6401.5
6770.5
7161.1
7574.7
8012.5
8476.1
Operating
Expenses
4569.5
4659.5
5009.7
4732.3
5003.1
5289.7
5593.1
5914.1
6253.8
Synergy
25.0
100.0
200.0
200.0
200.0
200.0
EBIT
1050.2
1105.3
1241.4
1694.3
1867.4
2071.4
2181.6
2298.4
2422.2
EBIT(1 – t)
630.1
663.2
744.8
1016.6
1120.4
1242.8
1309.0
1379.0
1453.3
Depreciation
305.9
347.6
387.5
400.4
423.6
448.2
474.2
501.7
530.9
Gross Plant &
Equipment
277.2
271.2
247.7
288.7
305.6
323.4
342.4
362.5
383.7
Change in
Working Capital
151.5
600.1
315.9
512.1
500.3
529.0
559.3
591.4
625.4
Free Cash Flow
to Firm
507.3
139.5
568.7
616.2
738.2
838.6
881.5
926.9
975.1
@ 9.5%
PV (Terminal
22805.6
Equipment
Free Cash Flow
to Firm
-4.5
-288.5
1126.8
226.1
244.0
256.2
269.0
282.4
296.6
PV (2001–2005)
25.8
Value) @ 9.5%
Total PV
22893.8
Less: Long-
Term Debt
4256.4
Less:
Acquisition-
2193.7
Plus: Excess
Cash Balances
Equity Value
16443.7
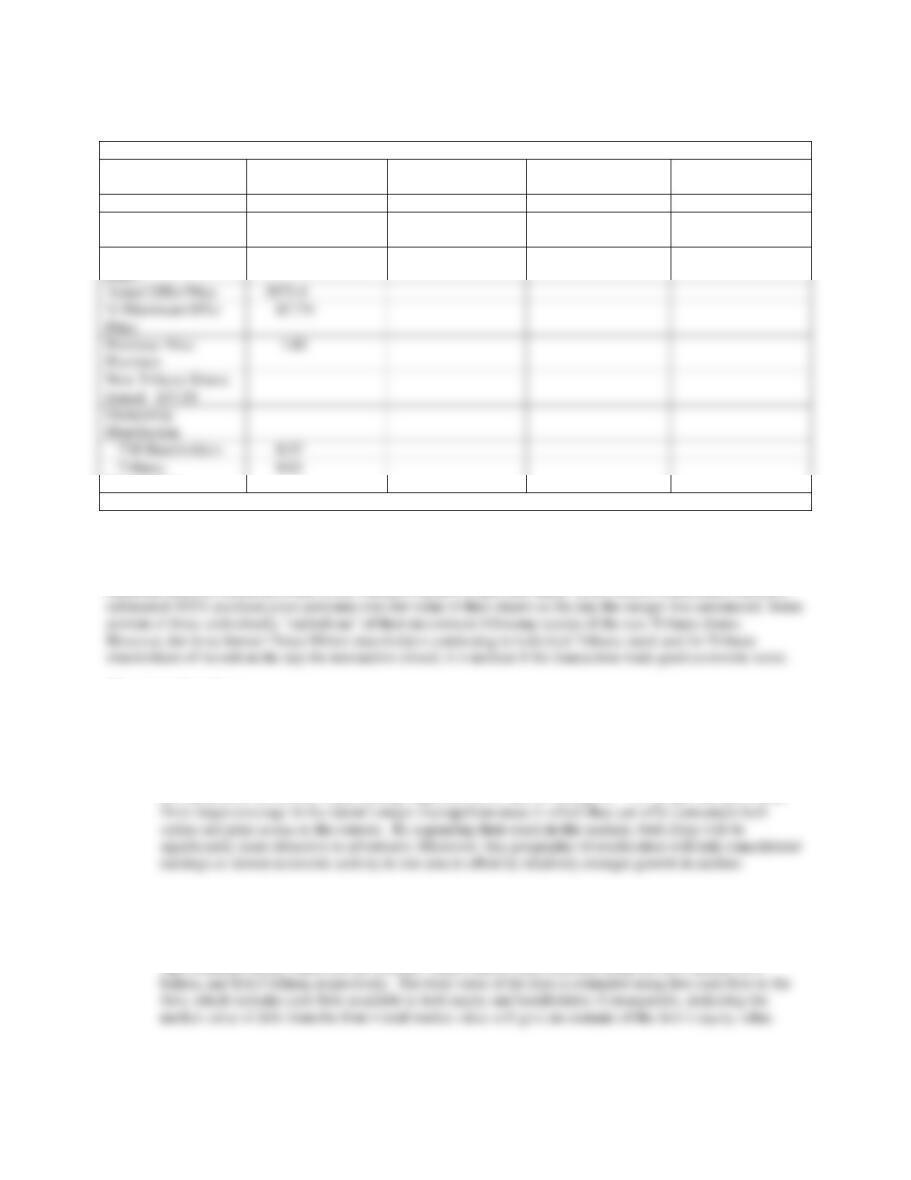
Table 4. Offer Price Determination
Tribune
Times Mirror
Combined Incl.
Synergy
Value of Synergy
Equity Valuations
8501.5
2375.0
16443.7
5567.3
Minimum Offer
Price1
2805.9
Maximum Offer
Price
8373.2
Shareholders
1Market value of Times Mirror on the merger announcement date.
Epilogue
Only time will tell if actual returns to shareholders in the combined Tribune and Times Mirror company exceed the
expected financial returns provided in the valuation models in this case study. Times Mirror shareholders earned a
Discussion Questions:
1. In your judgment, did it make good strategic sense to combine the Tribune and Times Mirror
corporations? Why? / Why not?
Yes, the combination of the two firms offers substantial cost savings in closing overlapping news bureaus
and substantial economies in purchasing major cost items such as newsprint. The merger also gives both
2. Using the Merger Evaluation table given in the case, determine the estimated equity values of Tribune,
Times Mirror and the combined firms. Why is long-term debt deducted from the total present value
estimates in order to obtain equity value?
The estimated equity values for the Tribune, Times Mirror, and combined firms are $8.5 billion, $2.4
Actual Offer Price
5671.4
% Maximum Offer
Price
67.7%
Purchase Price
Premium
1.02
New Tribune Shares
Issued 137.50
Ownership
Distribution
TM Shareholders
0.37
Tribune
0.63
3. Despite the merger having closed in mid-2000, the full effects of synergy are not expected until 2002.
Why? What factors could account for the delay?
The full effects of synergy are not realized immediately because of bureau leases that must expire or be
bought out, severance expenses that offset savings that result from layoffs, management inertia, employee
4. The estimated equity value for the Times Mirror Corporation on the day the merger was announced was
about $2.8 billion. Moreover, as shown in the offer price evaluation table, the equity value estimated using
discounted cash flow analysis is given has $2.4 billion. Why is the minimum offer price shown as $2.8
billion rather than the lower $2.4 billion figure? How is the maximum offer price determined in the Offer
Price Evaluation Table? How much of the estimated synergy value generated by combining the two
businesses is being transferred to the Times Mirror shareholders? Why?
The minimum offer price is the market value of the firm, because it is unlikely that Times Mirror
5. Does the Times Mirror-Tribune Corporation merger create value? If so, how much? What percentage of
this value goes to Times Mirror shareholders and what percentage to Tribune shareholders? Why?
The merger creates $4.6 billion in value between the pre-merger and post-merger valuations, of which 37%
Ford Acquires Volvo’s Passenger Car Operations
This case illustrates how the dynamically changing worldwide automotive market is spurring a move toward
consolidation among automotive manufacturers. The Volvo financials used in the valuation are for illustration
only— they include revenue and costs for all of the firm’s product lines. For purposes of exposition, we shall
assume that Ford’s acquisition strategy with respect to Volvo was to acquire all of Volvo’s operations and later to
divest all but the passenger car and possibly the truck operations. Note that synergy in this business case is
determined by valuing projected cash flows generated by combining the Ford and Volvo businesses rather than by
subtracting the standalone values for the Ford and Volvo passenger car operations from their combined value
including the effects of synergy. This was done because of the difficulty in obtaining sufficient data on the Ford
passenger car operations.
Background
By the late 1990s, excess global automotive production capacity totaled 20 million vehicles, and three-fourths of the
auto manufacturers worldwide were losing money. Consumers continued to demand more technological
innovations, while expecting to pay lower prices. Continuing mandates from regulators for new, cleaner engines and
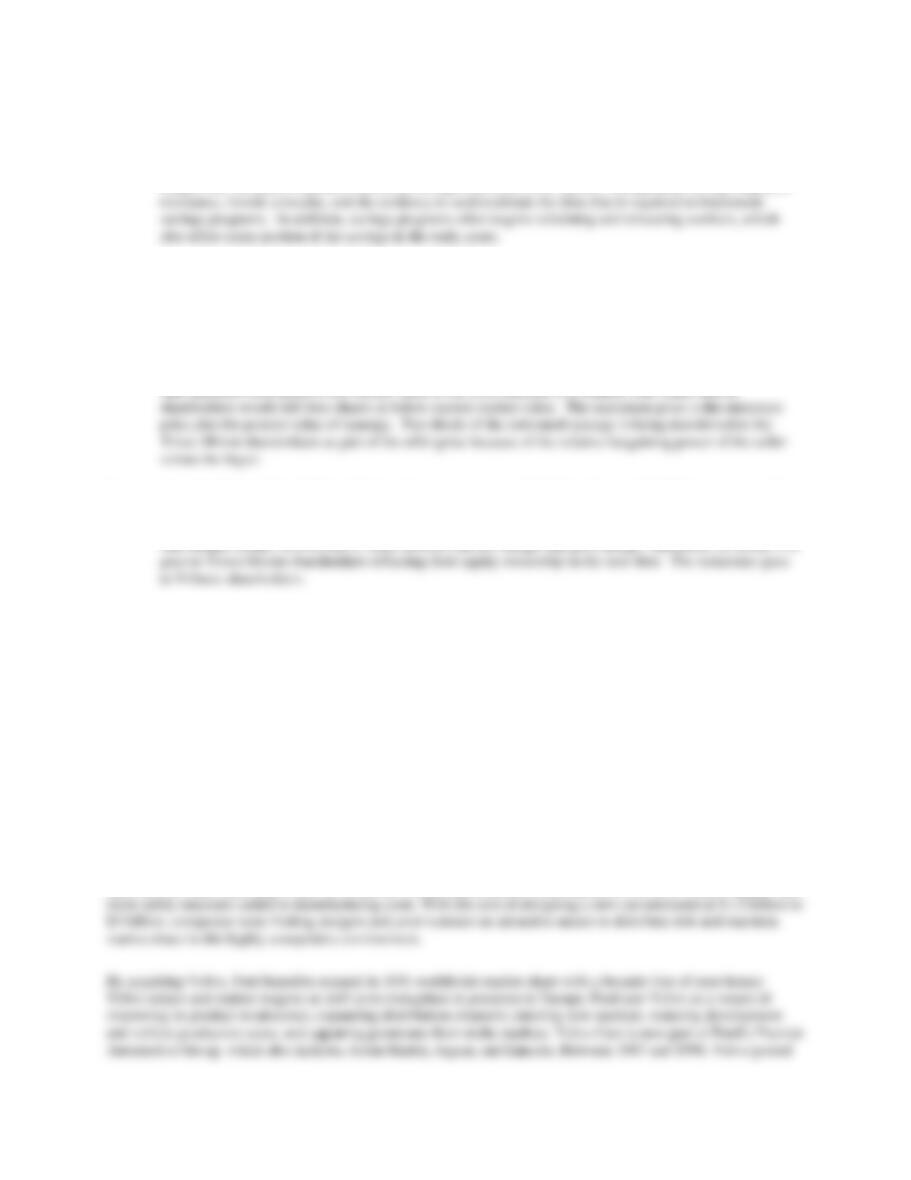
Historical and Projected Data
The initial review of Volvo’s historical data suggests that cash flow is highly volatile. However, by removing
nonrecurring events, it is apparent that Volvo’s cash flow is steadily trending downward from its high in 1997. Table
9-10 displays a common-sized, normalized income statement, balance sheet, and cash-flow statement for Volvo,
including both the historical period from 1993 through 1999 and a forecast period from 2000 through 2004.
Although Volvo has managed to stabilize its cost of goods sold as a percentage of net sales, operating expenses as a
<A>Table 9-10. Volvo Common-Size Normalized Income Statement, Balance Sheet, and Cash-Flow Statement (Percentage of Net Sales)<A>
1993 1994 1995 1996 1997 1998 1999 2000 2001 2002 2003 2004
Income Statement
Net Sales 1.000 1.000 1.000 1.000 1.000 1.000 1.000 1.000 1.000 1.000 1.000 1.000
Cost of Goods Sold .772 .738 .749 .777 .757 .757 .757 .757 .757 .757 .757 .757
Operation Expense .167 .101 .120 .077 .119 .133 .132 .131 .129 .128 .127 .126
Depreciation .034 .033 .033 .034 .029 .038 .038 .039 .040 .040 .041 .042
Balance Sheet
Current Assets .632 .503 .444 .524 .497 .500 .500 .500 .500 .500 .500 .500
Current Liabilities .596 .400 .283 .298 .304 .350 .350 .350 .350 .350 .350 .350
Working Capital .036 .103 .161 .226 .192 .150 .150 .150 .150 .150 .150 .150
Selected Valuation Cash-Flow Items
EBIT (1 – t) .022 .150 .126 .126 .105 .093 .094 .094 .095 .095 .096 .096
Capital Expenditures .031 .027 .033 .053 .054 .061 .069 .078 .088 .099 .112 .126
Determining the Initial Offer Price
Volvo’s estimated value on a standalone basis is $15 billion. The present value of anticipated synergy is $1.1 billion, suggesting that
the purchase price for Volvo should lie within a range of $15 million to about $16 billion. Although potential synergies appear to be
substantial, savings due to synergies will be phased in gradually between 2000 and 2004. The absence of other current bidders for the
entire company and Volvo’s urgent need to fund future capital expenditures in the passenger car business enabled Ford to set the
initial offer price at the lower end of the range. Thus, the initial offer price could be conservatively set at about $15.25 billion,
Determining the Appropriate Financing Structure
Ford had $23 billion in cash and marketable securities on hand at the end of 1998 (Naughton, 1999). This amount of cash is well in
excess of its normal cash operating requirements. The opportunity cost associated with this excess cash is equal to Ford’s cost of
capital, which is estimated to be 11.5%—about three times the prevailing interest on short-term marketable securities at that time. By
reinvesting some portion of these excess balances to acquire Volvo, Ford would be adding to shareholder value, because the expected
Epilogue
Seven months after the megamerger between Chrysler and Daimler-Benz in 1998, Ford Motor Company announced that it was
acquiring only Volvo’s passenger-car operations. Ford acquired Volvo’s passenger car operations on March 29, 1999, for $6.45
Discussion Questions and Answers:
1. What is the purpose of the common-size financial statements developed for Volvo (see Table 8-8 in the textbook)? What
insights does this table provide about the historical trend in Volvo’s historical performance? Based on past performance,
how realistic do you think the projections are for 2000-2004?
Answer: The common size financial statements for Volvo reveal the historical relationship between key operating variables
and sales. They revealed the deterioration in the firm’s long-term operating efficiency and the subsequent decline in
operating margins and cash flow. The deterioration in cash flow underscored the inability of the firm to fund future cash
2. Ford anticipates substantial synergies from acquiring Volvo. What are these potential synergies? As a consultant hired to
value Volvo, what additional information would you need to estimate the value of potential synergy from each of these areas?
Answer: By acquiring Volvo, Ford hoped to expand its global market share with a broader product offering as well as to
strengthen its presence in Europe. Specifically, Ford saw Volvo as a means of improving its product weakness in luxury
sedans and station wagons, gaining access to new distribution channels and markets, reducing development and vehicle
35
3. How was the initial offer price determined according to this case study? Do you find the logic underlying the initial offer
price compelling? Explain your answer.
Answer: The initial offer price for Volvo was determined by adding about one-fourth of the projected net synergy generated
4. What was the composition of the purchase price? Why was this composition selected according to this case study?
Answer: The proposed purchase price was an all-cash offer. At the time, Ford’s cash balances were substantially in excess