Chapter 15
Financial Statement Analysis
Solutions to Questions
15-1 Horizontal analysis examines how a
particular item on a financial statement such as
sales or cost of goods sold behaves over time.
15-2 By looking at trends, an analyst hopes
to get some idea of whether a situation is
improving, remaining the same, or deteriorating.
15-3 Price-earnings ratios reflect investors’
expectations concerning future earnings. The
higher the price-earnings ratio, the greater the
15-4 A rapidly growing tech company would
probably have many opportunities to make
investments at a rate of return higher than
15-5 The dividend yield is the dividend per
share divided by the market price per share. The
other source of return on an investment in stock
is increases in market value.
15-6 Financial leverage results from
borrowing funds at an interest rate that differs
from the rate of return on assets acquired using
15-7 If the company experiences big
variations in net cash flows from operations,
stockholders might be pleased that the company
has no debt. In hard times, interest payments
15-8 The market value of a share of common
stock often exceeds the book value per share.
15-9 A 2 to 1 current ratio might not be
adequate for several reasons. First, the
difficult to collect.
Exercise 15-1 (15 minutes)
1.
This Year
Last Year
Sales ……………………………………………….
100.0%
100.0%
Cost of goods sold ………………………………
63.2%
60.0%
Gross margin …………………………………….
Selling and administrative expenses:
Total selling and administrative expenses …
31.6%
32.1%
Interest expense ………………………………..
Net income before taxes ………………………
2. The company’s major problem seems to be the increase in cost of goods
sold, which increased from 60.0% of sales last year to 63.2% of sales
this year. This suggests that the company is not passing the increases in
Exercise 15-2 (30 minutes)
1. Calculation of the gross margin percentage:
Gross margin
2. Calculation of the earnings per share:
Net income – Preferred dividends
Earnings per share =
Average number of common
shares outstanding
$1,980 – $60
= = $3.20 per share
600 shares
3. Calculation of the price-earnings ratio:
Market price per share
$3.20
4. Calculation of the dividend payout ratio:
Dividends per share
Dividend payout ratio =
Earnings per share
$0.75
= = 23.4%
$3.20
Exercise 15-2 (continued)
6. Calculation of the return on total assets:
( )
Net income +
7. Calculation of the return on common stockholders’ equity:
Beginning balance, stockholders’ equity (a) ..
$39,610
Ending balance, stockholders’ equity (b) ……
41,080
Average stockholders’ equity [(a) + (b)]/2 …
40,345
Average preferred stock …………………………
1,000
Average common stockholders’ equity ………
$39,345
8. Calculation of the book value per share:
Total stockholders’ equity – Preferred stock
Book value per share = Number of common shares outstanding
Exercise 15-3 (30 minutes)
1. Calculation of working capital:
2. Calculation of the current ratio:
Current assets
Current ratio = Current liabilities
$22,680
= = 1.17
$19,400
3. Calculation of the acid-test ratio:
Cash + Marketable securities
4. Calculation of accounts receivable turnover:
Sales on account
Accounts receivable =
turnover Average accounts receivable balance
$66,000
= = 8.5
($6,500 + $9,000)/2
Exercise 15-3 (continued)
6. Calculation of inventory turnover:
Cost of goods sold
Inventory turnover = Average inventory balance
$43,000
= = 3.8
($10,600 + $12,000)/2
Exercise 15-4 (15 minutes)
1. Calculation of the times interest earned ratio:
Earnings before interest
2. Calculation of the debt-to-equity ratio:
Exercise 15-5 (15 minutes)
1.
Current assets
($80,000 + $460,000 + $750,000 + $10,000) ….
$1,300,000
Current liabilities ($1,300,000 ÷ 2.5) ………………..
520,000
Working capital ……………………………………………
$ 780,000
3. a. Working capital would not be affected by a $100,000 payment on
accounts payable:
Current assets ($1,300,000 – $100,000) ….
$1,200,000
Current liabilities ($520,000 – $100,000) ….
420,000
Working capital …………………………………..
$ 780,000
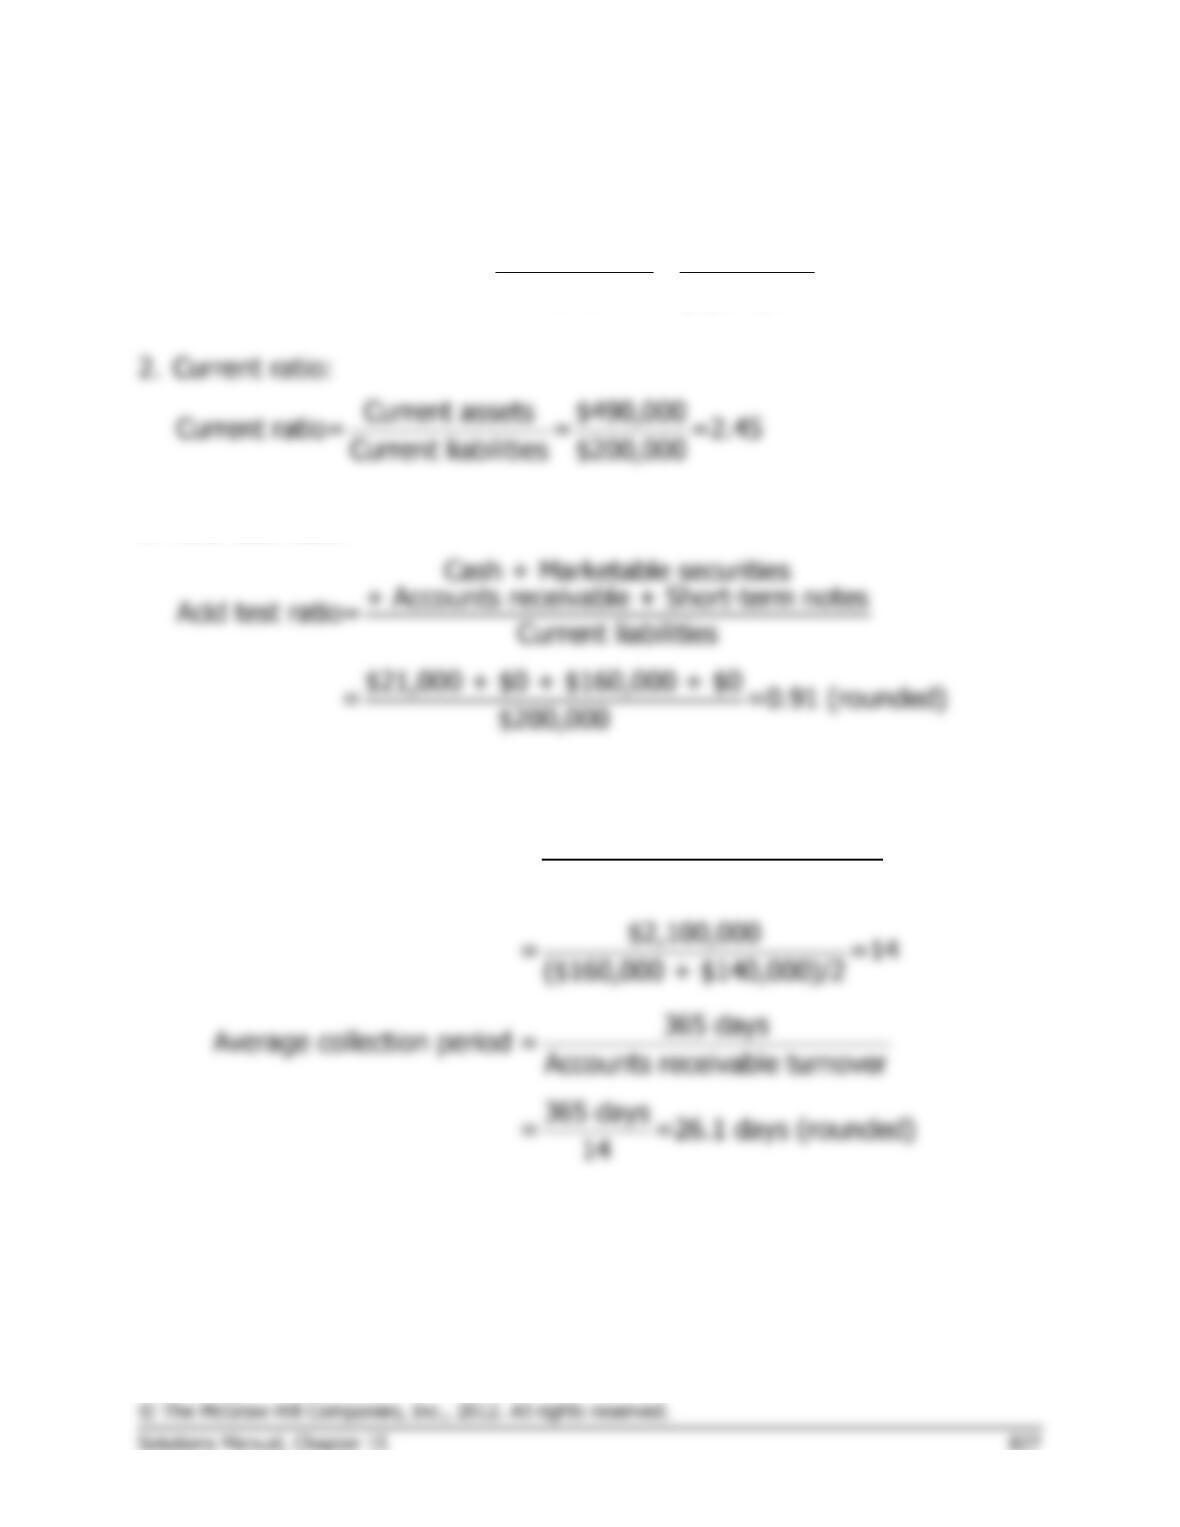
Exercise 15-6 (30 minutes)
1. Gross margin percentage:
Gross margin $840,000
Gross margin percentage= = =40%
Sales $2,100,000
3. Acid-test ratio:
4. Average collection period:
Sales on account
Accounts receivable turnover= Average accounts receivable
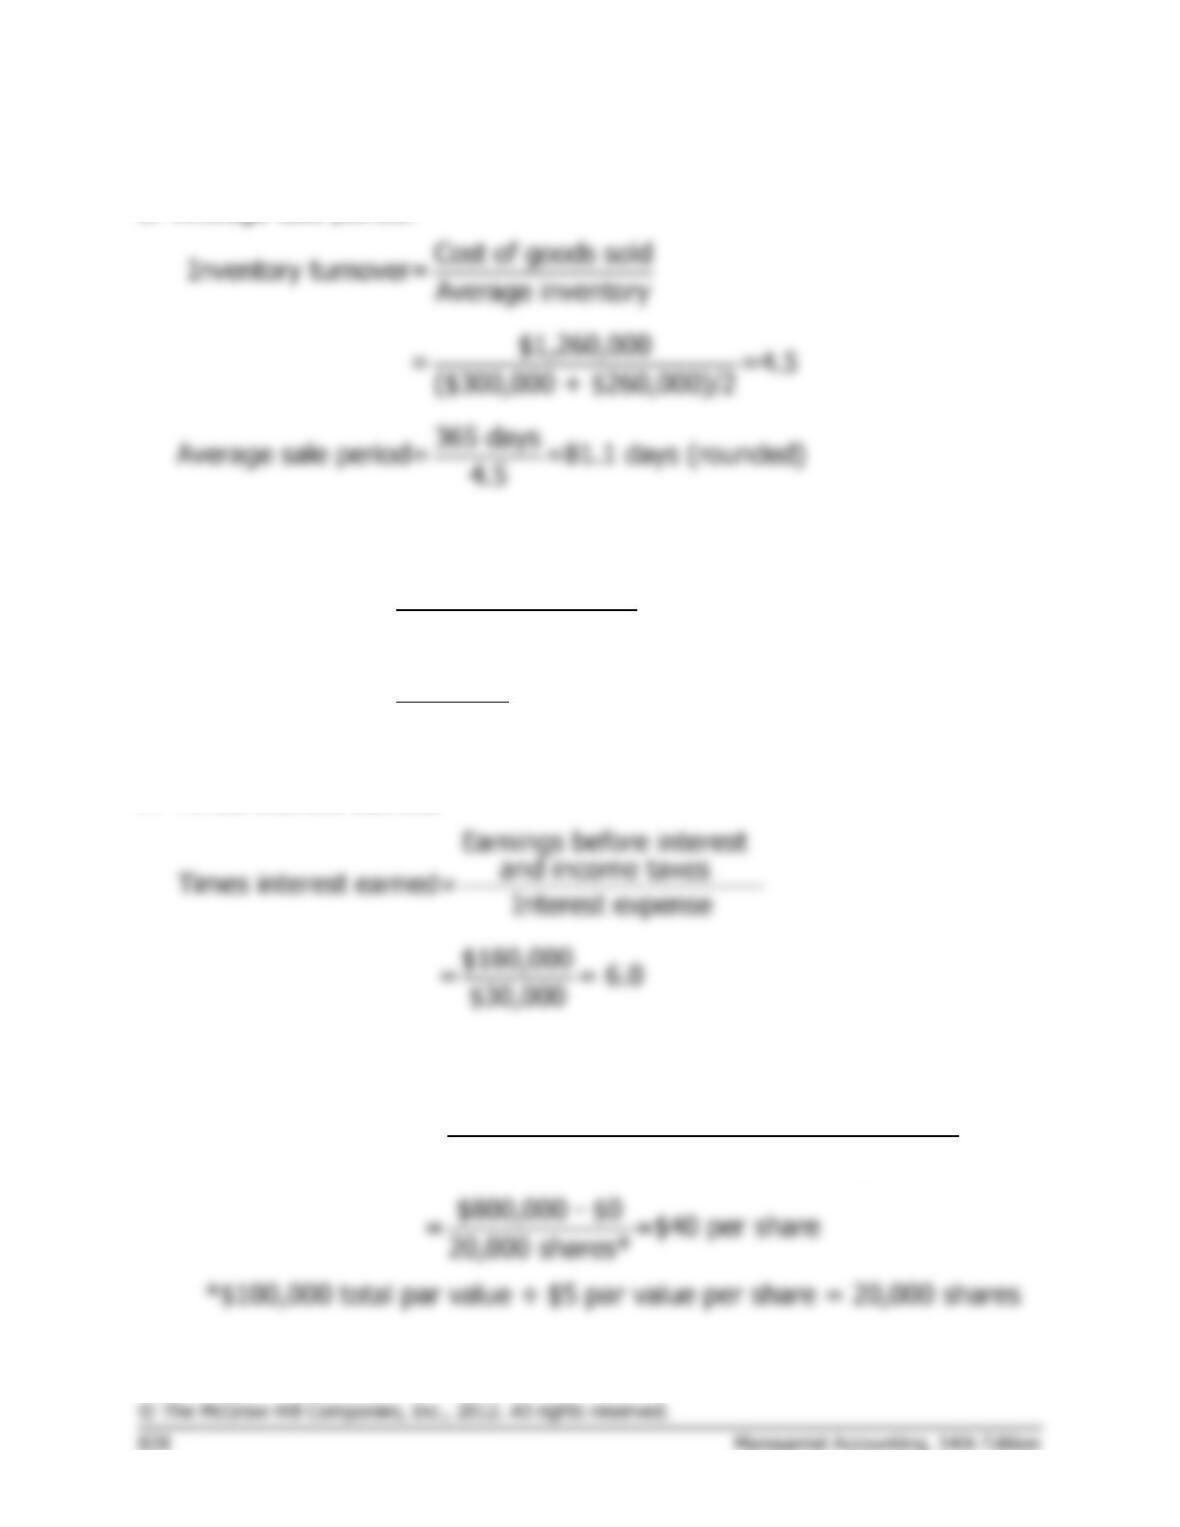
Exercise 15-6 (continued)
5. Average sale period:
6. Debt–to-equity ratio:
Total liabilities
Debt-equity ratio= Stockholders’ equity
$500,000
= =0.63 (rounded)
$800,000
7. Times interest earned:
8. Book value per share:
Total stockholders’ equity – Preferred stock
Book value per share= Common shares outstanding
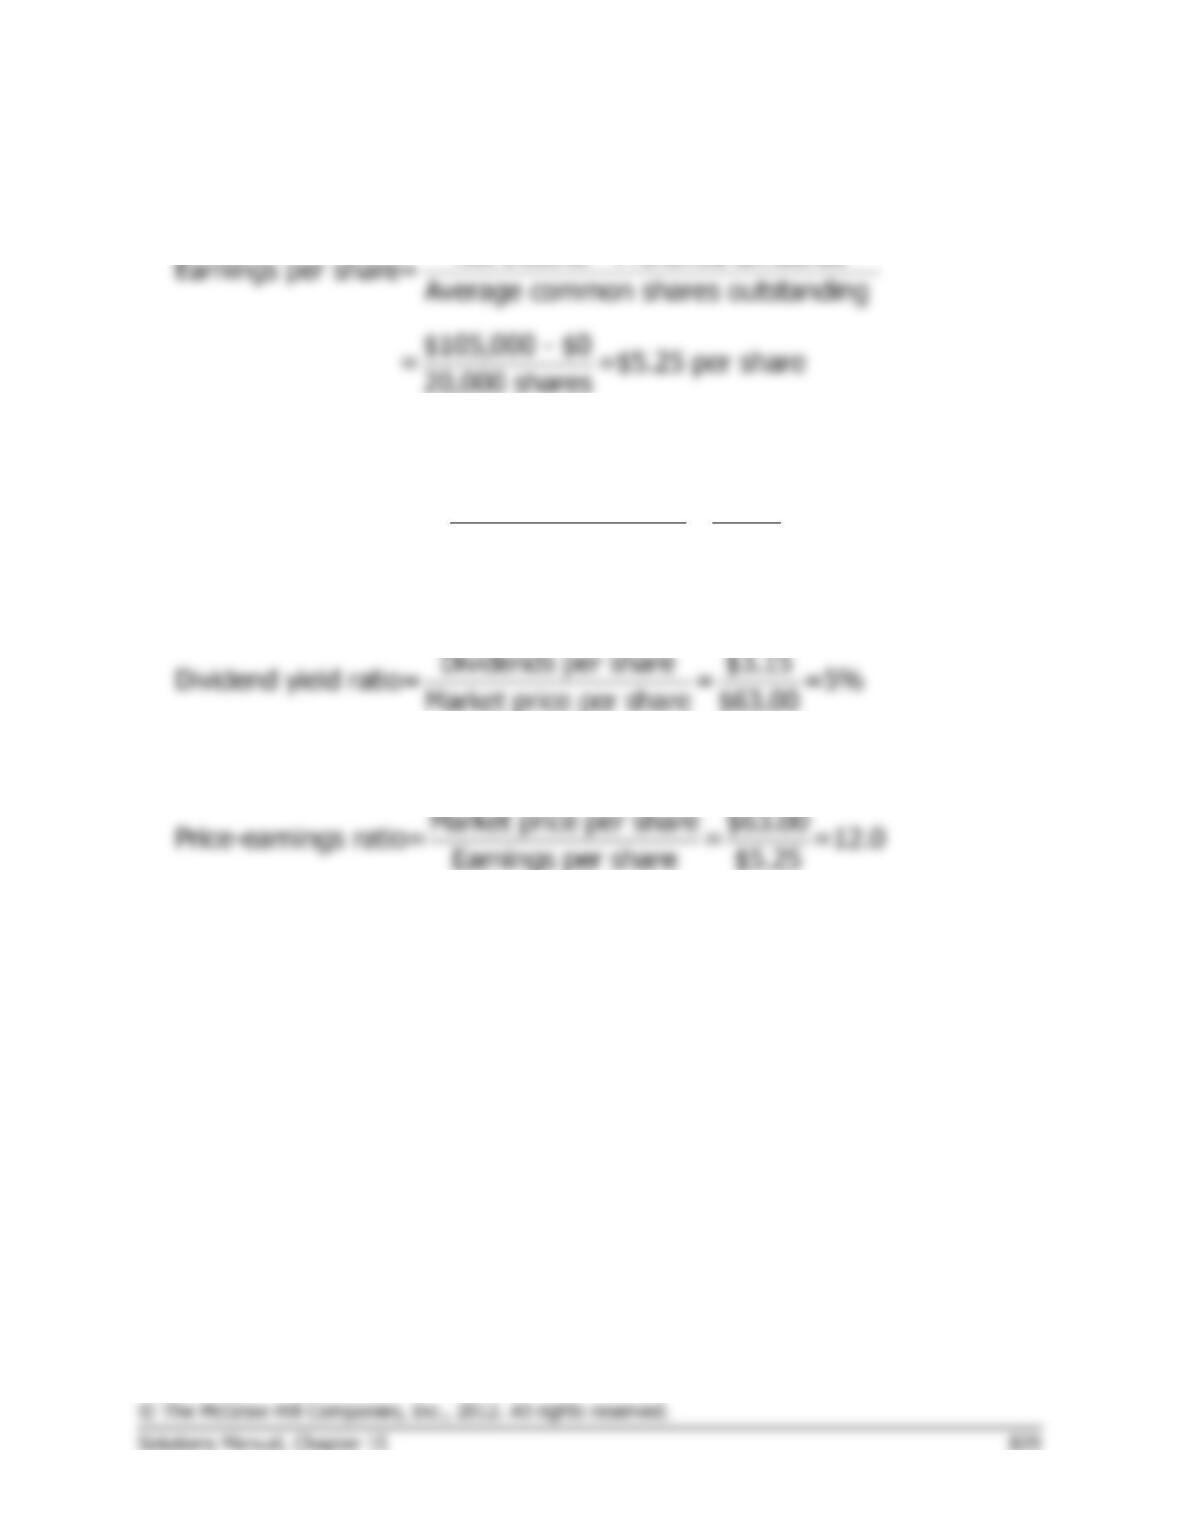
Exercise 15-7 (20 minutes)
1. Earnings per share:
Net income – Preferred dividends
2. Dividend payout ratio:
Dividends per share $3.15
Dividend payout ratio= = =60%
Earnings per share $5.25
3. Dividend yield ratio:
4. Price-earnings ratio:
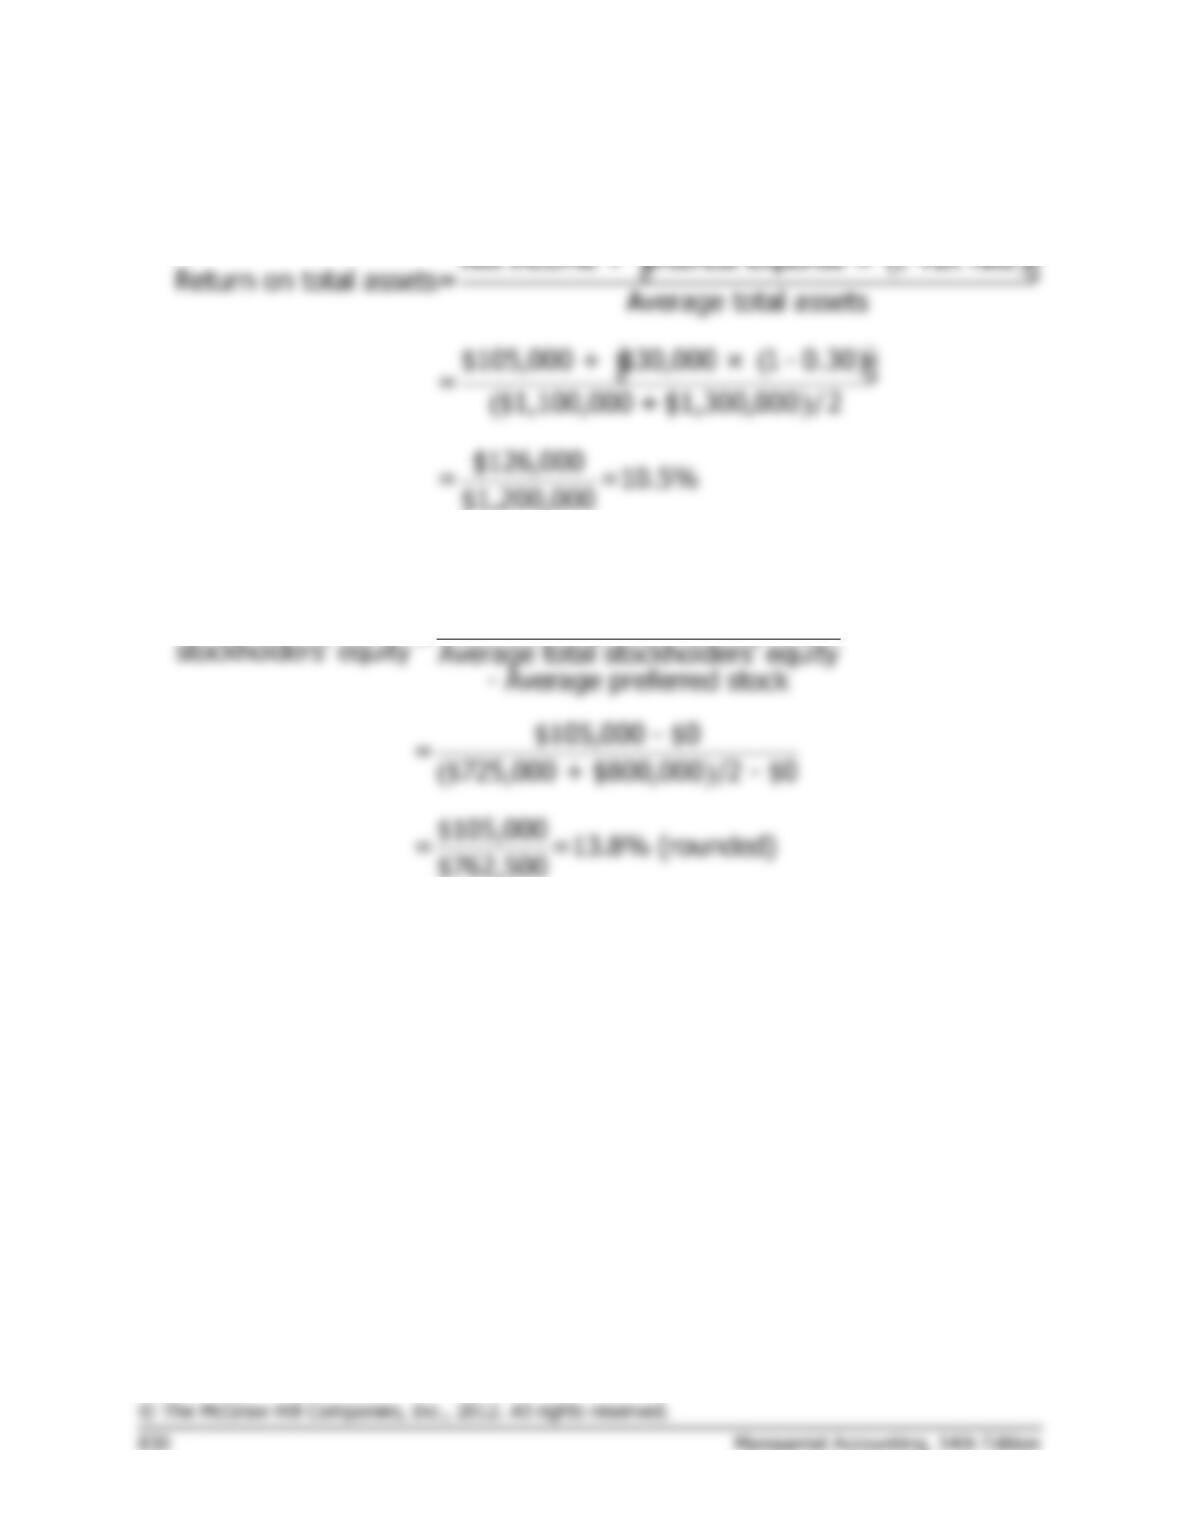
Exercise 15-8 (20 minutes)
1. Return on total assets:
éù
2. Return on common stockholders’ equity:
Net income – Preferred dividends
Return on common =
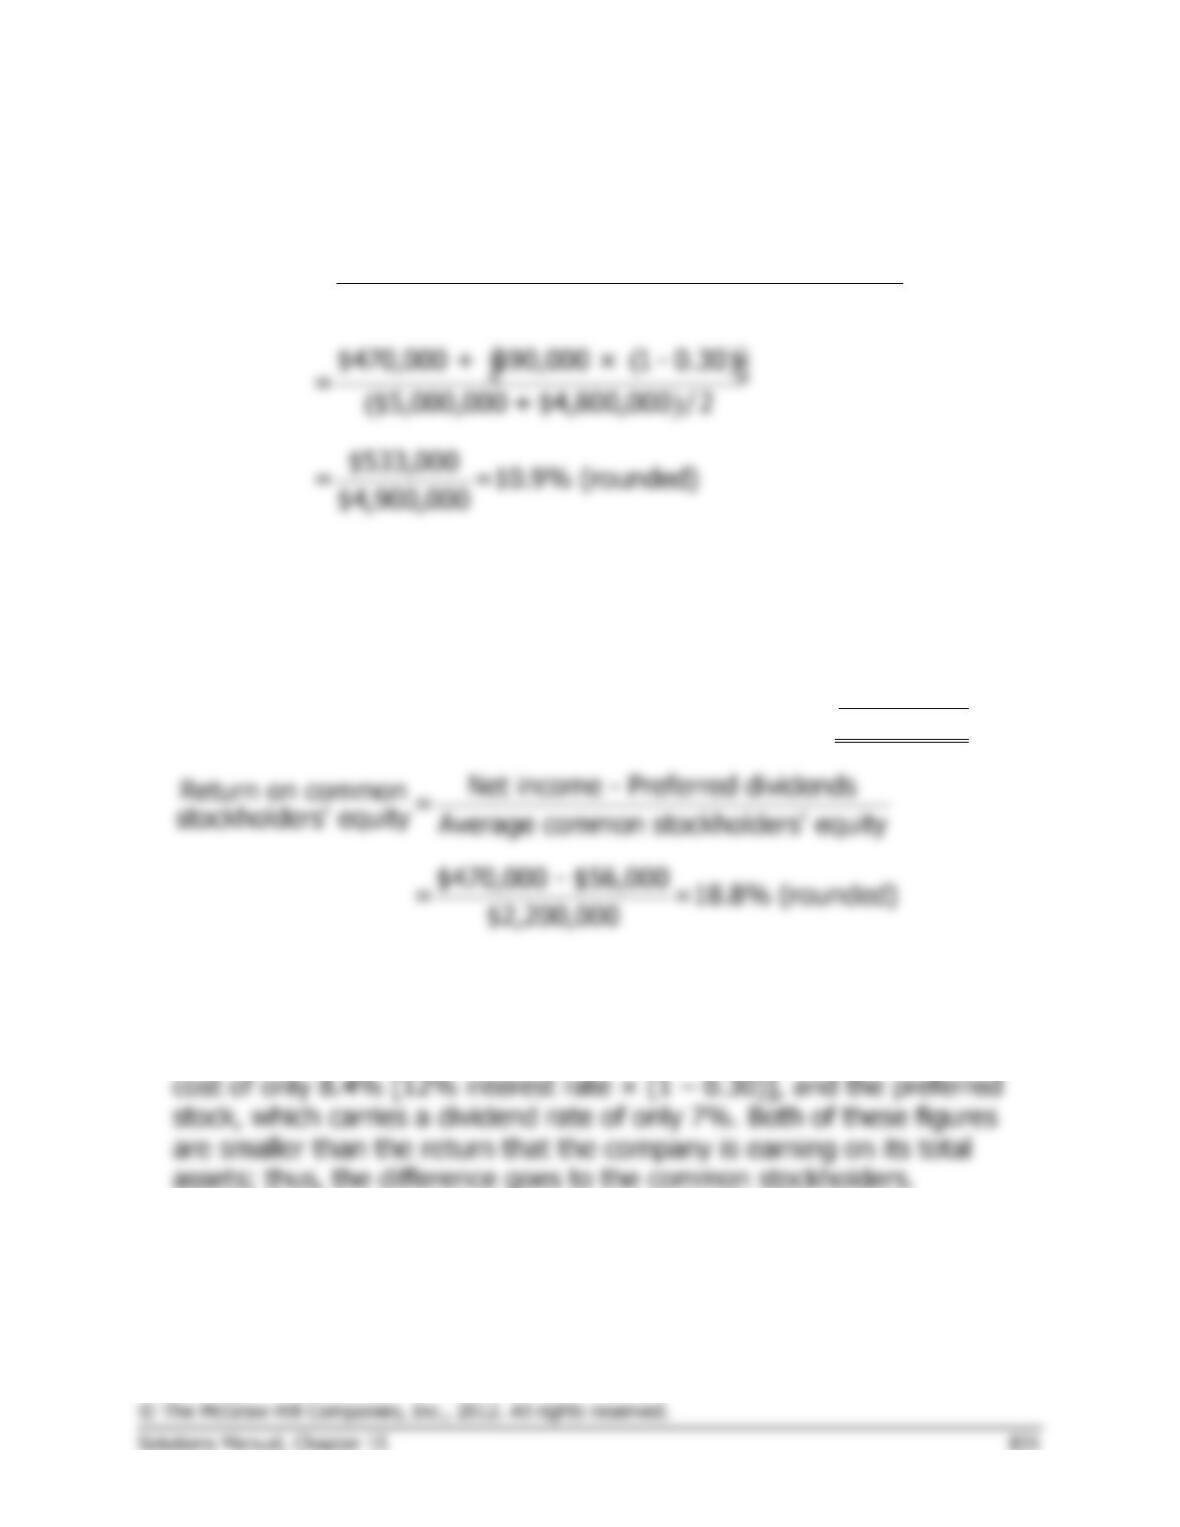
3. Financial leverage was positive because the rate of return to the
common stockholders (13.8%) was greater than the rate of return on
total assets (10.5%). This positive leverage is traceable in part to the
company’s current liabilities, which may carry no interest cost, and to
the bonds payable, which have an after-tax interest cost of only 7%.
10% interest rate × (1 – 0.30) = 7%
Exercise 15-9 (20 minutes)
1. Return on total assets:
( )
Net income + Interest expense × 1-Tax rate
Return on =
total assets Average total assets
éù
ëû
2. Return on common stockholders’ equity:
Average stockholders’ equity
($3,100,000 + $2,900,000)/2 ………………………….
$3,000,000
Average preferred stock ($800,000 + $800,000)/2 …
800,000
Average common stockholders’ equity …………………
$2,200,000
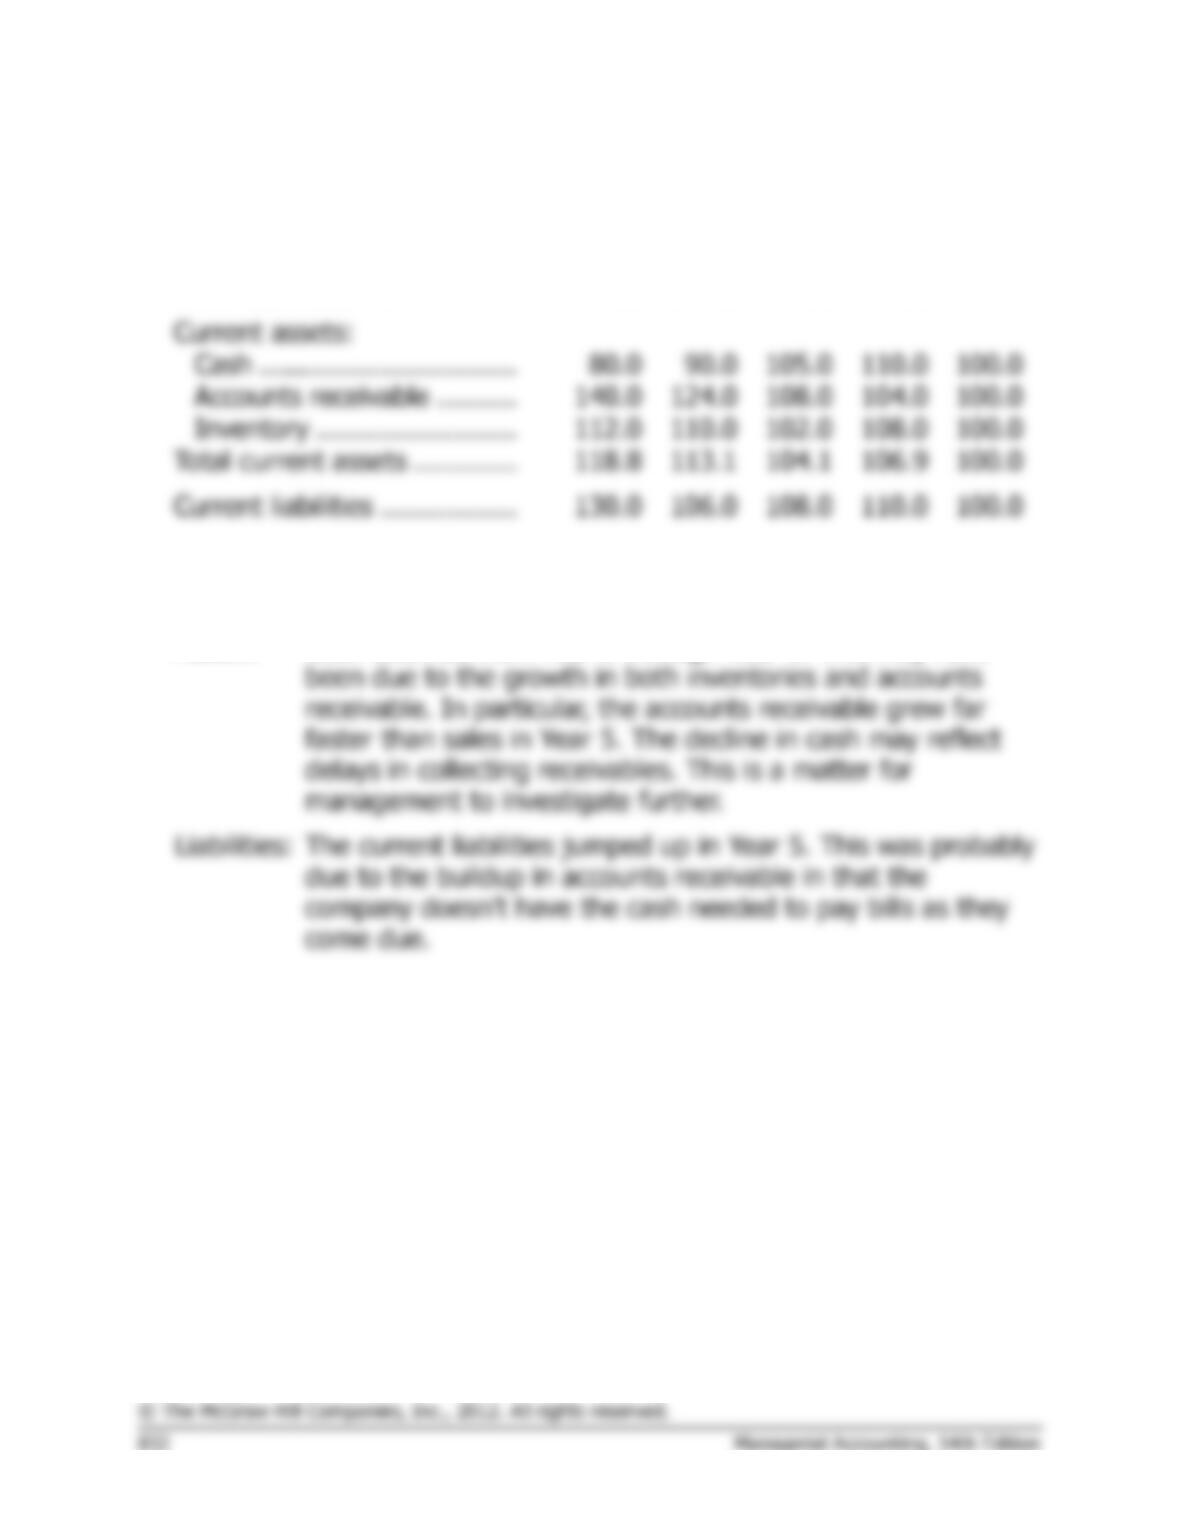
3. Leverage is positive because the return on common stockholders’ equity
(18.8%) is greater than the return on total assets (10.9%). This positive
leverage arises from the long-term debt, which has an after-tax interest
Exercise 15-10 (15 minutes)
1. The trend percentages are:
Year 5
Year 4
Year 3
Year 2
Year 1
Sales …………………………….
125.0
120.0
110.0
105.0
100.0
Current assets:
105.0
110.0
100.0
140.0
124.0
108.0
104.0
100.0
112.0
110.0
102.0
108.0
100.0
Total current assets ………….
Current liabilities ……………..
2.
Sales:
The sales are increasing at a steady rate, with a particularly
strong gain in Year 4.
Assets:
Cash declined from Year 3 through Year 5. This may have
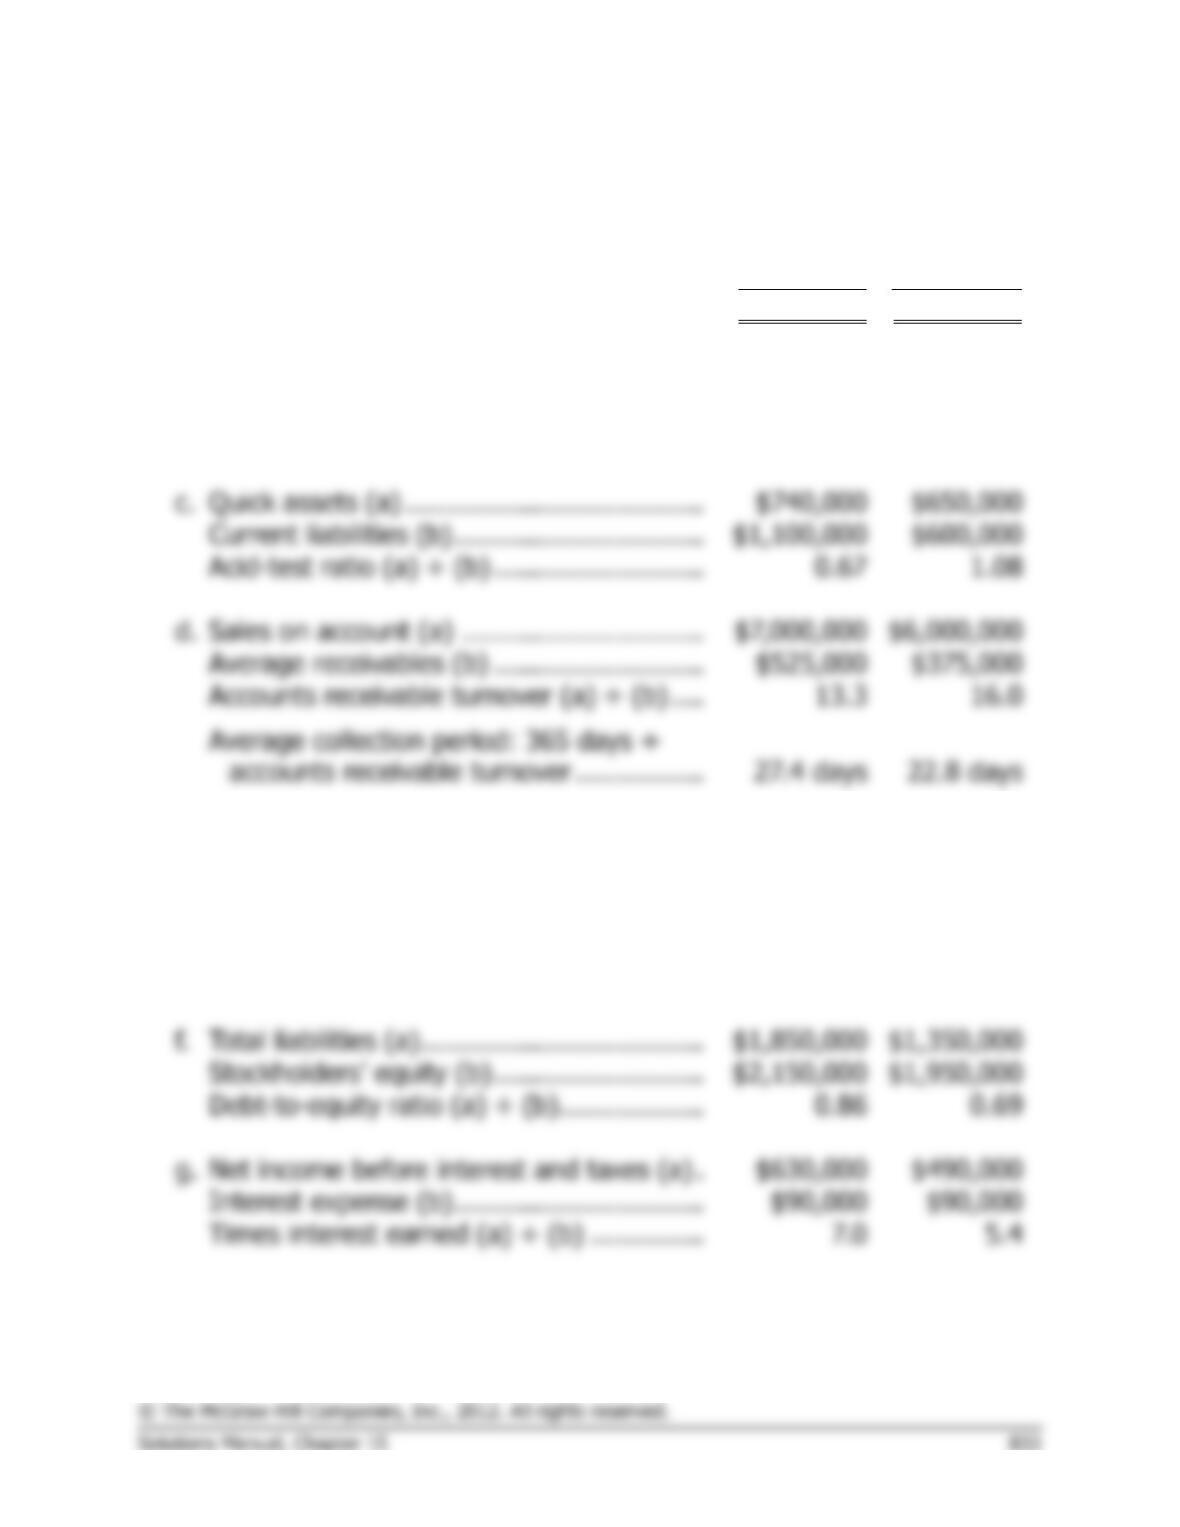
Problem 15-11 (60 minutes)
This Year
Last Year
1.
a.
Current assets (a) …………………………….
$2,060,000
$1,470,000
Current liabilities (b) ………………………….
1,100,000
600,000
Working capital (a) − (b) ……………………
$ 960,000
$ 870,000
b.
Current assets (a) …………………………….
$2,060,000
$1,470,000
Current liabilities (b) ………………………….
$1,100,000
$600,000
Current ratio (a) ÷ (b) ……………………….
1.87
2.45
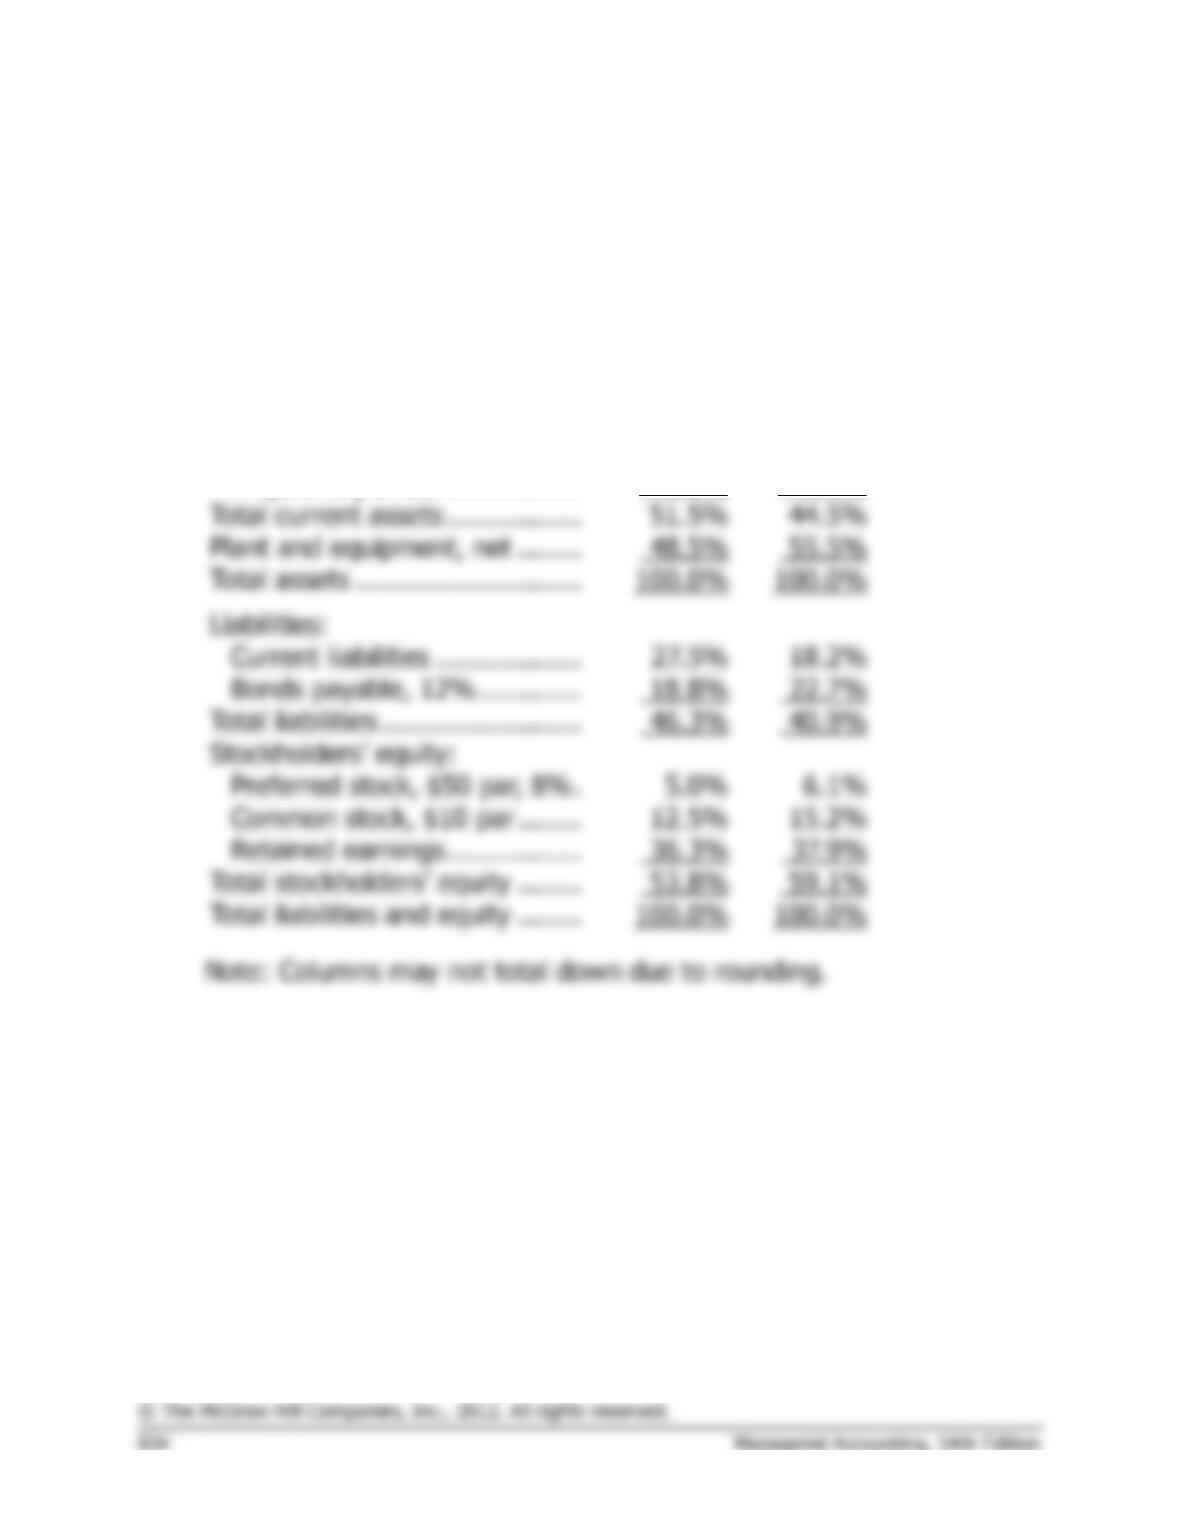
Quick assets (a) ……………………………….
$650,000
Current liabilities (b) ………………………….
$1,100,000
$600,000
Acid-test ratio (a) ÷ (b) ……………………..
Sales on account (a) …………………………
$6,000,000
Average receivables (b) ……………………..
Accounts receivable turnover (a) ÷ (b) ….
Average collection period: 365 days ÷
27.4 days
22.8 days
e.
Cost of goods sold (a) ……………………….
$5,400,000
$4,800,000
Average inventory (b) ………………………..
$1,050,000
$760,000
Inventory turnover ratio (a) ÷ (b) ………..
5.1
6.3
Average sale period:
365 days ÷ inventory turnover ………….
71.6 days
57.9 days
Total liabilities (a) ……………………………..
$1,850,000
$1,350,000
Stockholders’ equity (b) ……………………..
$2,150,000
$1,950,000
Net income before interest and taxes (a) .
$490,000
Interest expense (b) ………………………….
Times interest earned (a) ÷ (b) …………..
Problem 15-11 (continued)
2.
a.
Modern Building Supply
Common-Size Balance Sheets
This Year
Last Year
Current assets:
Cash ………………………………
2.3%
6.1%
Marketable securities …………
0.0%
1.5%
Accounts receivable, net …….
16.3%
12.1%
Inventory ………………………..
32.5%
24.2%
Prepaid expenses ……………..
0.5%
0.6%
Total current assets ……………..
Plant and equipment, net ……..
Total assets ……………………….
Liabilities:
Current liabilities ………………
27.5%
18.2%
Bonds payable, 12% ………….
Total liabilities …………………….
46.3%
Preferred stock, $50 par, 8% .
5.0%
6.1%
Common stock, $10 par ……..
12.5%
15.2%
Retained earnings ……………..
53.8%
Total liabilities and equity ……..
Problem 15-11 (continued)
b.
Modern Building Supply
Common-Size Income Statements
This Year
Last Year
Sales ………………………………………..
100.0%
100.0%
Cost of goods sold ……………………….
77.1%
80.0%
Gross margin …………………………..…
Selling and administrative expenses ..
11.8%
Net operating income …………………..
Interest expense …………………………
Net income before taxes ……………….
Income taxes ……………………………..
Net income ………………………………..
3. The following points can be made from the analytical work in parts (1)
and (2) above:
a. The company has improved its profit margin from last year. This is
attributable primarily to an increase in gross margin, which is offset
Problem 15-11 (continued)
c. The drain on the cash account seems to be a result mostly of a large
buildup in accounts receivable and inventory. Notice that the average
collection period has increased by 4.6 days since last year, and that it
is now 9 days over the industry average. Many of the company’s
Problem 15-12 (60 minutes)
1.
a.
This Year
Last Year
Net income ……………………………………
$324,000
$240,000
Less preferred dividends …………………..
16,000
16,000
Net income remaining for common (a) …
$308,000
$224,000
Average number of common shares (b) .
50,000
50,000
Earnings per share (a) ÷ (b) ……………..
$6.16
$4.48
Dividends per share (a)* …………………..
$2.16
Dividend yield ratio (a) ÷ (b) ……………..
c.
Dividends per share (a) ……………………
$2.16
$1.20
Earnings per share (b) ……………………..
$6.16
$4.48
Dividend payout ratio (a) ÷ (b) ………….
35.1%
26.8%
Market price per share (a) ………………..
$45.00
Earnings per share (b) ……………………..
$6.16
Price-earnings ratio (a) ÷ (b) …………….
Problem 15-12 (continued)
This Year
Last Year
e.
Total stockholders’ equity ……………….
$2,150,000
$1,950,000
Book value per share (a) ÷ (b) ………..
2.
a.
Net income ………………………………….
$ 324,000
$ 240,000
Add after-tax cost of interest paid:
[$90,000 × (1 – 0.40)] ………………..
54,000
54,000
Total (a) ……………………………………..
$ 378,000
$ 294,000
Average total assets (b) ………………….
Net income ………………………………….
$ 324,000
$ 240,000
Less preferred dividends …………………
16,000
16,000
Net income remaining for common (a)
$ 308,000
$ 224,000
*1/2($2,150,000 + $1,950,000); 1/2($1,950,000 + $1,786,000)