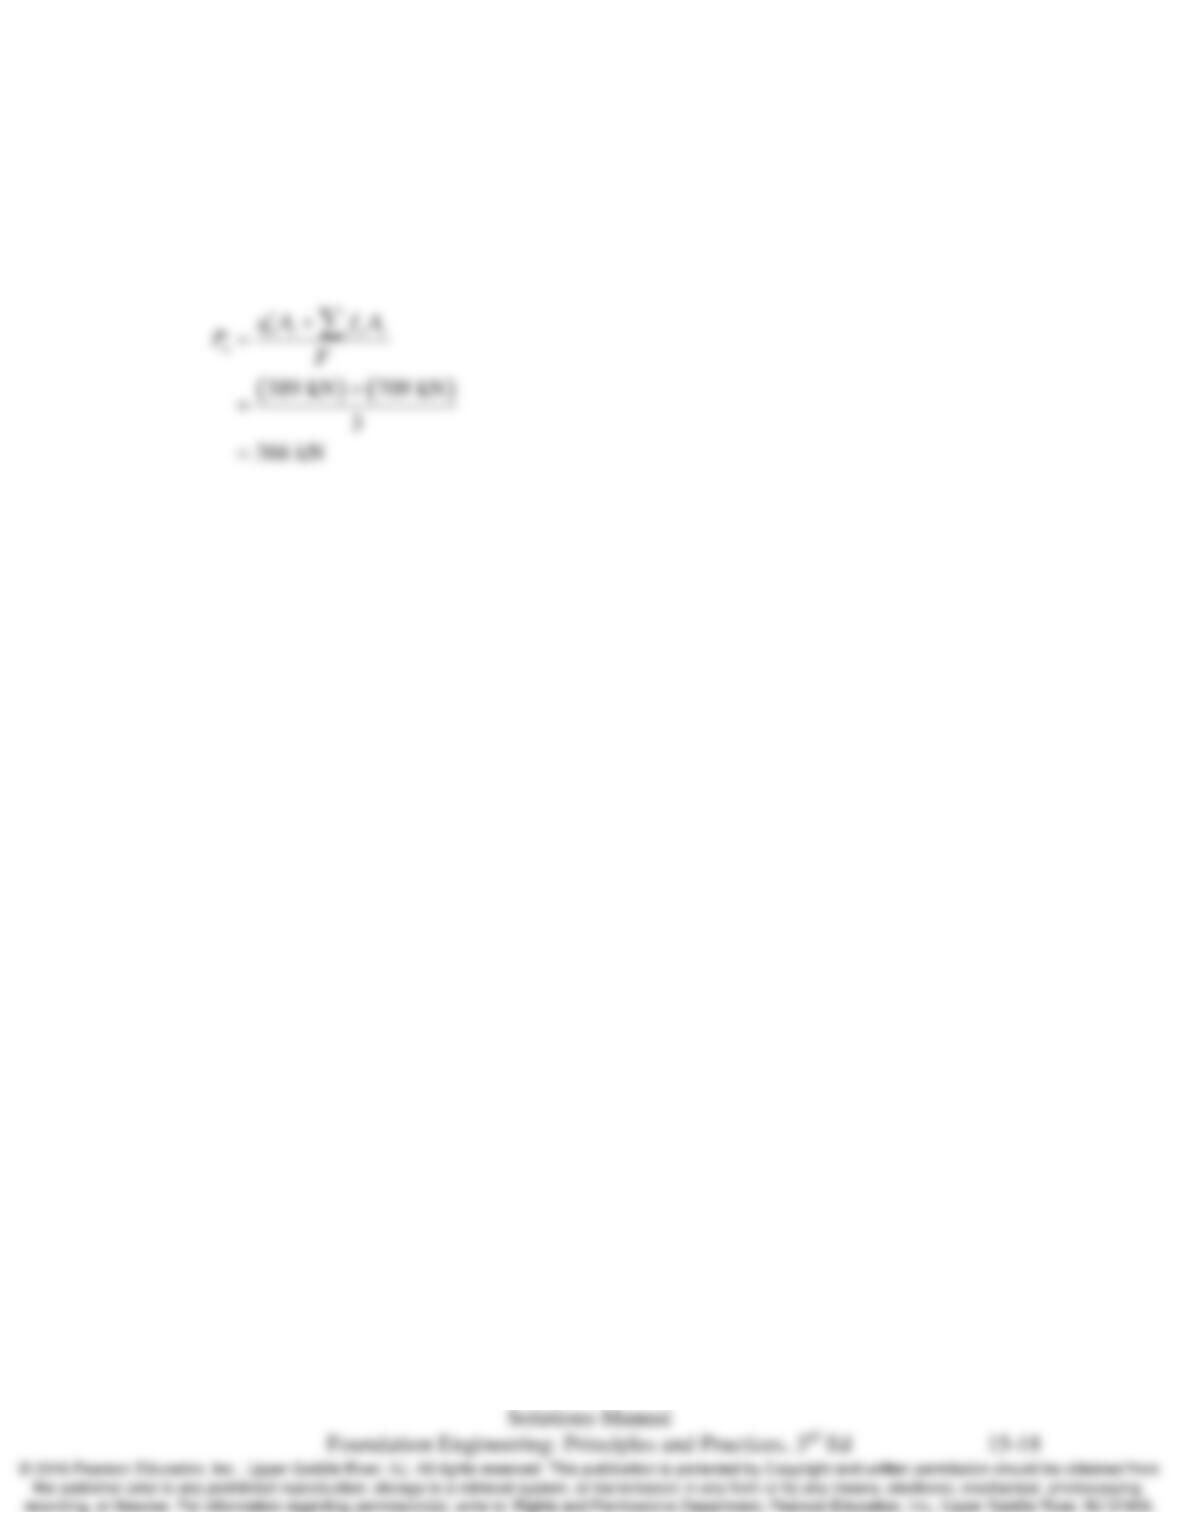
Chap.15 Driven Piles: Axial Load Capacity Based on Static Analysis Methods
( )
( )
2
1080 kPa 0.36 m
389 kN
nt
qA
′=
=
(c) Determine
a
P
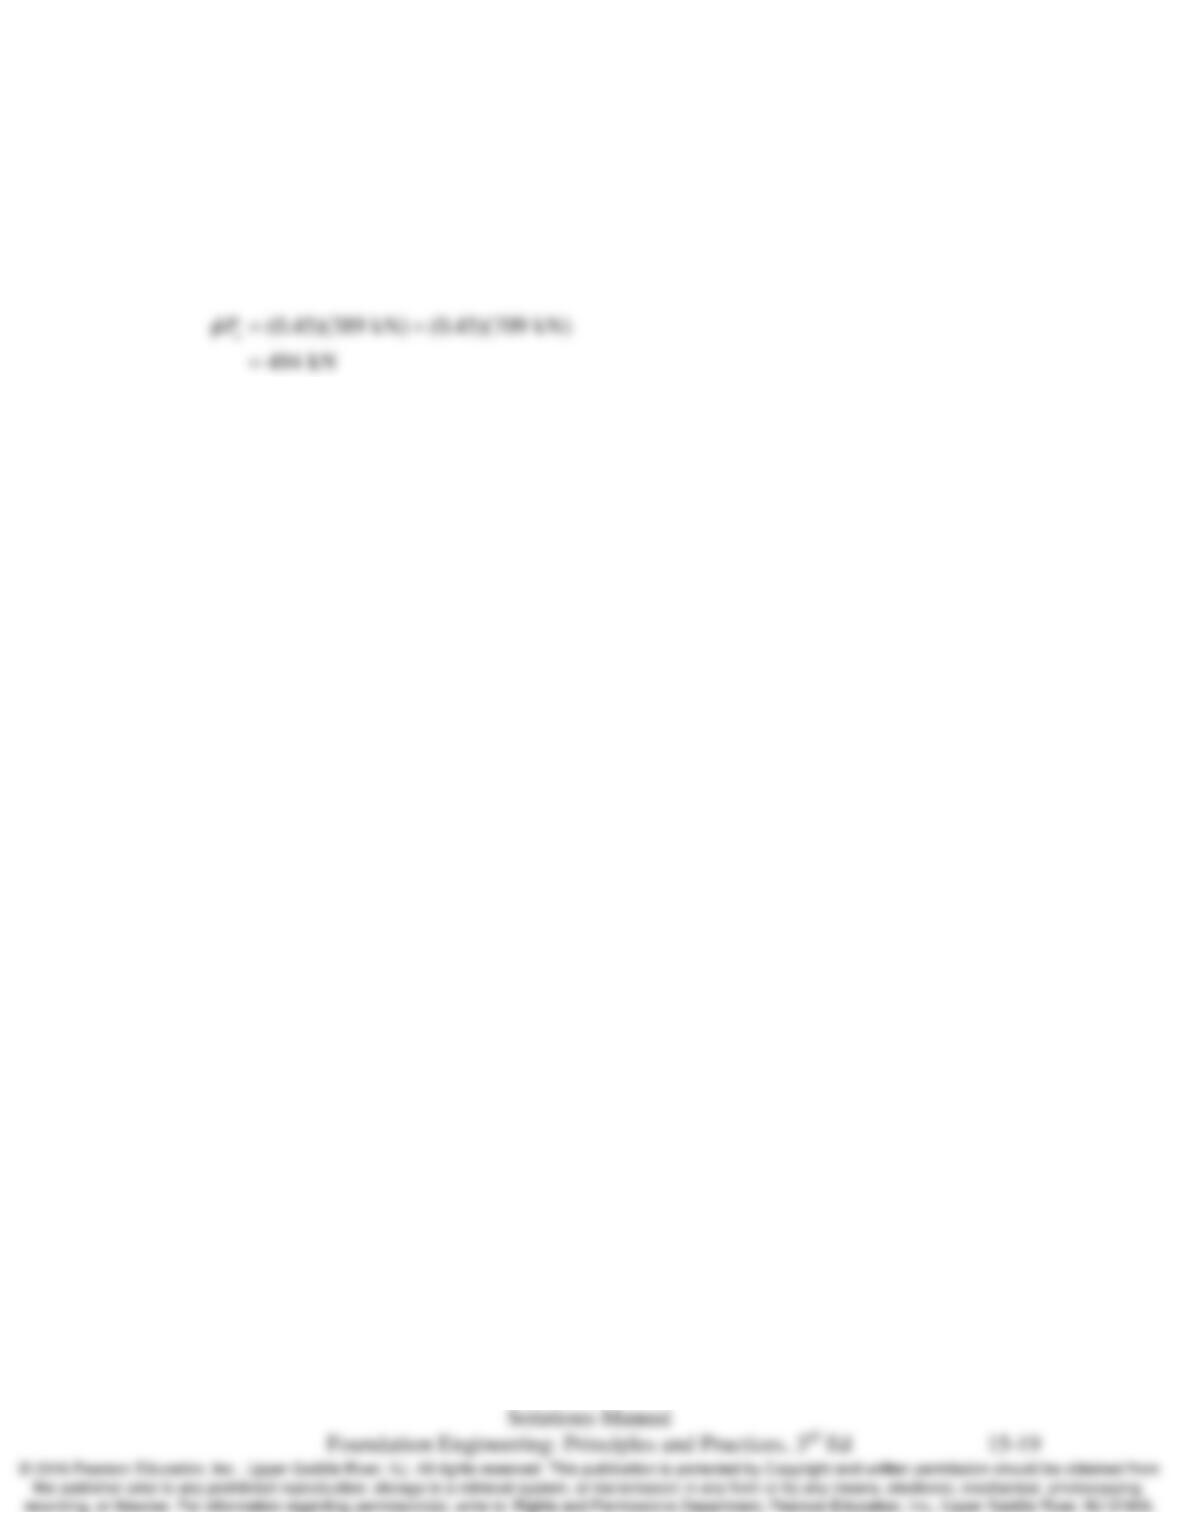
Chap.15 Driven Piles: Axial Load Capacity Based on Static Analysis Methods
15.10 Using the data in Problem 15.9 and the AASHTO resistance factors, compute
n
P
φ
.
Solution
Use
0.45
φ
=
per Table 13.4
Chap.15 Driven Piles: Axial Load Capacity Based on Static Analysis Methods
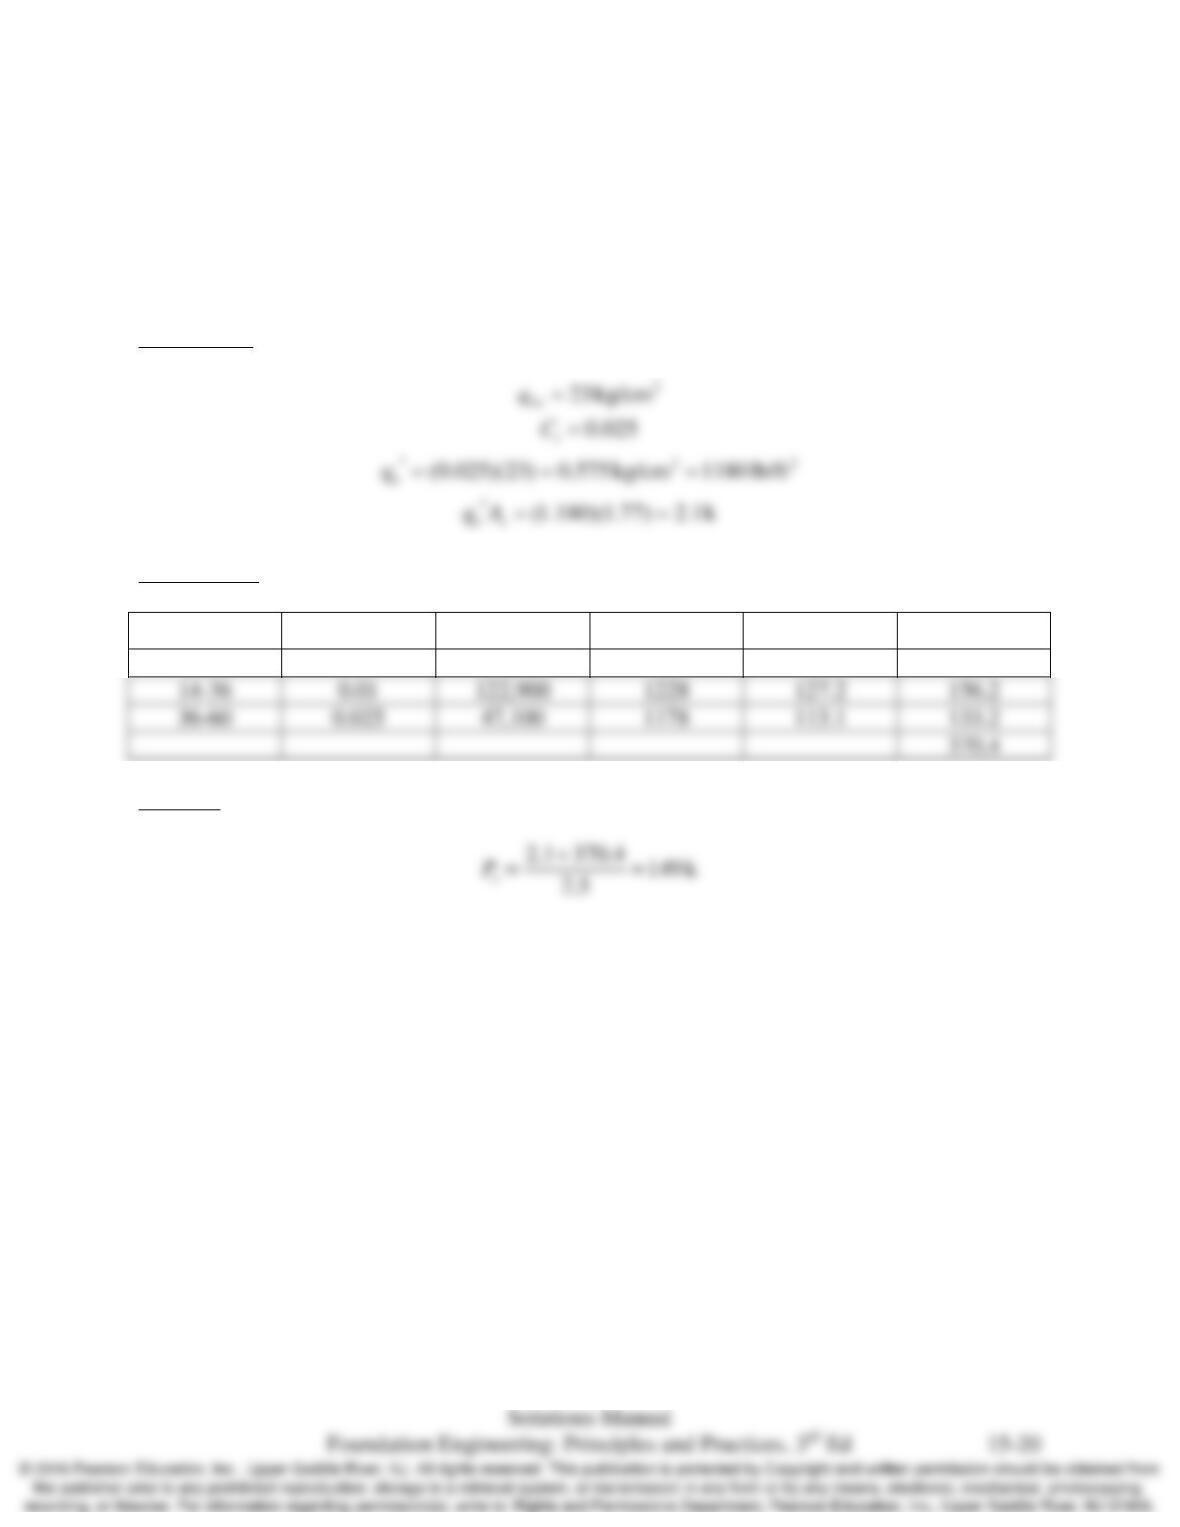
15.11 Using the Eslami and Fellenius method, compute the ASD allowable downward load capacity of
an 18-inch diameter closed-end steel pipe pile driven 60 ft into the soil profile shown in Figure
15.13. Use a factor of safety of 2.5.
Solution
Toe Bearing
Side Friction
Depth (ft)
s
C
2
(lb/ft )
E
q
s
f
s
A
ss
fA
(k)
0-14
0.01
122,900
1228
66.0
81.0
0.01
122,900
1228
1178
Capacity
Chap.15 Driven Piles: Axial Load Capacity Based on Static Analysis Methods
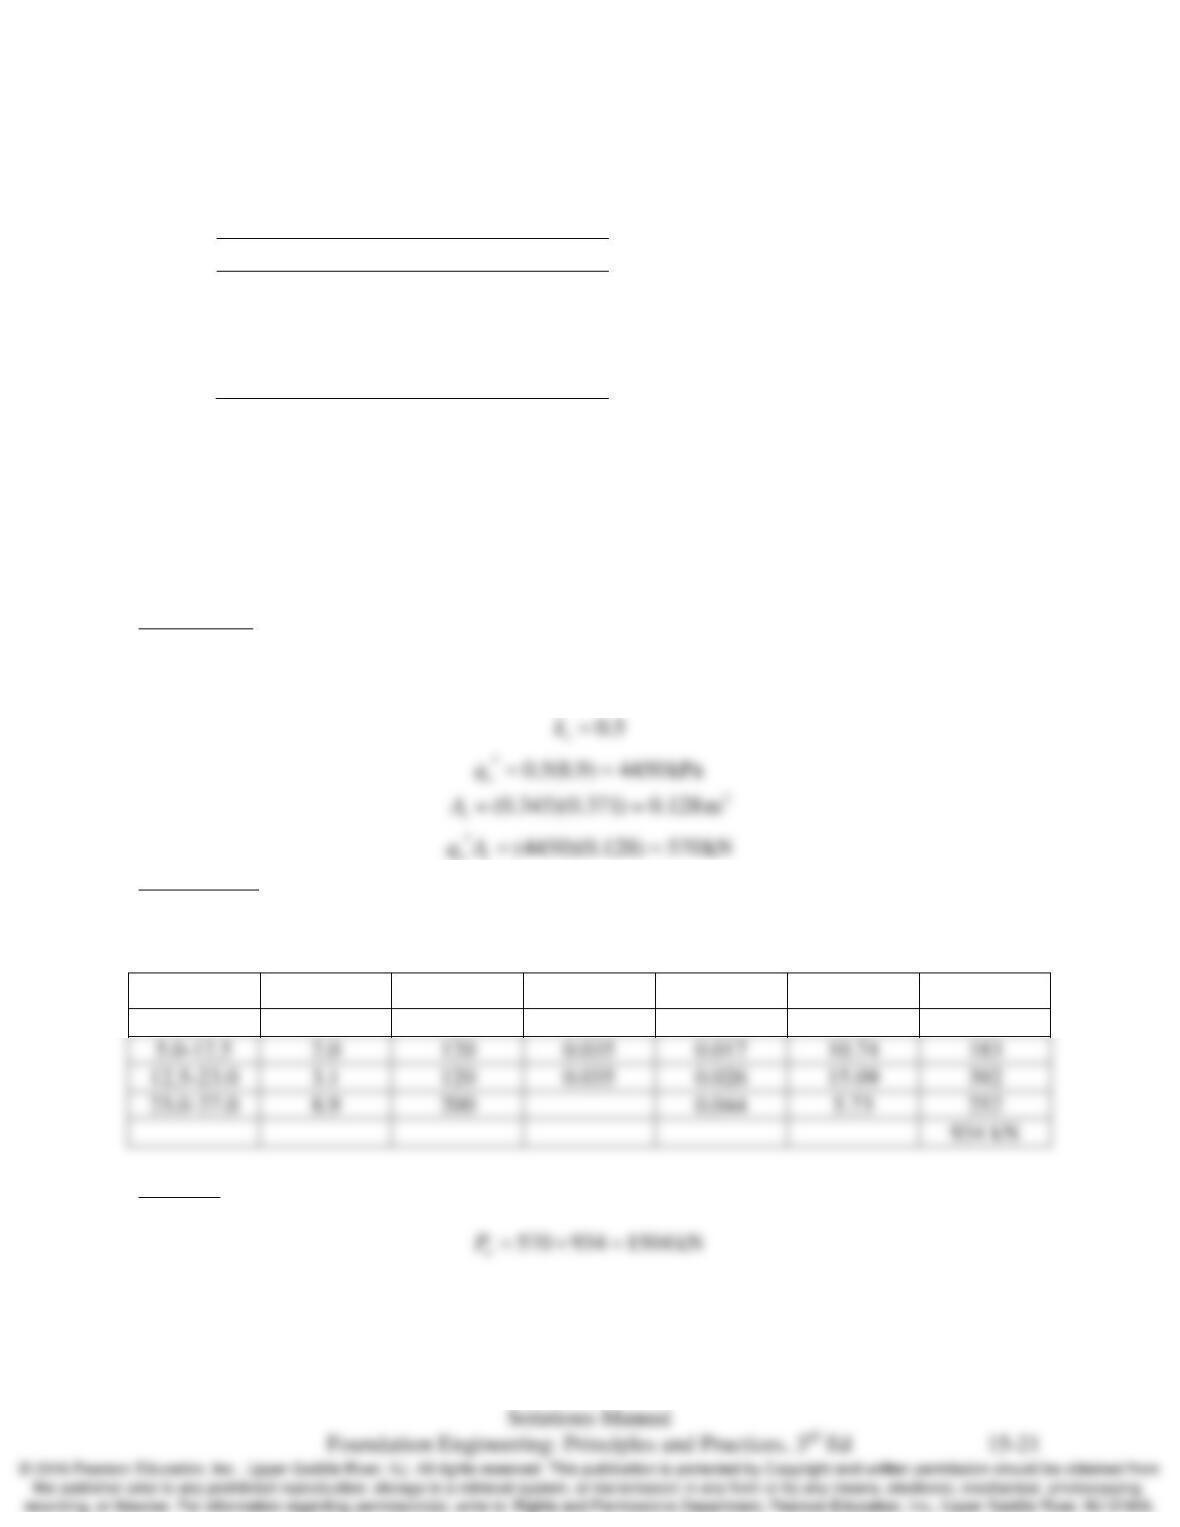
15.12 An HP360x108 pile is to be driven to a depth of 27.0 m in the following soil profile:
Depth (m) Soil Type qc (MPa)
0–5.0 Clay 0.9
5.0–12.5 Clay 2.0
12.5–23.0 Silt 3.1
23.0–30.0 Sand 8.9
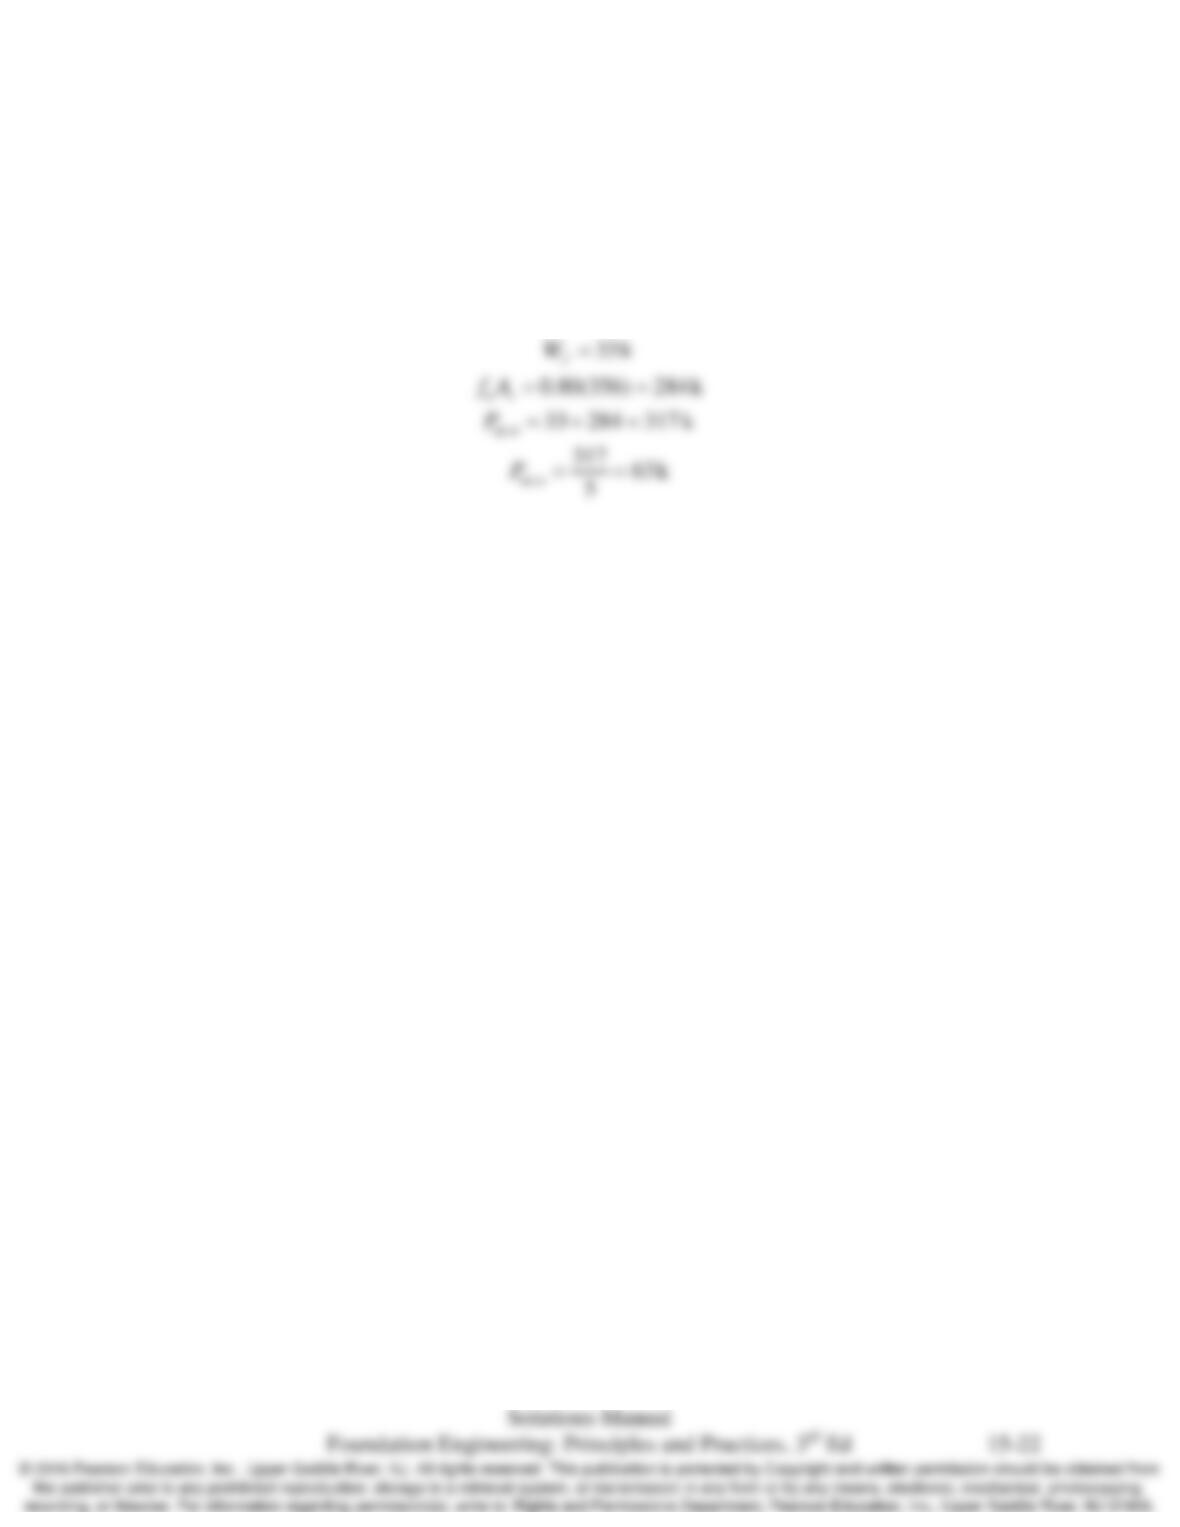
Using the LCPC method, compute the nominal downward load capacity,
n
P
. See Table 21.1 for
cross-sectional dimensions.
Solution
Toe Bearing
Group II
nt
Side Friction
Category IIB
Depth (m)
c
q
(MPa)
s
k
sm
f
(MPa)
x
f
(MPa)
s
A
ss
fA
0-5.0
0.9
30
0.015
0.015
7.16
107
2.0
120
0.035
0.017
10.74
183
3.1
120
0.035
0.026
15.09
392
8.9
200
0.044
5.73
252
Capacity
Chap.15 Driven Piles: Axial Load Capacity Based on Static Analysis Methods
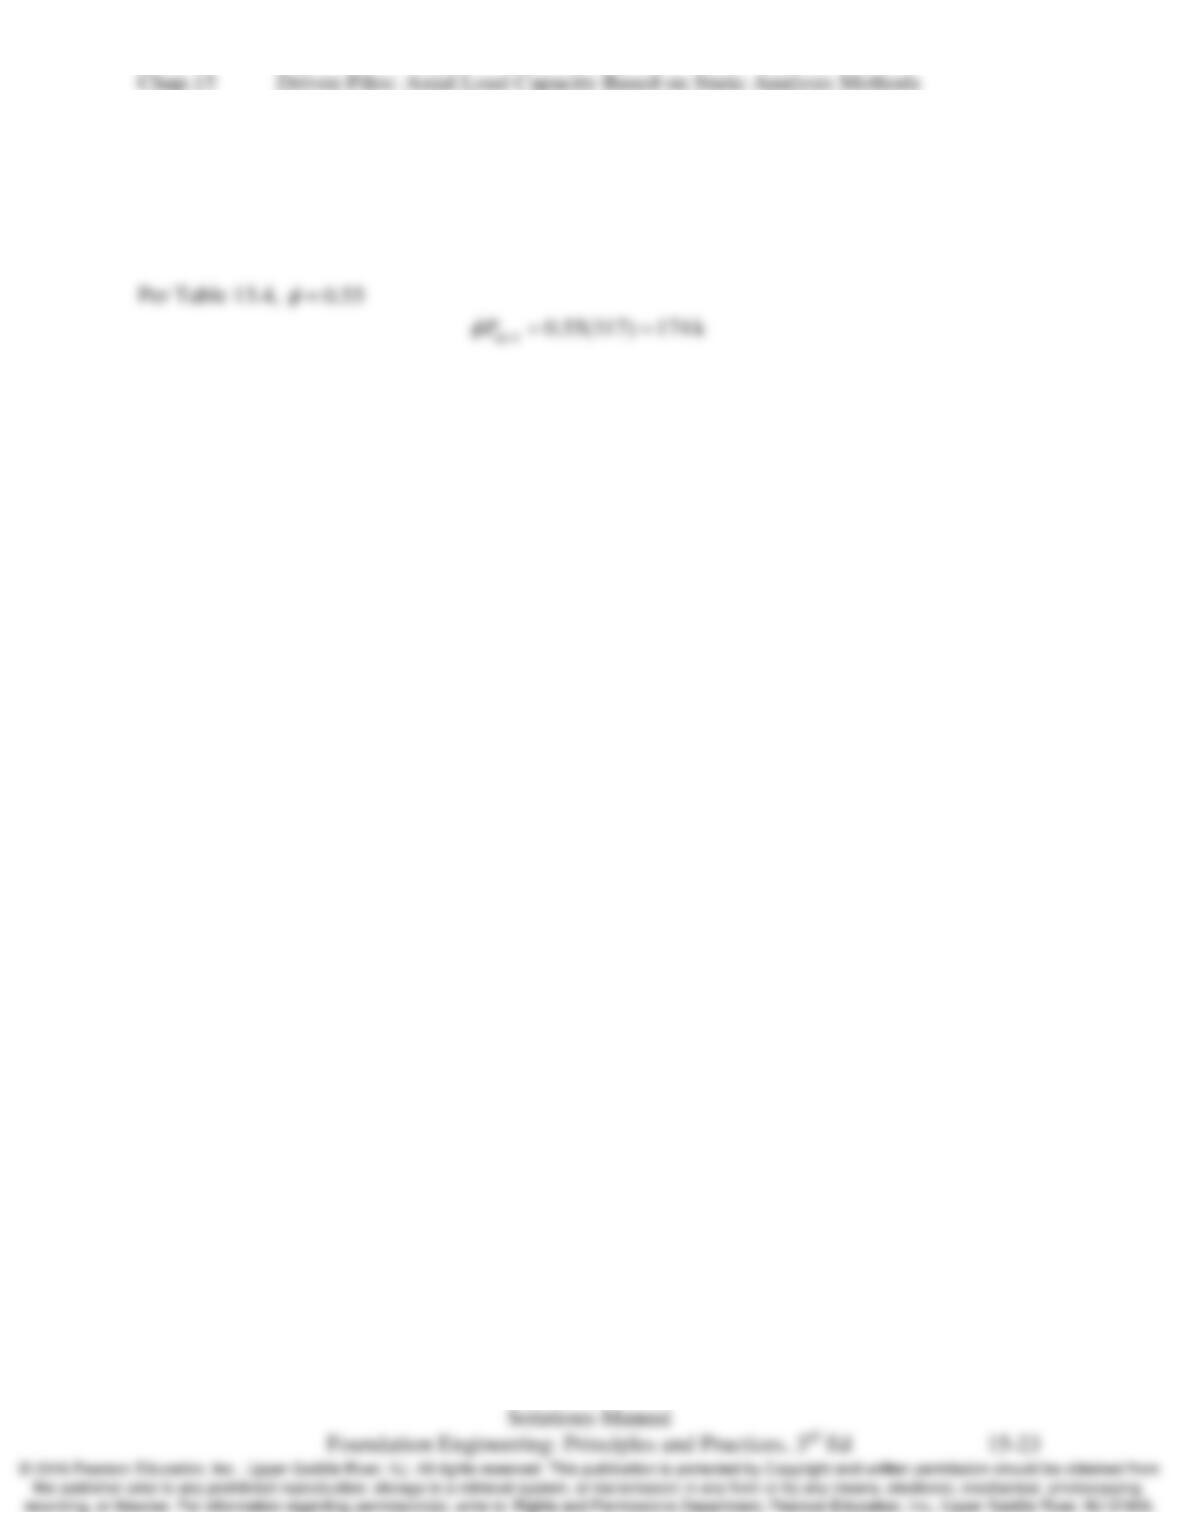
15.13 Using a factor of safety of 5.0, compute the ASD allowable upward load capacity,
,up a
P
for the
pile described in Problem 15.3. The wall thickness is 0.50 in and the pile will be filled with
concrete.
Solution
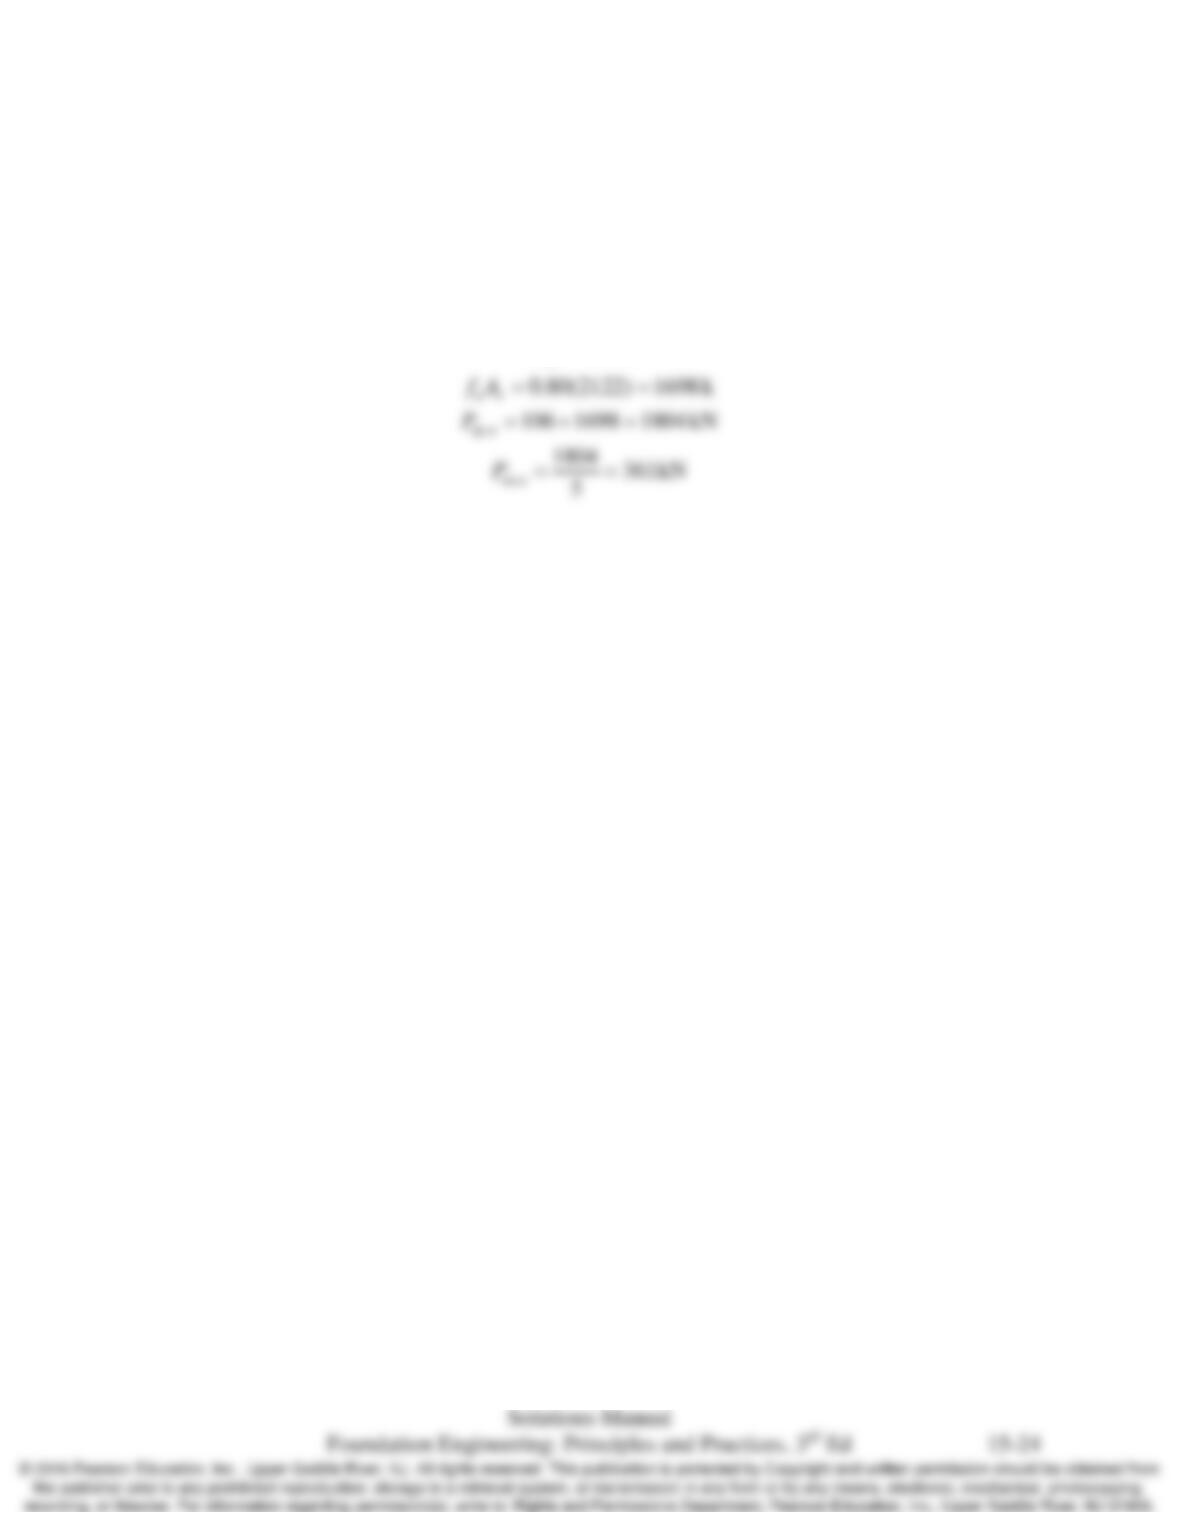
15.14 Using the data in Problem 15.4 and the AASHTO resistance factors, compute
,up n
P
φ
.
Solution
Chap.15 Driven Piles: Axial Load Capacity Based on Static Analysis Methods
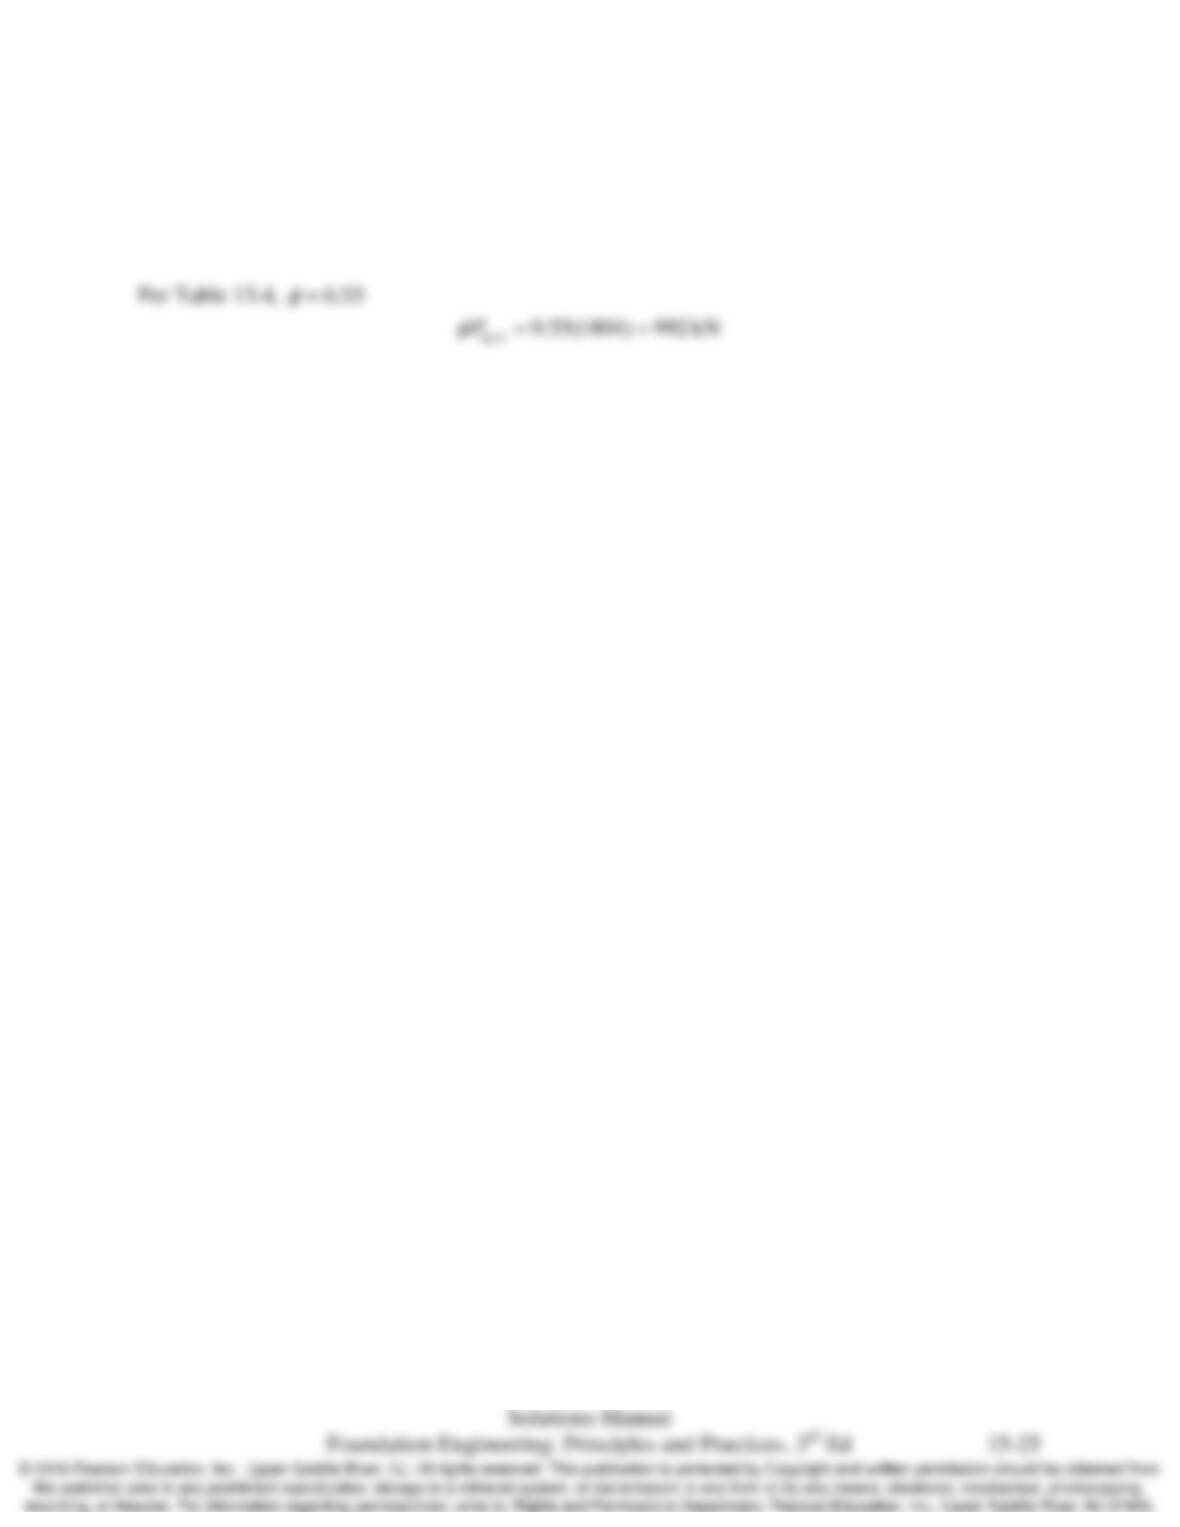
15.15 Using a factor of safety of 5.0, compute the ASD allowable upward load capacity,
,up a
P
for the
pile described in Problem 15.5. The wall thickness is 20 mm and the pile will be filled with
concrete.
Solution
106 kN
f
W=
Chap.15 Driven Piles: Axial Load Capacity Based on Static Analysis Methods
15.16 Using the data in Problem 15.6 and the AASHTO resistance factors, compute
,up n
P
φ
.
Solution
Chap.15 Driven Piles: Axial Load Capacity Based on Static Analysis Methods
15.17 What is “block failure” in a group of piles and how does it differ from individual failure?
Solution
Block failure is the mode of failure where the pile group and the soil between the files moves as
Chap.15 Driven Piles: Axial Load Capacity Based on Static Analysis Methods
15.18 What is a typical design group efficiency factor for piles driven into loose cohesionless soil
without predrilling or jetting? How does predrilling and jetting affect this factor? Why?
Solution
A typical group efficiency factor without predrilling or jetting would be about 1. Values
Chap.15 Driven Piles: Axial Load Capacity Based on Static Analysis Methods
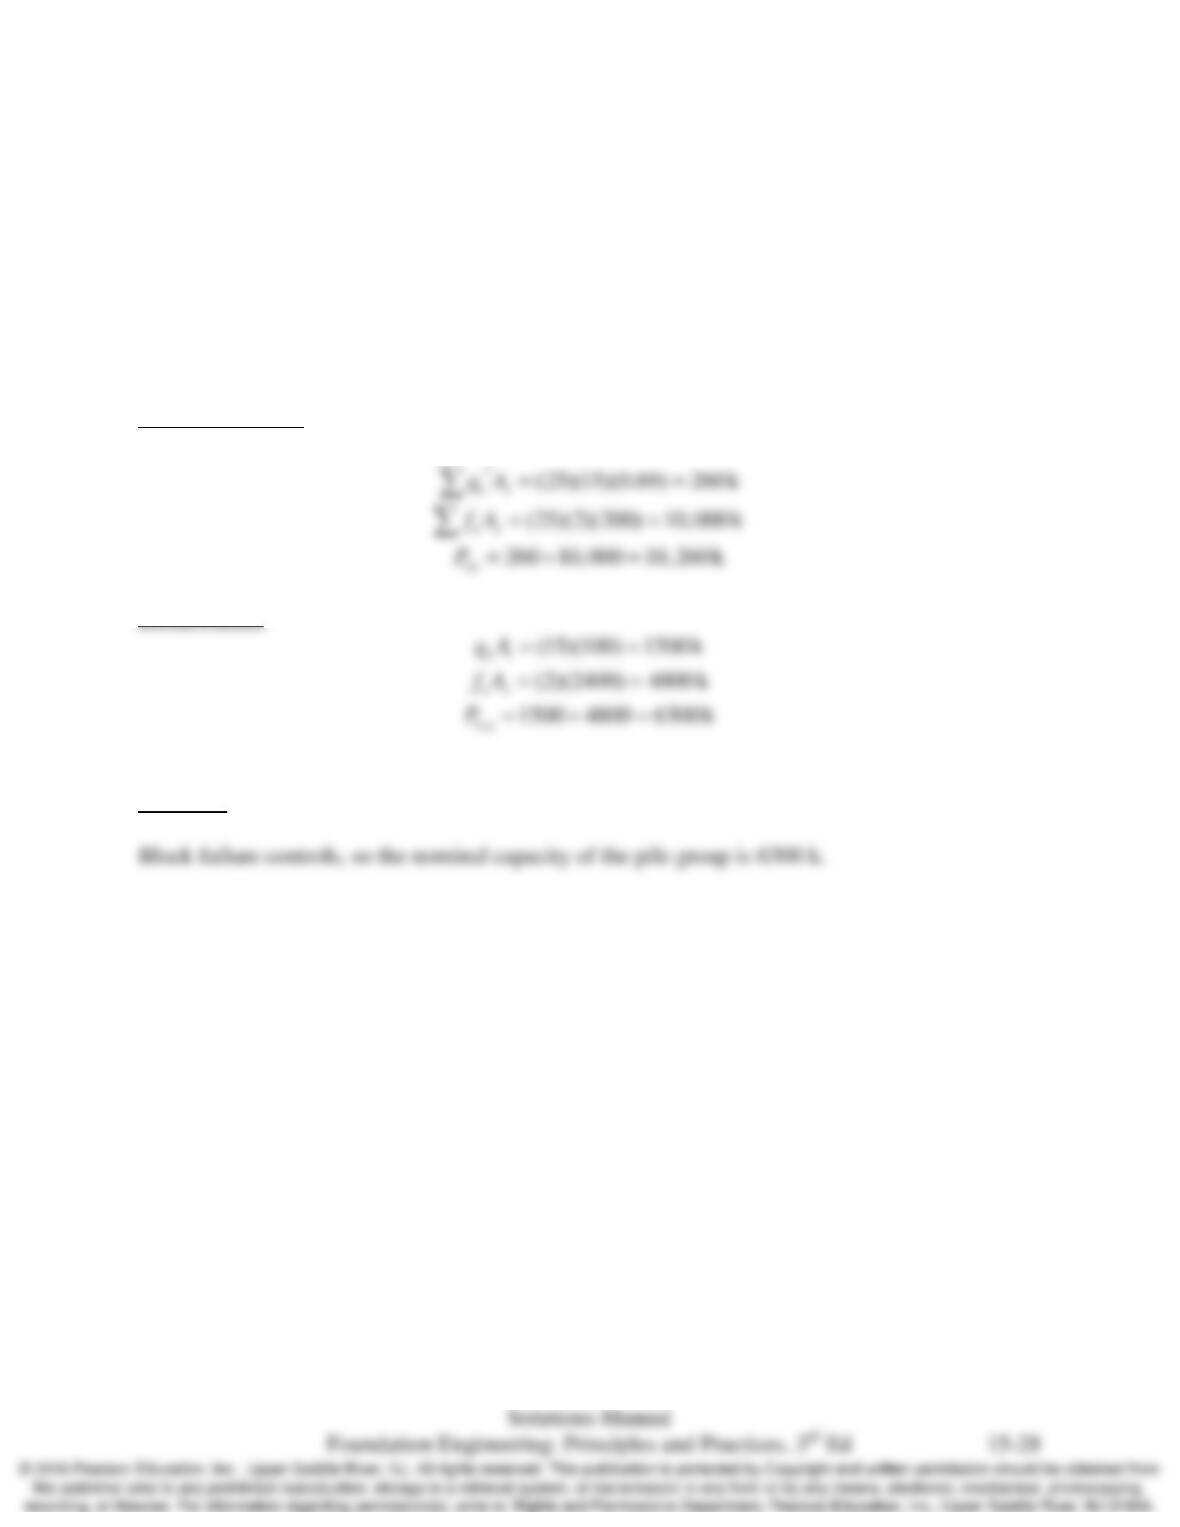
15.19 A group of 25 HP10x57 piles are arranged in a 5×5 grid at 27 inches on center and driven to a
depth of 60 ft. The soil is a clay with unit side friction resistance,
n
f
of 2000 lb/ft2 and a unit toe
bearing resistance,
n
q′
, of 15,000 lb/ft2. Determine whether individual or block failure controls
the design, and determine the nominal capacity of the pile group,
ng
P
. See Table 21.1 for cross-
sectional dimensions of each pile.
Solution
Individual Failure
Block Failure
Summary
Chap.15 Driven Piles: Axial Load Capacity Based on Static Analysis Methods
15.20 Explain the physical basis for setup, and describe a typical situation where setup would be
observed.
Solution
The primary physical basis for setup is the dissipation of excess pore water pressures that
Chap.15 Driven Piles: Axial Load Capacity Based on Static Analysis Methods
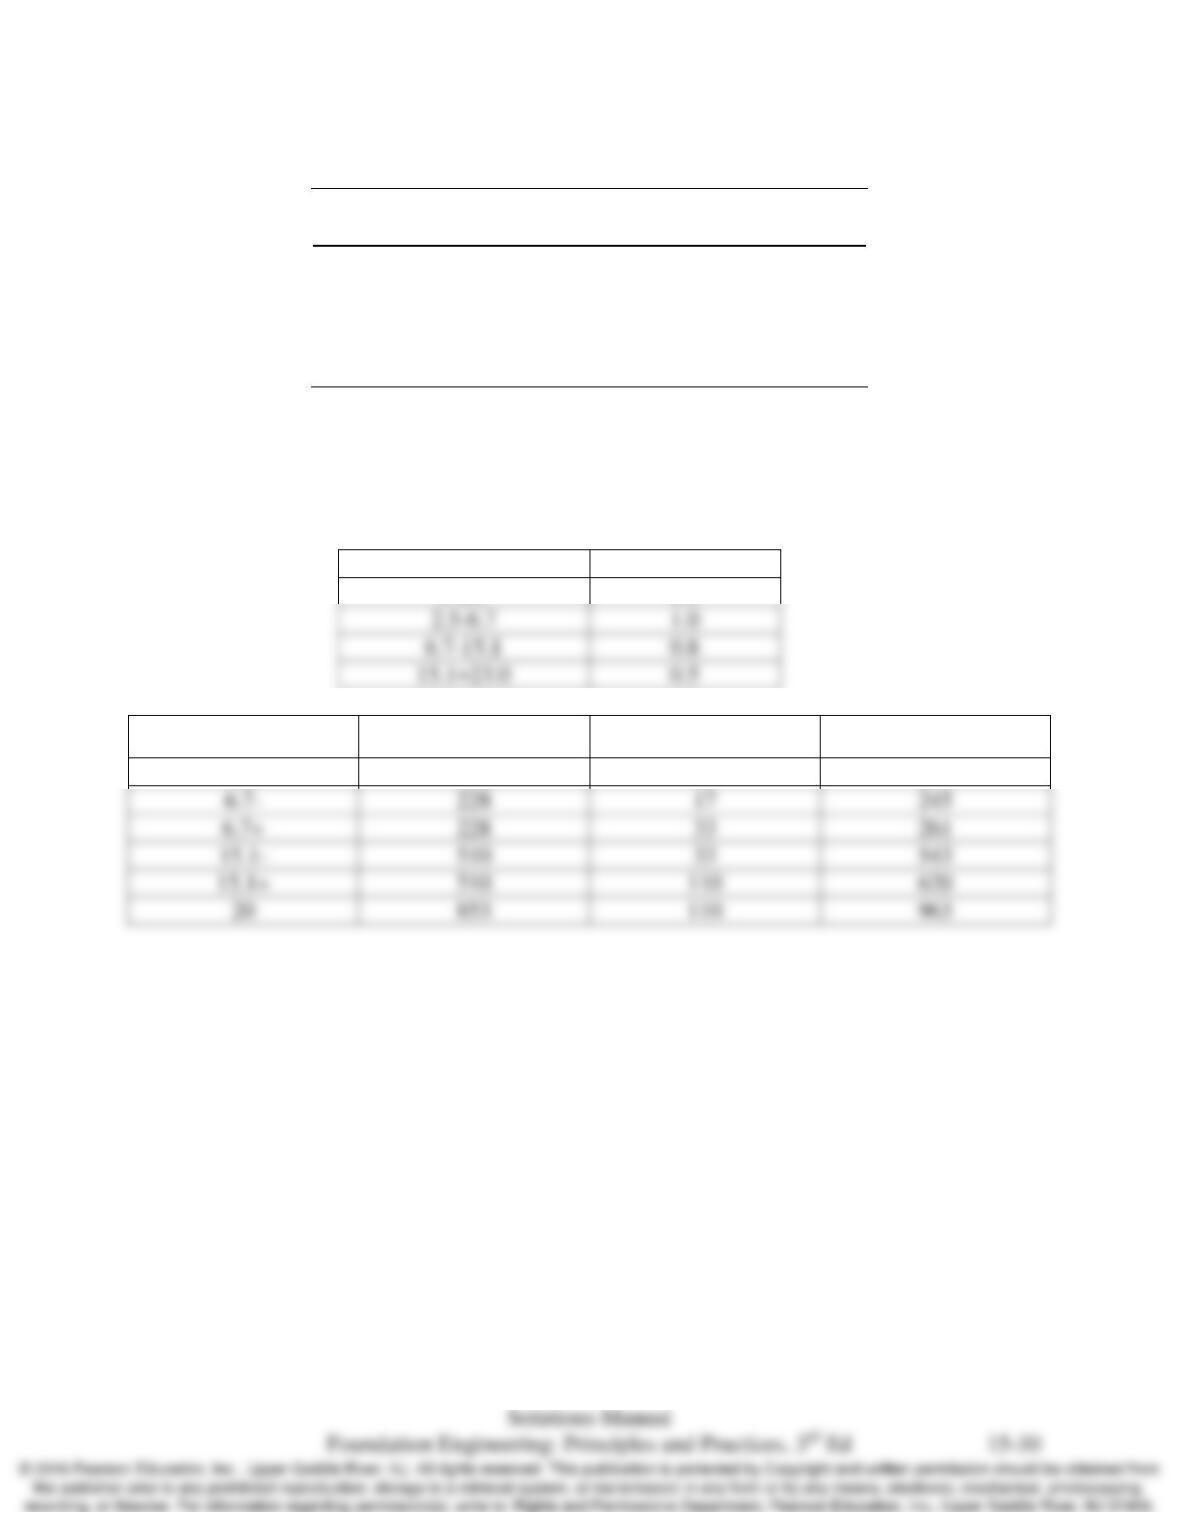
15.21 The soil profile beneath a proposed construction site is as follows:
Depth
(m)
Soil Classification
Undrained Shear
Strength, su (kPa)
0 – 2.5 Stiff silty clay (CL) 80
2.5 –6.7 Soft clay (CL) 15
6.7 –15.1 Medium clay (CL) 30
15.1 –23.0 Stiff clay (CL) 100
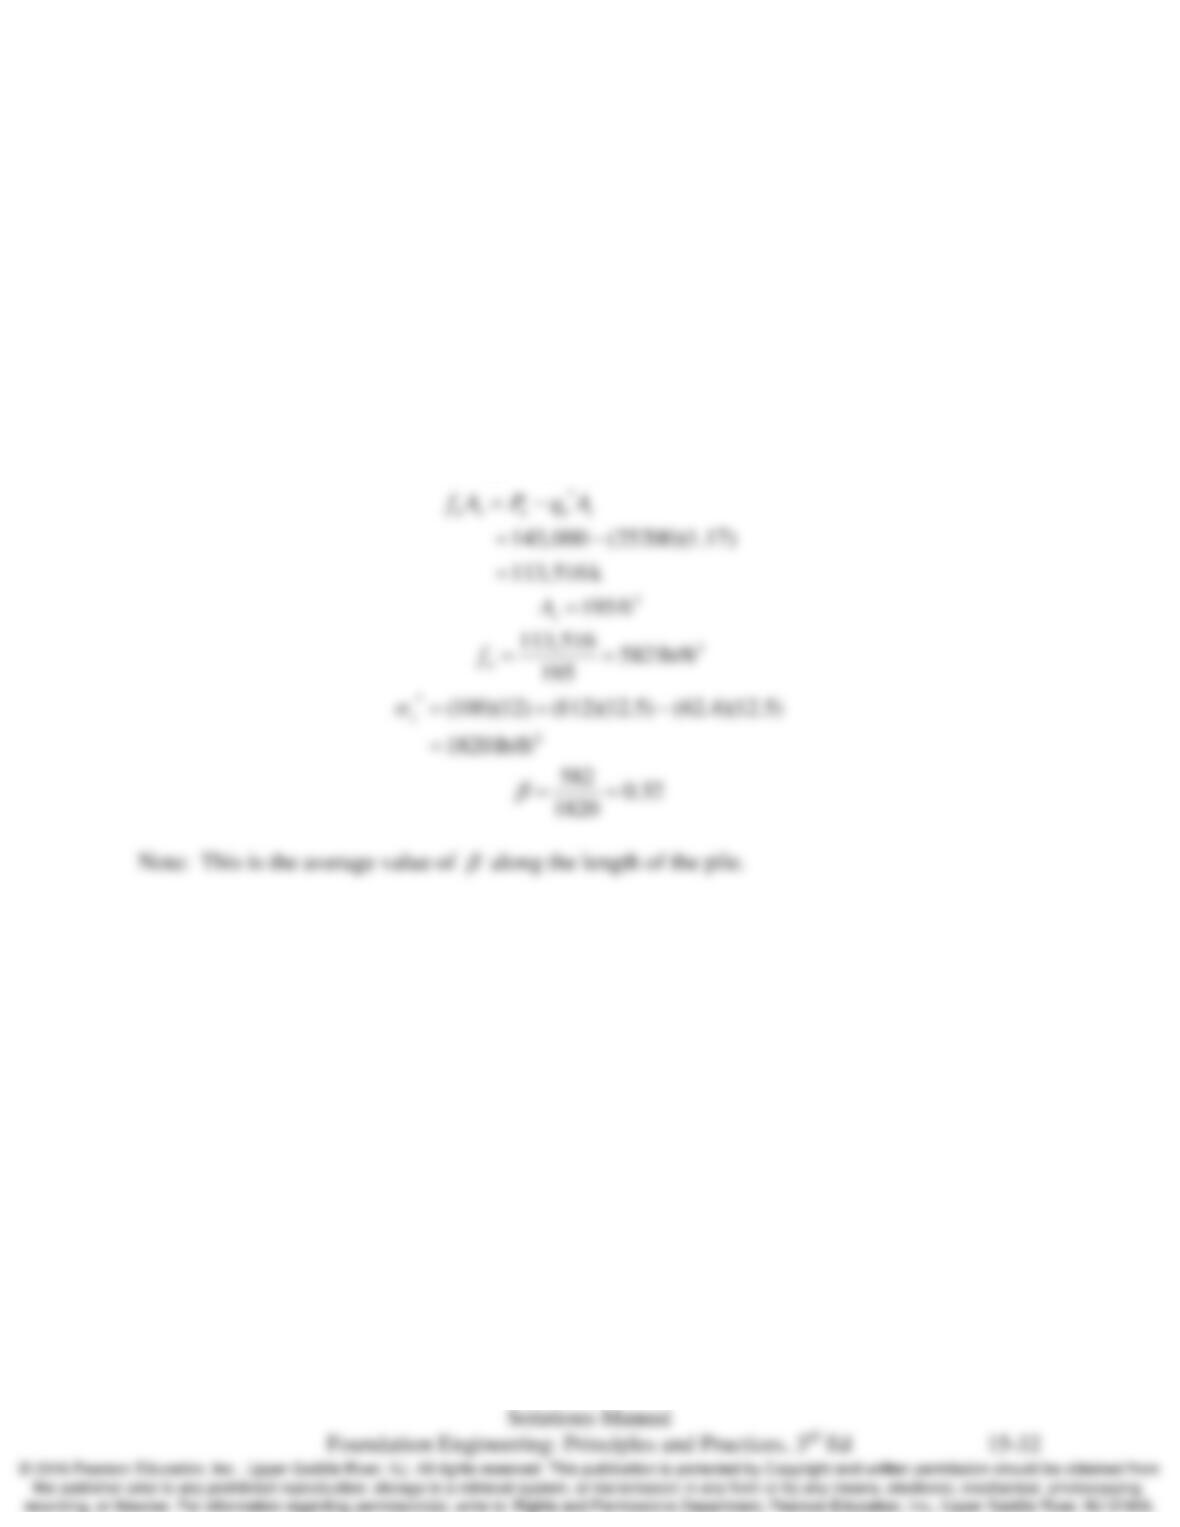
Develop a plot of allowable downward load capacity vs. depth for a 350 mm square concrete
pile. Consider pile embedment depths between 5 and 20 m and use a factor of safety of 3.0.
Solution
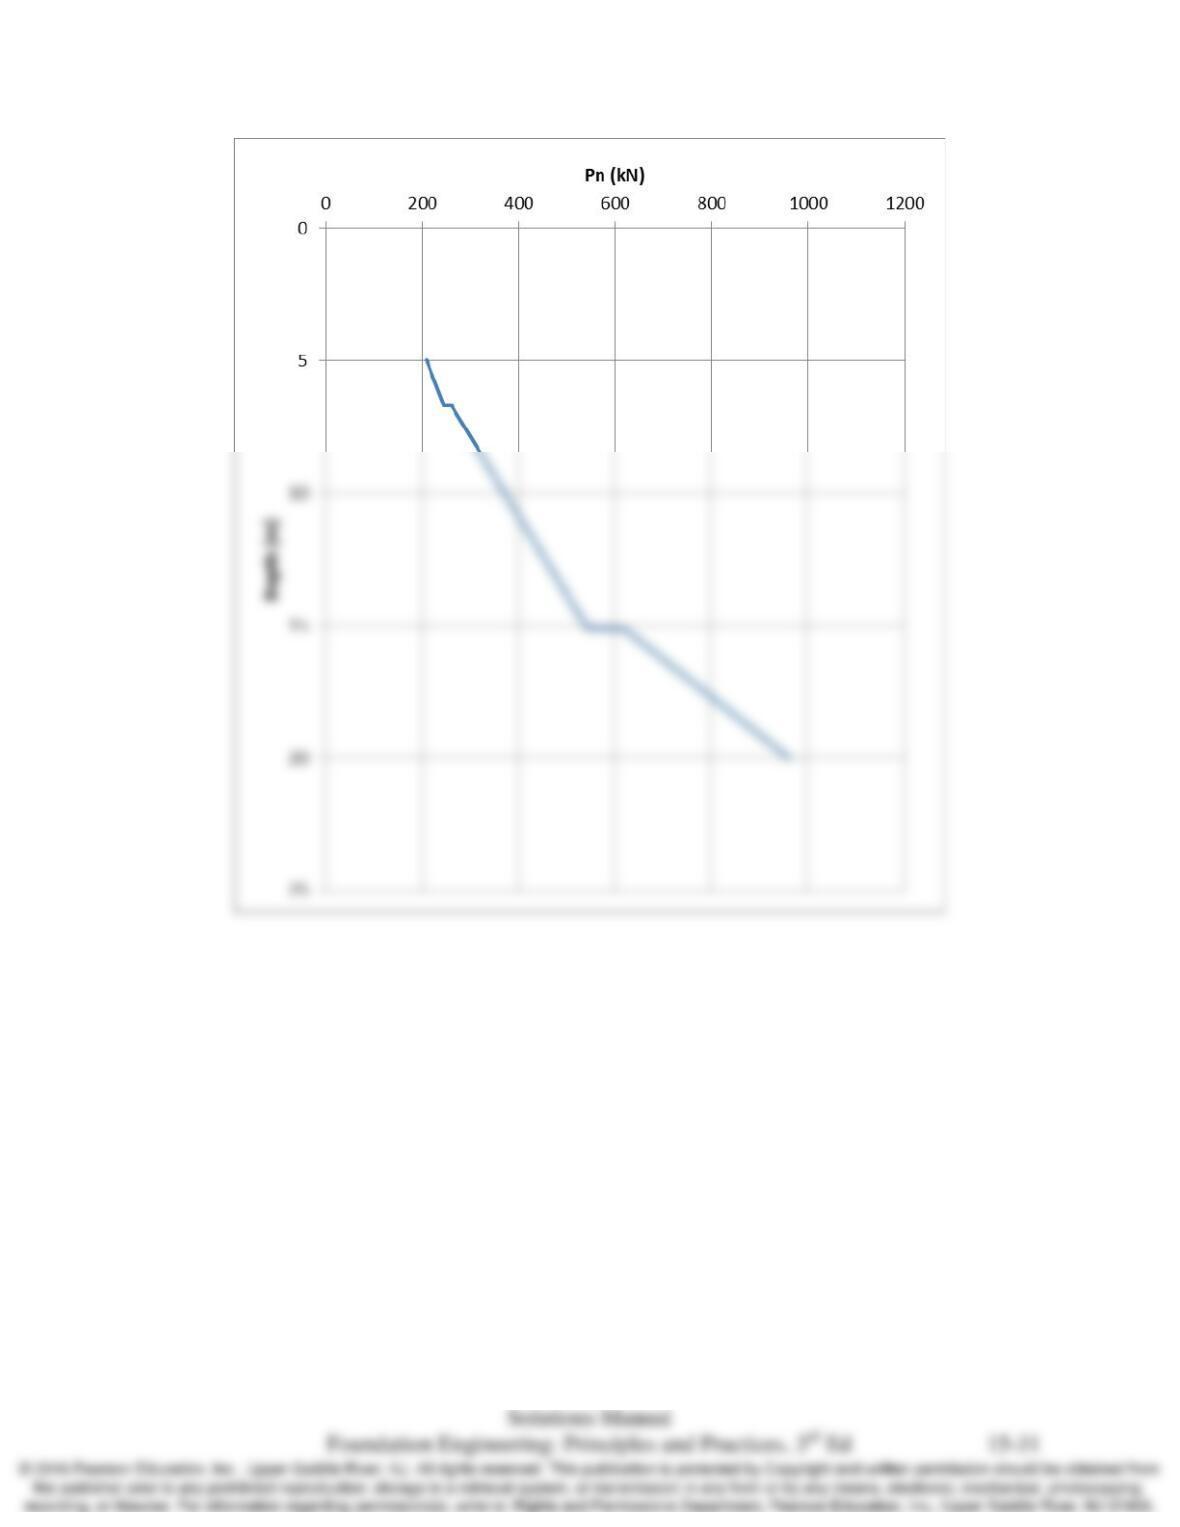
Use alpha method
Depth
α
0-2.5
0.5
Depth (ft)
ns
fA
nt
qA
′
n
P
5.0
192
17
209
6.7-
228
17
245
228
33
261
510
33
543
510
620
20
853
963
1.0
0.8
0.5
Chap.15 Driven Piles: Axial Load Capacity Based on Static Analysis Methods
Chap.15 Driven Piles: Axial Load Capacity Based on Static Analysis Methods
15.22 An HP 13×87 pile is embedded 45 ft into a clay. The unit weight of this soil is 100 lb/ft3 above
the groundwater table (which is 12 ft below the ground surface) and 112 lb/ft3 below. The soil in
the vicinity of the pile tip has an undrained shear strength of 2800 lb/ft2. According to a static
load test, the ultimate downward load capacity is 143 k.
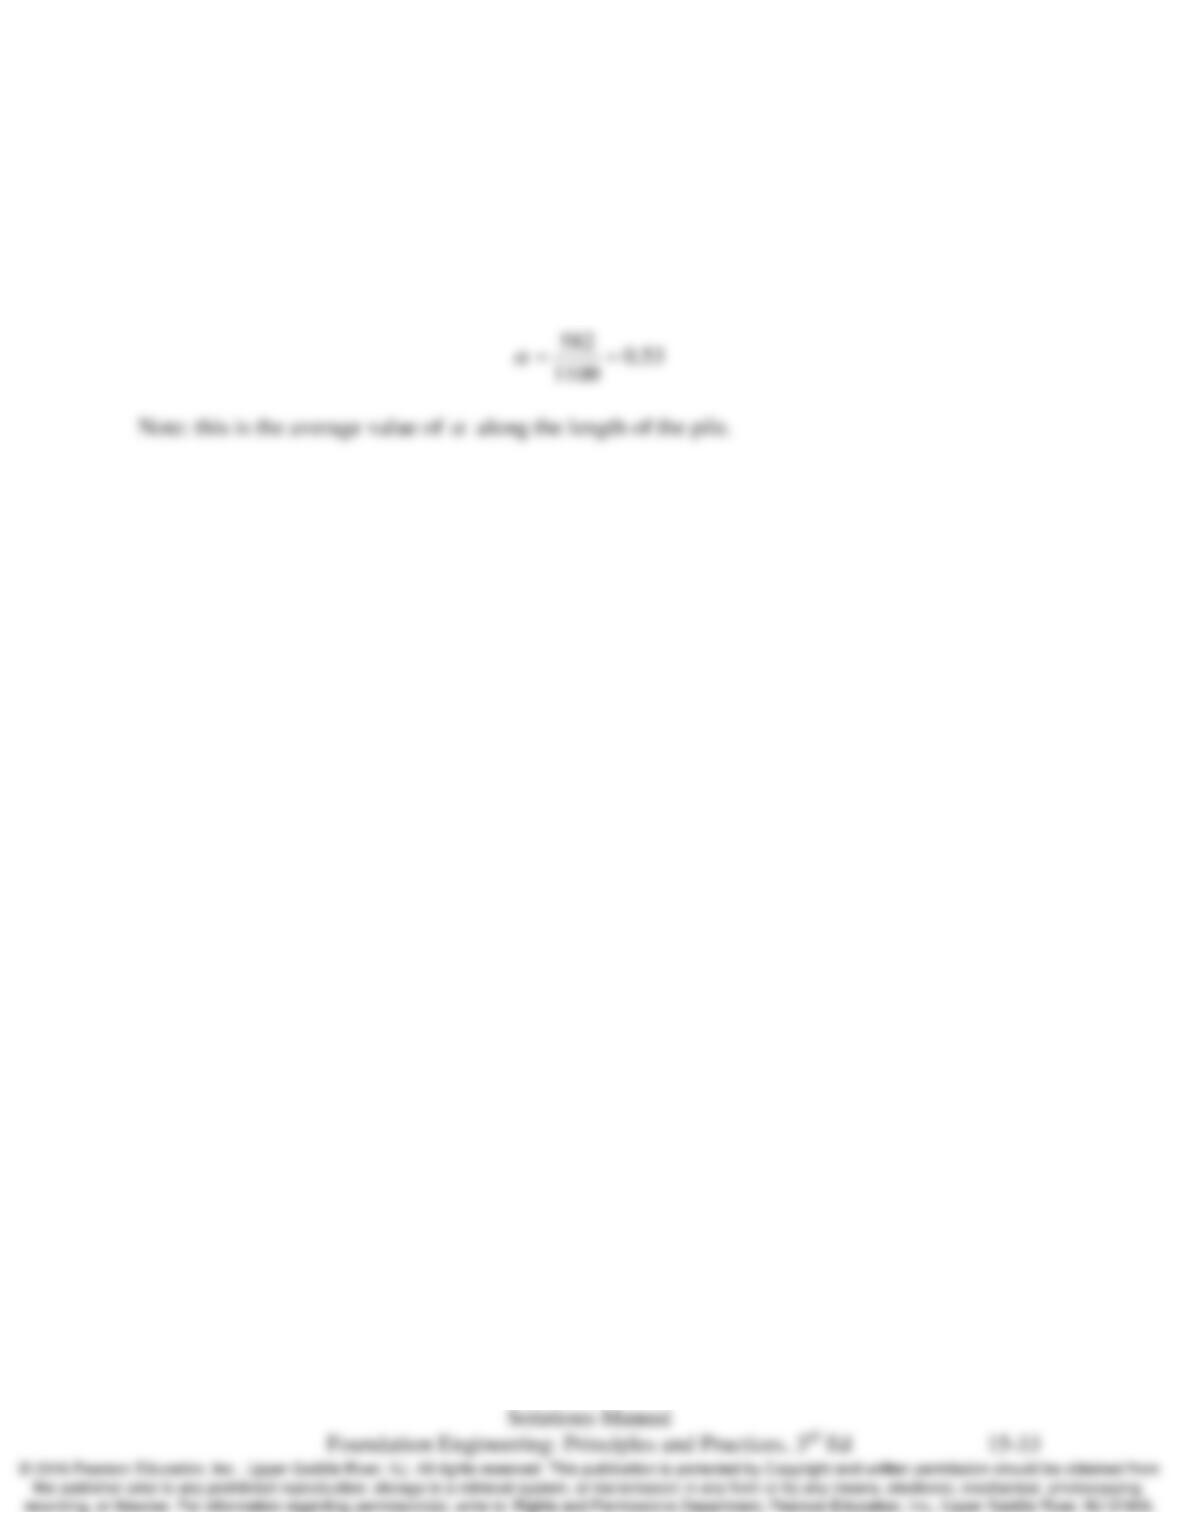
You wish to compute a site-specific β factor for HP 13×87 piles to be used in the design of other
piles at this site. Based on these test results, what is that β factor? See Table 21.1 for pile cross-
section dimensions
Hint: Compute β based on the average
z
σ
′
and the average measured fn.
Solution
9(2800) 25, 200
n
q′= =
Chap.15 Driven Piles: Axial Load Capacity Based on Static Analysis Methods
15.23 Using the information in Problem 15.22, compute a site-specific α factor. The average undrained
shear strength along the length of the pile is 1100 lb/ft2.
Solution
Using the results from Problem 15.22.
Chap.15 Driven Piles: Axial Load Capacity Based on Static Analysis Methods
15.24 A group of five closed-end steel pipe piles were driven into a sandy hydraulic fill at Hunter’s
Point in San Francisco, California (DiMillio, et al., 1987a). A single isolated pile also was
driven nearby. Each pile had an outside diameter of 10.75 in and a length of 30 ft. The group
piles were placed 3 to 4 ft on-center, and their pile cap was elevated above the ground surface.
The upper 4.5 ft of the soil was predrilled to a diameter larger than the piles, and the top of the
completed piles extended 5 ft above the ground surface. Therefore, only 20.5 ft of each pile was
in contact with the soil. No other predrilling or jetting was done.
An extensive subsurface investigation was conducted before these piles were installed. This
included SPT, CPT, DMT and other tests. The CPT results are shown in Figure 15.14.
(a) Using this CPT data, compute the ultimate downward load capacity of the single pile.
(b) Based on a pile load test, the ultimate downward load capacity of the single pile was 80 k
(based on Davisson’s method). Other methods of reducing the load test data gave ultimate
load capacities of 80 to 117 k. How accurate was your prediction?
(c) Using this CPT-based static load analysis, compute the ultimate downward load capacity of
the pile group.
(d) Based on a group pile load test, the ultimate downward load capacity of the pile group was
432 to 573 k, depending on the method of reducing the load test data. How accurate was
your prediction?
Solution
A range of solutions are possible. The CPT analysis could use the LCPC method, Eslami and