35
The equity contribution amounted to about one-fifth of the total purchase price, two-to-three times the average of
the 1980s. The higher equity contribution was necessary because of the poor track record of many of the deals put
together during the 1980s.
Cox Enterprises Offers to Take Cox Communications Private
In an effort to take the firm private, Cox Enterprises announced on August 3, 2004 a proposal to buy the remaining
38% of Cox Communications’ shares that they did not currently own for $32 per share. The deal is valued at $7.9
billion and represented a 16% premium to Cox Communication’s share price at that time. Cox Communications would
become a subsidiary of Cox Enterprises and would continue to operate as an autonomous business. In response to the
proposal, the Cox Communications Board of Directors formed a special committee of independent directors to consider
Discussion Questions::
1. Why did the board feel that it was appropriate to set up special committee of independent board directors?
2. Why does Cox Enterprises believe that the investment needed for growing its cable business is best done
through a private company structure?
Answer: Substantial levels of investment would result in increasing levels of depreciation and amortization
Financing Challenges in the Home Depot Supply Transaction
Buyout firms Bain Capital, Carlyle Group, and Clayton, Dubilier & Rice (CD&R) bid $10.3 billion in June 2007 to buy
Home Depot Inc.’s HD Supply business. HD Supply represented a collection of small suppliers of construction
products. Home Depot had announced earlier in the year that it planned to use the proceeds of the sale to pay for a
portion of a $22.5 billion stock buyback.
Three banks, Lehman Brothers, JPMorgan Chase, and Merrill Lynch agreed to provide the firms with a $4 billion
36
Case Study Discussion Questions:
1. Based on the information given it the case, determine the amount of the price reduction Home Depot accepted
for HD Supply and the amount of cash the three buyout firms put into the transaction?
2. Why did banks lower their lending standards in financing LBOs in 2006 and early 2007? How did the lax
standards contribute to their inability to sell the loans to investors? How did the inability to sell the loans once
made curtail their future lending?
Cerberus Capital Management Acquires Chrysler Corporation
According to the terms of the transaction, Cerberus would own 80.1 percent of Chrysler’s auto manufacturing and
financial services businesses in exchange for $7.4 billion in cash. Daimler would continue to own 19.9 percent of the
new business, Chrysler Holdings LLC. Of the $7.4 billion, Daimler would receive $1.35 billion while the remaining
$6.05 billion would be invested in Chrysler (i.e., $5.0 billion is to be invested in the auto manufacturing operation and
$1.05 billion in the finance unit). Daimler also agreed to pay to Cerberus $1.6 billion to cover Chrysler’s long-term debt
and cumulative operating losses during the four months between the signing of the merger agreement and the actual
closing. In acquiring Chrysler, Cerberus assumed responsibility for an estimated $18 billion in unfunded retiree pension
and medical benefits. Daimler also agreed to loan Chrysler Holdings LLC $405 million.
The transaction is atypical of those involving private equity investors, which usually take public firms private,
37
transferred to a fund managed by the UAW, with Goodyear contributing $1 billion in cash and Goodyear stock. By
transferring responsibility for these liabilities to the UAW, Chrysler believed that it would be able to cut in half the $30
dollar per hour labor cost advantage enjoyed by Toyota. Cerberus also expected to benefit from melding Chrysler’s
financial unit with Cerberus’s 51 percent ownership stake in GMAC, GM’s former auto financing business. By
consolidating the two businesses, Cerberus hoped to slash cost by eliminating duplicate jobs, combining overlapping
operations such as data centers and field offices, and increasing the number of loans generated by combining back-
office operations.
However, the 2008 credit market meltdown, severe recession, and subsequent free fall in auto sales threatened the
financial viability of Chrysler, despite an infusion of U.S. government capital, and its leasing operations as well as
Discussion Questions and Answers:
1. What were the motivations for this deal from Cerberus’ perspective? From Daimler’s perspective?
Answer: Daimler had demonstrated an inability to realize the originally projected synergies and believed that
the risks of continued ownership outweighed potential future profits. Moreover, relations with the UAW were
2. What are the risks to this deal’s eventual success? Be specific.
Answer: The risks include the assumption that the UAW will make significant concessions on retiree medical
3. Cite examples of economies of scale and scope?
Answer: Economies of scope refer to the use of a single operation to support multiple activities. For example,
combining HR and accounting departments to support both the Chrysler Financial and GMAC operations
4. Cerberus and Daimler will own 80.1% and 19.9% of Chrysler Holdings LLC, respectively. Why do you think
the two parties agreed to this distribution of ownership?
Answer: CCM will be able to consolidate the Chrysler operations with its GMAC operations for tax purposes
38
5. Which of the leading explanations of why deals sometimes fail to meet expectations best explains why the
combination of Daimler and Chrysler failed? Explain your answer.
6. The new company, Chrysler Holdings, is a limited liability company. Why do you think CCM chose this legal
structure over a more conventional corporate structure?
Pacific Investors Acquires California Kool in a Leveraged Buyout
Pacific Investors (PI) is a small private equity limited partnership with $3 billion under management. The objective of
the fund is to give investors at least a 30-percent annual average return on their investment by judiciously investing
these funds in highly leveraged transactions. PI has been able to realize such returns over the last decade because of its
focus on investing in industries that have slow but predictable growth in cash flow, modest capital investment
requirements, and relatively low levels of research and development spending. In the past, PI made several lucrative
investments in the contract packaging industry, which provides packaging for beverage companies that produce various
types of noncarbonated and carbonated beverages. Because of its commitments to its investors, PI likes to liquidate its
investments within four to six years of the initial investment through a secondary public offering or sale to a strategic
investor.
Following its past success in the industry, PI currently is negotiating with California Kool (CK), a privately owned
contract beverage packaging company with the technology required to package many types of noncarbonated drinks.
CK’s 2003 revenue and net income are $190.4 million and $5.9 million, respectively. With a reputation for effective
management, CK is a medium-sized contract packaging company that owns its own plant and equipment and has a
history of continually increasing cash flow. The company also has significant unused excess capacity, suggesting that
production levels can be increased without substantial new capital spending.
The owners of CK are demanding a purchase price of $70 million. This is denoted on the balance sheet (see Table
13-15 at the end of the case) as a negative entry in additional paid-in capital. This price represents a multiple of 11.8
times 2003’s net income, almost twice the multiple for comparable publicly traded companies. Despite the “rich”
As indicated on Table 13-15, the change in total liabilities plus shareholders’ equity (i.e., total sources of funds or
cash inflows) must equal the change in total assets (i.e., total uses of funds or cash outflows). Therefore, as shown in
the adjustments column, total liabilities increase by $47 million in total borrowings and shareholders’ equity declines by
$45 million (i.e., $25 million in preferred and common equity provided by investors less $70 million paid to CK
owners). The excess of sources over uses of $2 million is used to finance legal and accounting fees incurred in closing
the transaction. Consequently, total assets increase by $2 million and total liabilities plus shareholders’ equity increase
by $2 million between the pre- and postclosing balance sheets as shown in the adjustments column.hasi1 ΔTotal
assets = ΔTotal liabilities + ΔShareholders’ equity: $2 million = $47 million –$45 million = $2 million.
for sale) is expected to reach $8.5 million annually by 2010. Using the cost of capital method, the cost of equity
39
declines in line with the reduction in the firm’s beta as the debt is repaid from 26 percent in 2004 to 16.5 percent in
2010. In contrast, the adjusted present value method employs a constant unlevered COE of 17 percent.
The deal would appear to make sense from the standpoint of PI, since the projected average annual internal rates of
return (IRRs) for investors exceed PI’s minimum desired 30 percent rate of return in all scenarios considered between
2007 and 2009 (see Table 13-13). This is the period during which investors would like to “cash out.” The rates of return
scenarios are calculated assuming the business can be sold at different multiples of adjusted equity cash flow in the
year in which the business is assumed to be sold. Consequently, IRRs are calculated using the cash outflow (initial
equity investment in the business) in the first year offset by any positive equity cash flow from operations generated in
the first year, equity cash flows for each subsequent year, and the sum of equity cash flow in the year in which the
Discussion Questions
1. What criteria did Pacific Investors (PI) use to select California Kool (CK) as a target for an LBO? Why
were these criteria employed?
Answer: PI has been able to realize attractive financial returns over the last decade because of their focus
2. Describe how PI financed the purchase price. Speculate as why each source of financing was selected?
How did CK pay for feels incurred in closing the transaction?
Answer: PI financed the purchase price through a modest $3 million equity contribution, one-half of
which was provided by PI investors and the remainder by CK management, $22 million in preferred
stock, and $47 million in debt. The debt consists of a $12 million revolving bank loan, $20 million in
3. What are the advantages and disadvantages of using enterprise cash flow in valuing CK? In what might
EBITDA been a superior (inferior) measure of cash flow for valuing CK?
40
beyond a year to two will exceed depreciation which is based on the historical value of fixed assets.
4. Compare and contrast the Cost of Capital Method and the Adjusted Present Value Method of valuation.
Answer: From Exhibits 13-1 and 13-2 we see that the APV method provides an estimate of total present
value that is about 7 percent higher than the Cost of Capital Method (CCM). The APV method is
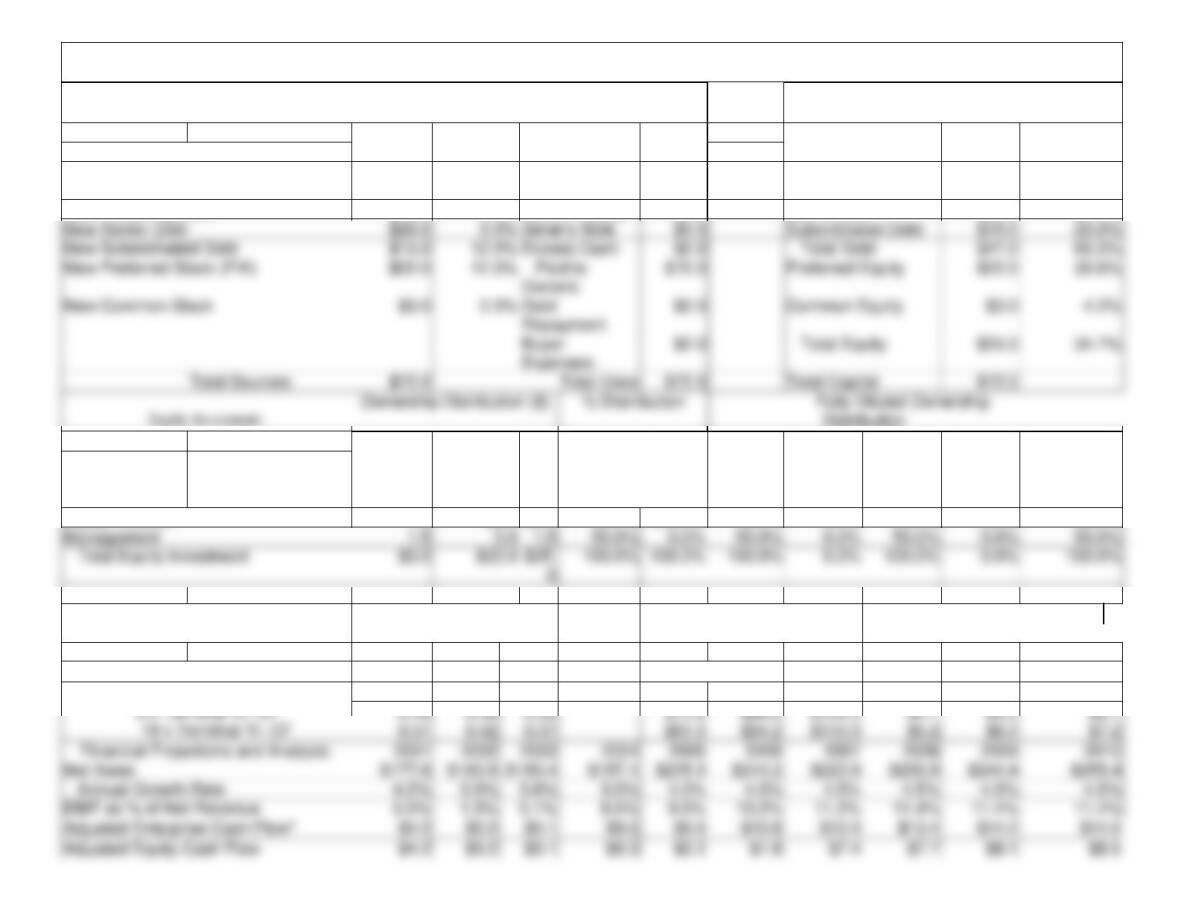
Table 13-11: California Kool Model Output Summary
Sources (Cash Inflows) and Uses (Cash Outflows) of Funds:
Pro Forma Capital Structure
Amount($
)
Interest
Rate (%)
Uses of Funds
Amount
($)
Form of Debt and
Equity
Market
Value
% of Total
Capital
Sources of Funds:
Cash From Balance Sheet
$0.0
0.0%
Cash to
Owners
$70.0
Revolving Loan
$12.0
16.7%
New Revolving Loan
$12.0
9.0%
Seller’s Equity
$0.0
Senior Debt
$20.0
27.8%
Common
Preferred
Tota
l
Common
Preferre
d
Common
Warrants
Pre–
Option
Ownershi
p
Perform.
Options
Fully Dil.
Ownership
Equity Investor
1.5
22.0
23.5
50.0%
100.0%
50.0%
0.0%
50.0%
0.0%
50.0%
Management
1.5
1.5
50.0%
0.0%
50.0%
0.0%
50.0%
0.0%
50.0%
$3.0
100.0%
Internal Rates of Return:
Total Investor Return (%)
Equity Investor Investment
Gain ($)
Management Investment Gain ($)
2007
2008
2009
2007
2008
2009
2007
2008
2009
Multiple of Adjusted Equity Cash Flow1
0.46
0.39
0.35
$73.8
$86.6
$4.7
$5.5
$6.7
0.51
0.42
0.37
$81.0
$94.2
$5.2
$6.0
$7.2
2002
2003
2006
2007
2008
2009
8 x Terminal Yr. CF
0.42
0.35
0.33
$66.6
$78.9
$96.0
$4.3
$5.0
$6.1
New Senior Debt
$20.0
9.0%
Seller’s Note
$0.0
Subordinated Debt
$15.0
20.8%
New Subordinated Debt
$15.0
12.0%
Excess Cash
$0.0
$47.0
65.3%
New Preferred Stock (PIK)
$70.0
Preferred Equity
$22.0
30.6%
New Common Stock
$3.0
0.0%
Debt
Repayment
Common Equity
Expenses
Total Sources
$72.0
Total Uses
$72.0
Total Capital
$72.0
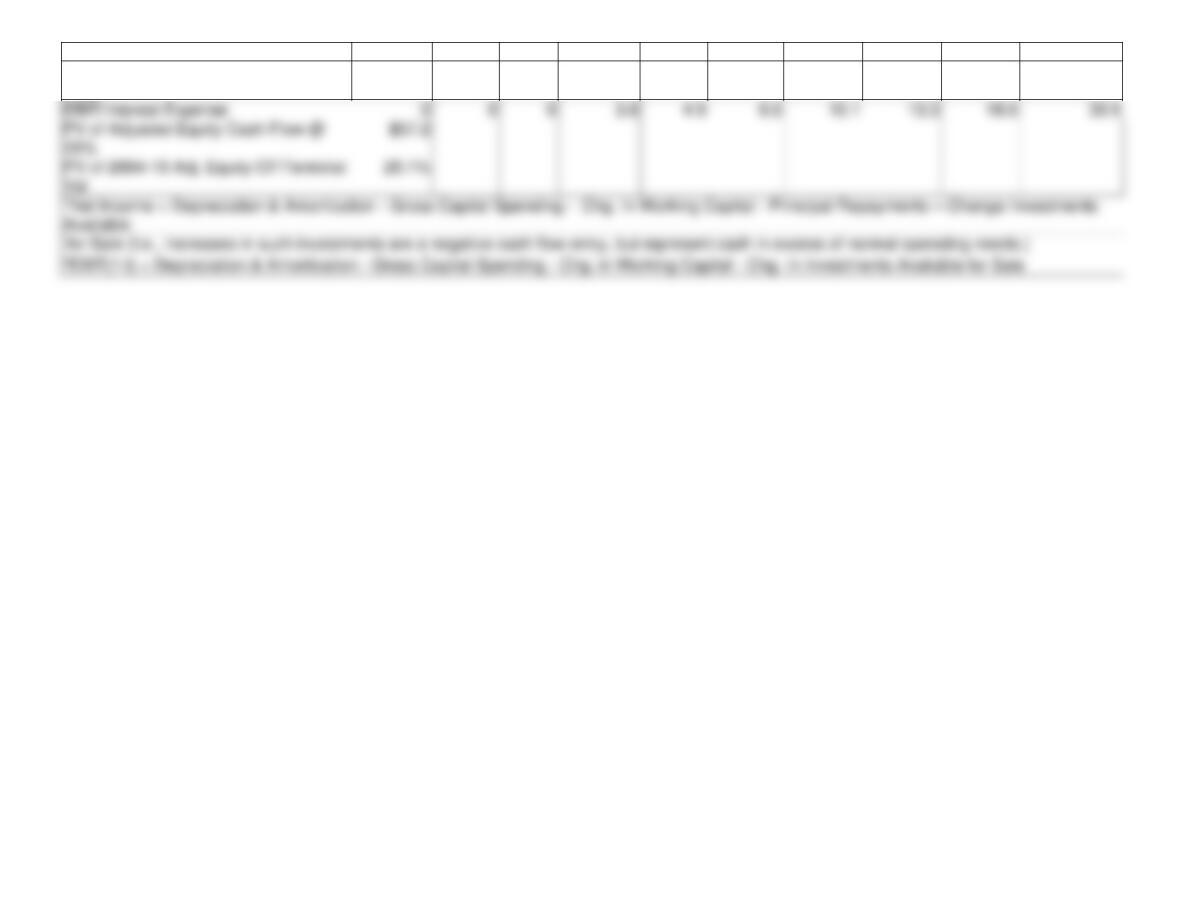
42
Total Debt Outstanding
0
0
$47.0
$39.5
$31.5
$23.8
$19.2
$14.3
$8.8
$2.7
Total Debt/Adjusted Enterprise Cash
Flow
0.0
0.0
NA
4.1
3.3
2.2
1.5
1.1
0.6
0.2
EBIT/Interest Expense
0
0
10.1
13.3
18.6
30.9
Val
44
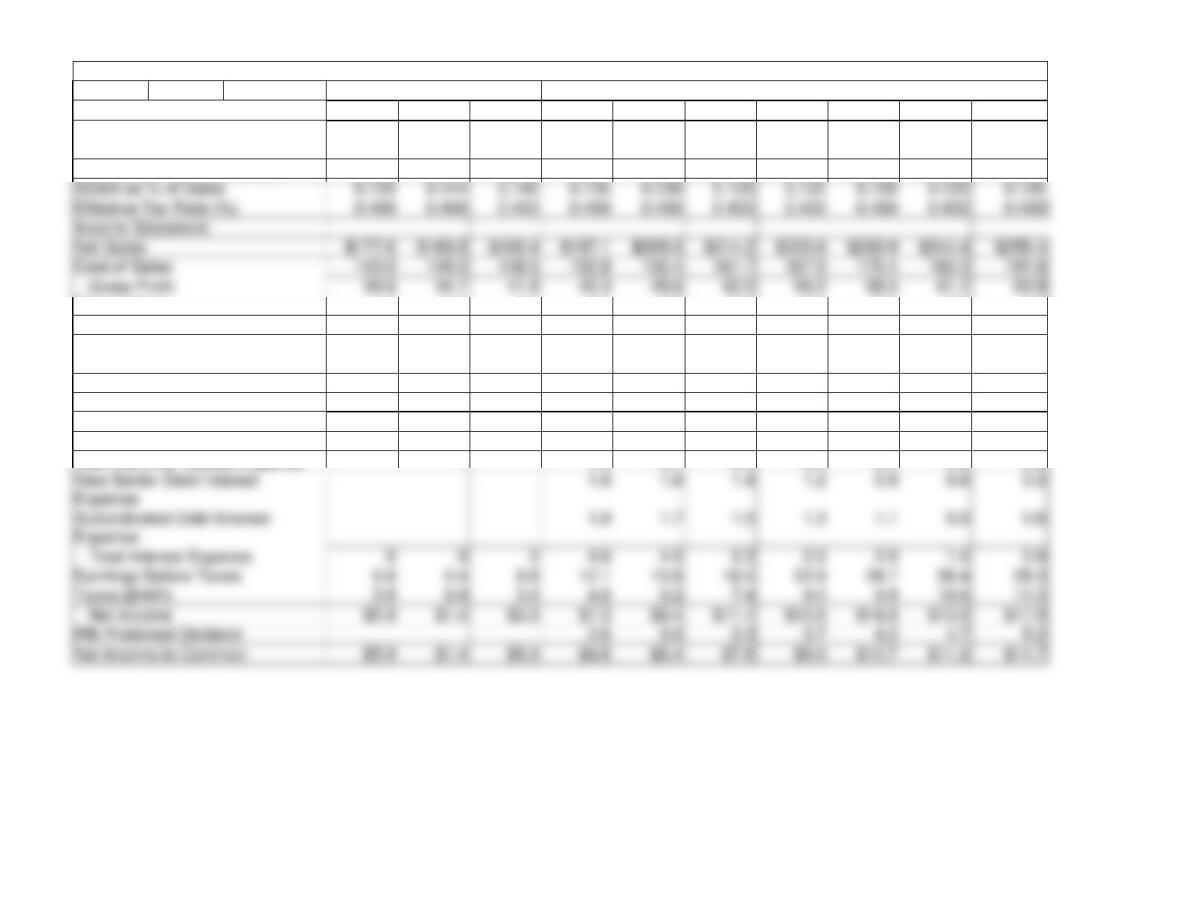
Table 13-12. California Kool Income Statement and Forecast Assumptions
Historical Period
Projections: Twelve Months Ending December 31,
Income Statement Assumptions:
2001
2002
2003
2004
2005
2006
2007
2008
2009
2010
Net Sales Growth
(%)
0.042
0.033
0.038
0.035
0.040
0.045
0.045
0.045
0.045
0.045
Cost of Sales as % of Sales
0.805
0.814
0.780
0.765
0.758
0.755
0.750
0.750
0.750
0.750
Depreciation
1.3
5.4
5.1
2.4
2.9
3.4
3.5
3.7
3.8
4.0
Amortization of Financing Fees
0.5
0.5
0.5
0.5
Total Depreciation &
Amortization
1.3
5.4
5.1
2.9
3.4
3.9
4.0
3.7
3.8
4.0
SG&A
23.6
26.4
27.0
26.6
26.6
26.8
26.9
28.1
29.3
30.7
Management Fee
0.1
0.1
0.1
0.1
0.1
0.1
0.1
Operating Income (EBIT)
9.7
2.3
9.7
16.7
19.5
21.7
25.0
26.6
27.8
29.1
(Interest Income)
0.1
0.1
0.1
0.0
0.1
0.1
0.1
0.1
0.1
0.1
New Revolver Interest Expense
1.0
0.7
0.4
0.0
0.0
0.0
0.0
1.8
1.6
1.4
1.2
0.9
0.6
0.3
Expense
4.6
4.0
3.3
2.5
2.0
1.5
0.9
Earnings Before Taxes
9.8
2.4
9.8
12.1
15.6
18.5
22.6
24.7
26.4
28.3
Taxes @40%
3.9
0.9
3.9
4.8
6.2
7.4
9.0
9.9
10.6
11.3
$5.9
$1.4
$5.9
$7.3
$9.4
$11.1
$13.6
$14.8
$15.9
$17.0
PIK Preferred Dividend
2.6
3.0
3.3
3.7
4.2
4.7
5.2
Net Income to Common
$5.9
$1.4
$5.9
$4.6
$6.4
$7.8
$9.9
$10.7
$11.2
$11.7
SG&A as % of Sales
0.133
0.144
0.142
0.135
0.130
0.125
0.120
0.120
0.120
0.120
Effective Tax Rate (%)
0.400
0.400
0.400
0.400
0.400
0.400
0.400
0.400
0.400
0.400
Income Statement:
Net Sales
Cost of Sales
143.0
149.3
148.5
150.8
155.4
161.7
167.9
175.4
183.3
191.6
34.6
34.1
41.9
46.3
49.6
52.5
56.0
58.5
61.1
63.9
45
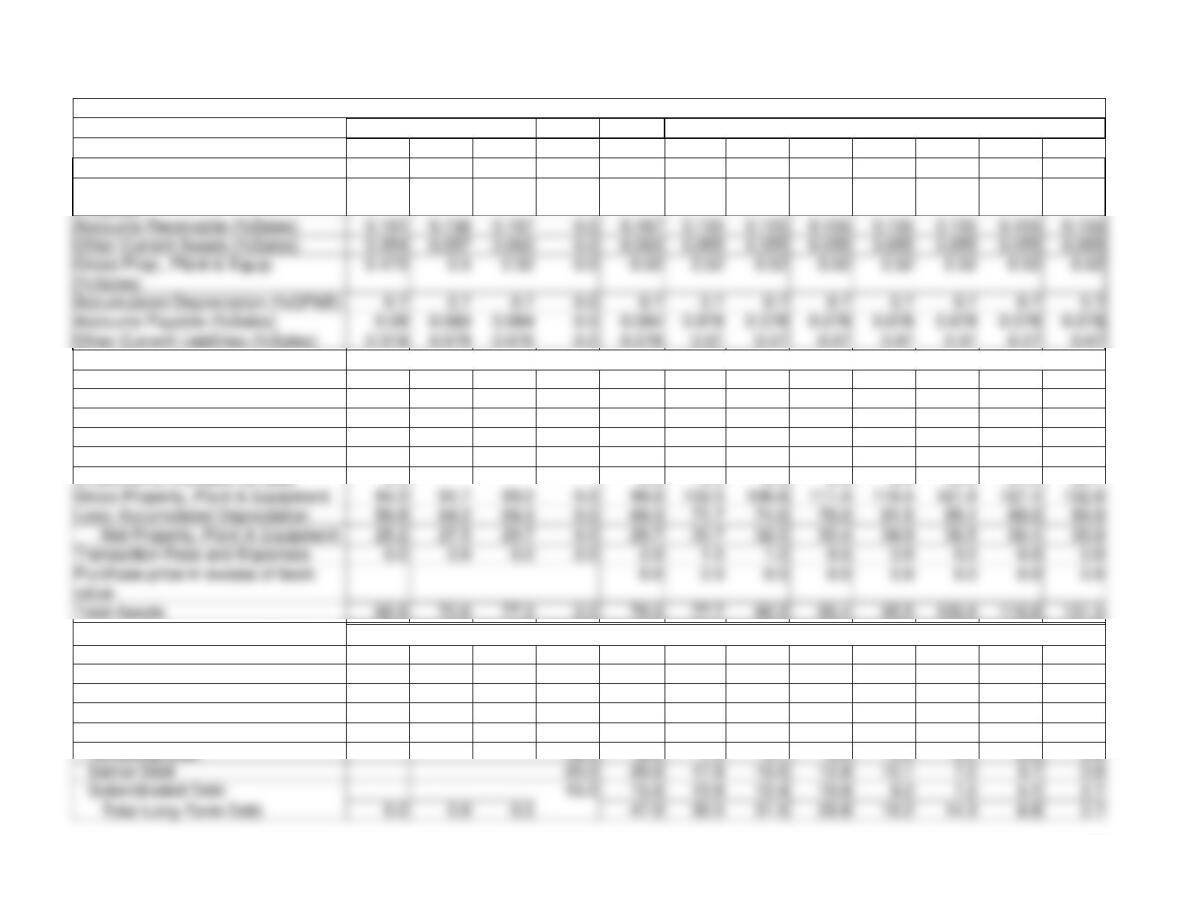
Table 13-13. California Kool Balance Sheet and Forecast Assumptions
Historical Period
Adjust.
Closing
Projections: Twelve Months Ended December,
2001
2002
2003
2003
2004
2005
2006
2007
2008
2009
2010
Balance Sheet Assumptions:
Cash & Marketable Securities
(%Sales)
0.02
0.02
0.02
0.0
0.02
0.02
0.02
0.02
0.02
0.02
0.02
0.02
Assets:
($Millions)
Current Assets
Cash and Marketable Securities
3.6
3.7
3.8
0.0
3.8
4.1
4.3
4.5
4.7
4.9
5.1
5.1
Accounts Receivable
28.6
29.0
31.8
0.0
31.8
30.6
31.8
33.2
34.7
36.3
37.9
39.6
Other Current Assets
9.6
10.5
12.0
0.0
12.0
10.8
11.3
11.8
12.3
12.9
13.4
14.0
Total Current Assets
41.7
43.1
47.6
0.0
47.6
45.5
47.3
49.5
51.7
54.0
56.4
58.8
Investments Available for Sale
0.0
0.0
0.0
0.0
0.0
8.9
16.3
24.2
32.7
Gross Property, Plant & Equipment
84.0
91.7
99.0
0.0
99.0
Less: Accumulated Depreciation
58.8
64.2
69.3
0.0
69.3
71.7
74.6
78.0
81.5
85.1
89.0
93.0
Net Property, Plant & Equipment
25.2
27.5
29.7
0.0
29.7
30.7
32.0
33.4
34.9
36.5
38.1
39.8
Transaction Fees and Expenses
0.0
0.0
0.0
2.0
2.0
1.5
1.0
0.5
0.0
0.0
0.0
0.0
value
Liabilities & Shareholders’ Equity
($Millions)
Current Liabilities:
Accounts Payable
14.2
15.2
16.0
0.0
16.0
15.4
16.0
16.7
17.5
18.2
19.1
19.9
Other Current Liabilities
13.1
14.5
14.5
0.0
14.5
13.8
14.3
15.0
15.7
16.4
17.1
17.9
Total Current Liabilities
27.4
29.7
30.5
0.0
30.5
29.2
30.3
31.7
33.1
34.6
36.2
37.8
Long-Term Debt:
Revolving Loan
12.0
12.0
7.9
3.7
0.0
0.0
0.0
0.0
0.0
Accounts Receivable (%Sales)
0.0
0.167
Other Current Assets (%Sales)
0.0
0.063
Gross Prop., Plant & Equip.
0.5
0.52
0.0
0.52
0.52
0.52
0.52
0.52
0.52
0.52
0.52
Accumulated Depreciation (%GP&E)
0.7
0.7
0.7
0.0
0.7
0.7
0.7
0.7
0.7
0.7
0.7
0.7
Accounts Payable (%Sales)
0.08
0.0
0.084
Other Current Liabilities (%Sales)
0.0
0.076
0.07
0.07
0.07
0.07
0.07
0.07
0.07
46
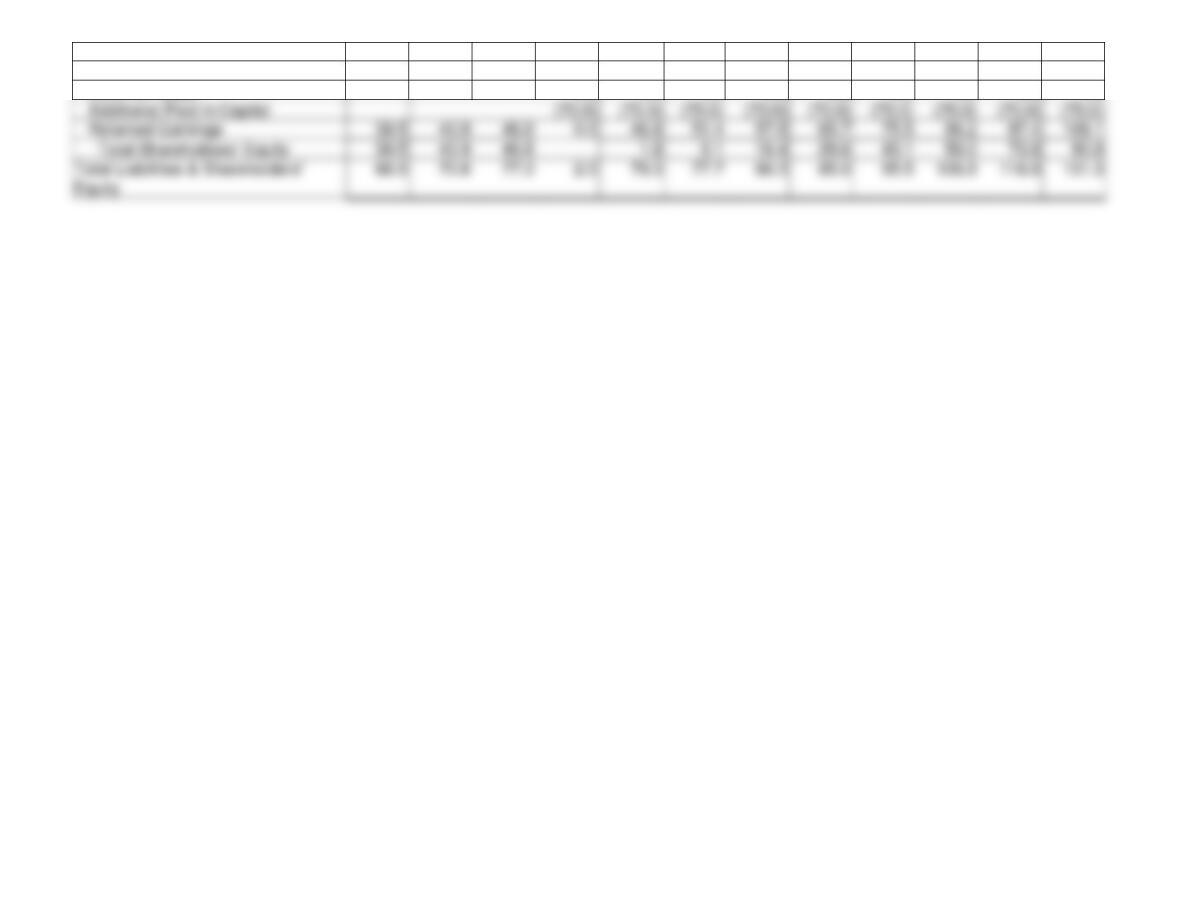
Shareholders’ Equity
Preferred Stock (PIK)
22.0
22.0
24.6
27.6
30.9
34.6
38.8
43.4
48.6
Common Stock
3.0
3.0
3.0
3.0
3.0
3.0
3.0
3.0
3.0
Additional Paid in Capital
Retained Earnings
39.5
40.9
46.8
0.0
46.8
51.4
57.8
65.7
75.5
97.4
Total Shareholders’ Equity
39.5
40.9
46.8
1.8
9.1
18.4
29.6
43.1
58.0
73.8
90.8
Equity
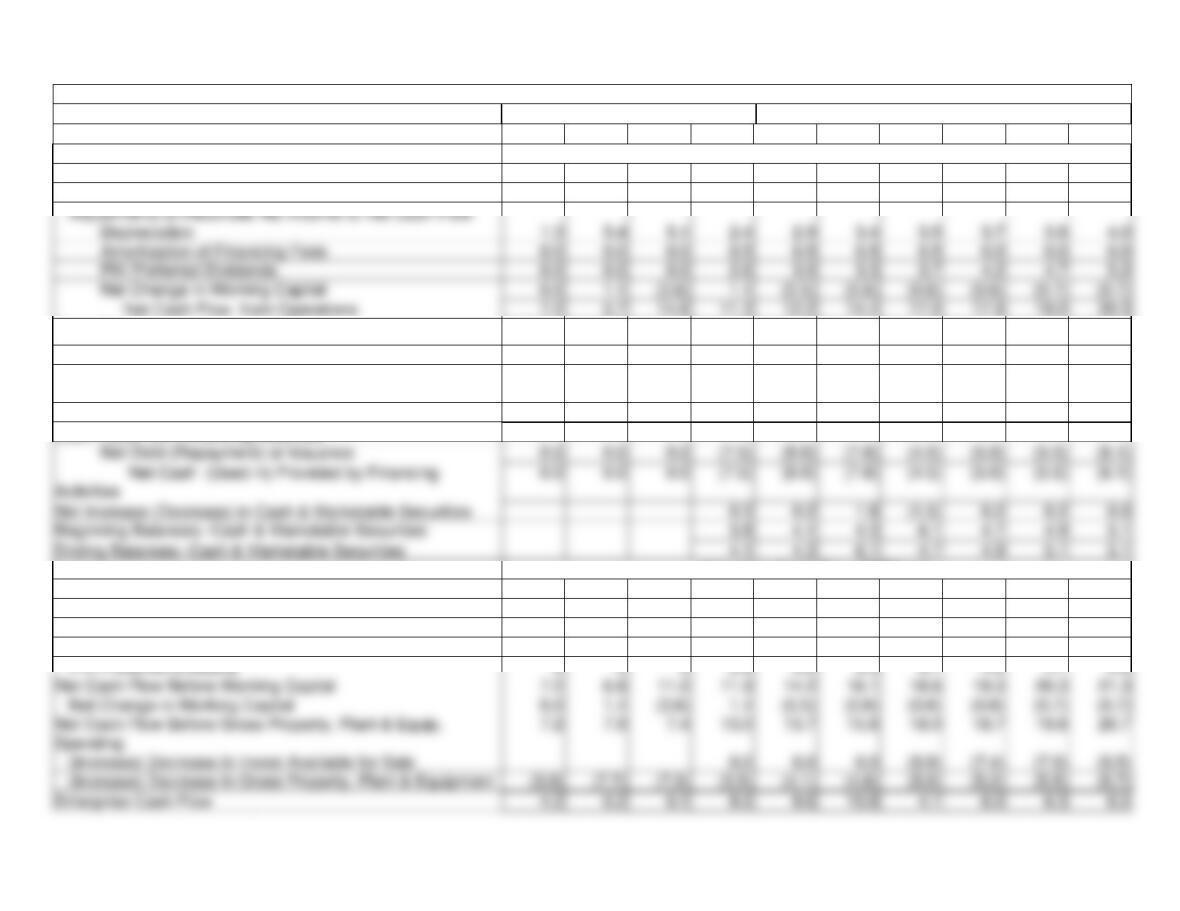
Table 13-14: California Kool Cash Flow Statement and Analysis
Historical Data
Projections: Twelve Months Ended December 31,
2001
2002
2003
2004
2005
2006
2007
2008
2009
2010
GAAP Cash Flow ($Millions)
Cash Flow from Operating Activities:
Net Income Available to Common Equity
5.9
1.4
5.9
4.6
6.4
7.8
9.9
10.7
11.2
11.7
Cash Flow from Investing Activities:
(Increase) Decrease in Investments Available for Sale.
0.0
0.0
0.0
(8.9)
(7.4)
(7.9)
(8.5)
(Increase) Decrease in Gross Property, Plant &
Equipment
(3.5)
(4.1)
(4.8)
(5.0)
(5.2)
(5.5)
(5.7)
Net Cash Used in Investments
0.0
0.0
0.0
(3.5)
(4.1)
(4.8)
(13.9)
(12.7)
(13.3)
(14.2)
Cash Flows from Financing Activities:
Net Debt (Repayment) or Issuance
0.0
0.0
0.0
(7.5)
(8.0)
(7.8)
(5.0)
(5.5)
(6.1)
Net Cash (Used in) Provided by Financing
(7.5)
(8.0)
(7.8)
(4.5)
(5.0)
(5.5)
(6.1)
Net Increase (Decrease) in Cash & Marketable Securities
0.3
0.2
1.8
(1.5)
0.2
0.2
0.0
Beginning Balances—Cash & Marketable Securities
3.8
4.1
4.3
6.1
4.7
4.9
5.1
Ending Balances—Cash & Marketable Securities
4.1
4.3
6.1
4.7
4.9
5.1
5.1
Valuation Cash Flow ($Millions)
Net Income to Available to Common Equity
5.9
1.4
5.9
4.6
6.4
7.8
9.9
10.7
11.2
11.7
After-Tax Net Interest Expense (Income)
0
0
0
1.7
1.4
1.2
1.0
0.8
0.6
0.4
Depreciation
1.3
5.4
5.1
2.4
2.9
3.4
3.5
3.7
3.8
4.0
Amortization of Financing Fees
0
0
0
0.5
0.5
0.5
0.5
0
0
0
PIK Preferred Dividend
0
0
0
2.6
3.0
3.3
3.7
4.2
4.7
5.2
Net Cash Flow Before Working Capital
7.2
6.8
11.0
11.9
14.2
16.1
18.6
19.3
20.3
21.3
Net Change in Working Capital
0.0
1.1
(3.6)
1.1
(0.6)
(0.6)
(0.6)
(0.7)
(0.7)
Adjustments to Reconcile Net Income to Net Cash Flow
Depreciation
1.3
5.4
5.1
2.4
2.9
3.4
3.5
3.7
3.8
4.0
Amortization of Financing Fees
0.0
0.0
0.0
0.5
0.5
0.5
0.5
0.0
0.0
0.0
PIK Preferred Dividends
0.0
0.0
0.0
2.6
3.0
3.3
3.7
4.2
4.7
5.2
Net Change in Working Capital
0.0
1.1
1.1
(0.5)
(0.6)
(0.6)
(0.6)
(0.7)
(0.7)
Net Cash Flow from Operations
7.2
5.7
14.6
11.3
12.2
14.4
17.0
17.9
19.0
20.3
48
After-Tax Net Interest Expense (Income)
0.0
0.0
0.0
1.7
1.4
1.2
1.0
0.8
0.6
0.4
Net Debt (Repayments) or Issuance
0.0
0.0
0.0
(7.5)
(8.0)
(7.8)
(4.5)
(5.0)
(5.5)
(6.0)
Equity Cash Flow
4.2
0.2
0.1
0.3
0.2
1.8
(1.5)
0.2
0.2
0.0
Dividends on Common Stock
0.0
0.0
0.0
0.0
0.0
0.0
0.0
0.0
0.0
0.0
Net Stock (Repurchase) or Issuance
0.0
0.0
0.0
0.0
0.0
0.0
0.0
0.0
0.0
0.0
Net Increase (Decrease) in Cash Balance
4.2
0.2
0.1
0.3
0.2
1.8
(1.5)
0.2
0.2
0.0
Beginning Balances—Cash & Marketable Securities
3.6
3.8
3.9
4.2
4.4
6.2
4.8
5.0
5.2
Ending Balances—Cash & Marketable Securities
3.6
3.8
3.9
4.2
4.4
6.2
4.8
5.0
5.2
5.2