0 0.5 1
x1ix1,
⎣
⎦
⎜
⎣
⎦
γ2i
y2iΦ2i
⋅Pi
⋅
x2iPsat2
⋅
:=Φ2iexp
B22 PiPsat2
−
()
⋅Piy1i
()
2
⋅δ
12
⋅+
⎡
⎣
⎤
⎦
RT⋅
⎡
⎢
⎢
⎣
⎤
⎥
⎥
⎦
:=
559
Guess:Guess:Guess:Define Z for the liquid (Zl)Define Z for the liquid (Zl)Define Z for the liquid (Zl)
Eq. (3.52)
Given
zv 0.9:=zv 0.9:=zv 0.9:=
Guess:Guess:Guess:Define Z for the vapor (Zv)Define Z for the vapor (Zv)Define Z for the vapor (Zv)
⎜
⎜
⎜
⎜
⎜
⎜
Define I for liquid (Il) and vapor (Iv)Define I for liquid (Il) and vapor (Iv)Define I for liquid (Il) and vapor (Iv)
Zl TrPr
,
()
Find zl():=
zl 0.2<zl 0.2<zl 0.2<
To find liquid root, restrict search for zl to values less than 0.2, To find liquid root, restrict search for zl to values less than 0.2, To find liquid root, restrict search for zl to values less than 0.2,
zl βTrPr
,
()
zl εβ TrPr
,
()
⋅+
()
zl σβ TrPr
,
()
⋅+
()
⋅1βTrPr
,
()
+zl−
qT
r
()
βTrPr
,
()
⋅
⎛
⎜
⎝
⎞
⎠
⋅+=zl βTrPr
,
()
zl εβ TrPr
,
()
⋅+
()
zl σβ TrPr
,
()
⋅+
()
⋅1βTrPr
,
()
+zl−
qT
r
()
βTrPr
,
()
⋅
⎛
⎜
⎝
⎞
⎠
⋅+=zl βTrPr
,
()
zl εβ TrPr
,
()
⋅+
()
zl σβ TrPr
,
()
⋅+
()
⋅1βTrPr
,
()
+zl−
qT
r
()
βTrPr
,
()
⋅
⎛
⎜
⎝
⎞
⎠
⋅+=
Eq. (3.56)
Given
zl 0.01:=zl 0.01:=zl 0.01:=
For Redlich/Kwong EOS:For Redlich/Kwong EOS:For Redlich/Kwong EOS:
Tr0.614=Tr
T
Tc
:=Tr
T
Tc
:=Tr
T
Tc
:=TT
n
:=
Tn189.4K:=Tn189.4K:=Tn189.4K:=Pc61.39bar:=Pc61.39bar:=Pc61.39bar:=Tc308.3K:=Tc308.3K:=Tc308.3K:=
Acetylene:Acetylene:Acetylene:(a)(a)(a)14.9
Table 3.1Table 3.1Table 3.1
Ψ0.42748:=Ψ 0.42748:=Ψ 0.42748:=Ω 0.08664:=Ω 0.08664:=Ω 0.08664:=ε 0:=ε 0:=ε 0:=σ 1:=σ 1:=σ 1:=
560
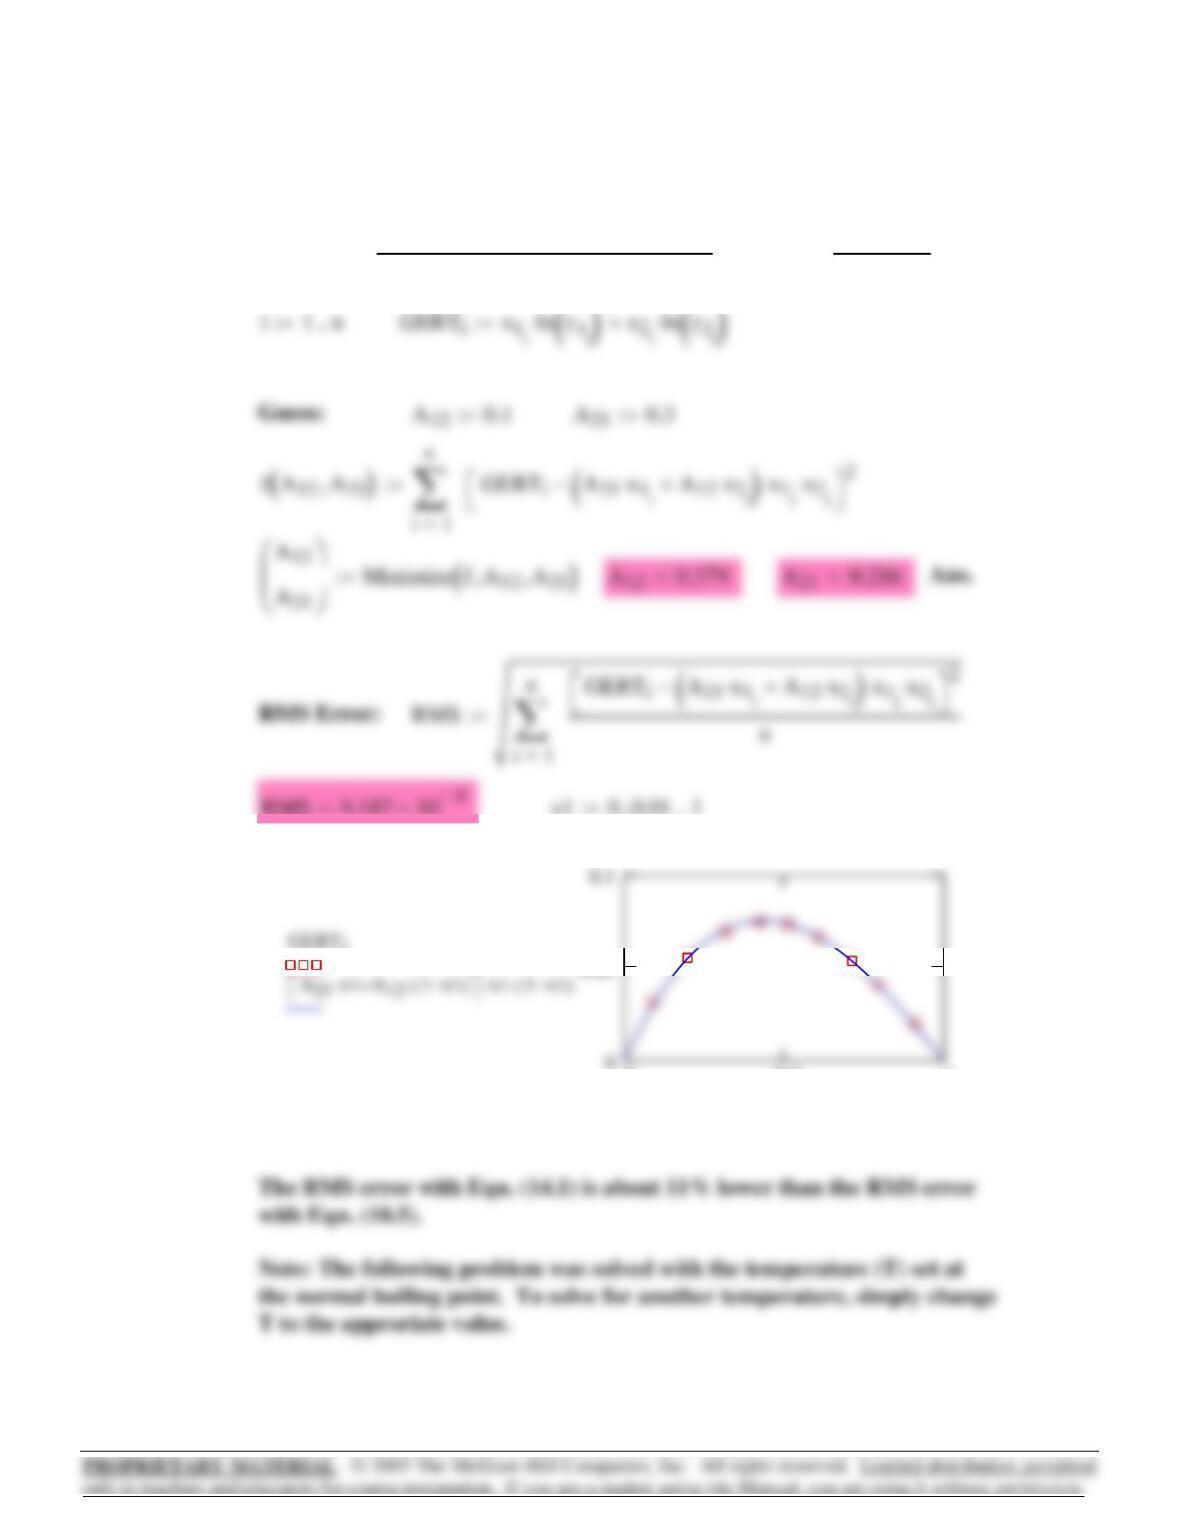
The following table lists answers for all parts. Literature values are interpolated
from tables in Perry’s Chemical Engineers’ Handbook, 6th ed. The last column
shows the percent difference between calculated and literature values at 0.85Tc.
These range from 0.1 to 27%. For the normal boiling point (Tn), Psat should be
1.013 bar. Tabulated results for Psat do not agree well with this value.
Differences range from 3 to > 100%.
Tn (K) Psat (bar) 0.85 Tc (K) Psat (bar) Psat (bar) % Difference
@ Tn @ 0.85 Tc Lit. Values
Acetylene 189.4 1.60 262.1 20.27 19.78 2.5%
Argon 87.3 0.68 128.3 20.23 18.70 8.2%
Benzene 353.2 1.60 477.9 16.028 15.52 3.2%
n-Butane 272.7 1.52 361.3 14.35 12.07 18.9%
14.10 (a) Acetylene: ω0.187:= Tc308.3K:= Pc61.39bar:= Tn189.4K:=
TT
n
:= Note: For solution at 0.85Tc, set T := 0.85Tc.Tr
T
Tc
:=
For SRK EOS: Tr0.614=
σ1:= ε 0:= Ω 0.08664:= Ψ 0.42748:= Table 3.1
lnφlT
rPr
,
()
Zl TrPr
,
()
1−ln Zl TrPr
,
()
βTrPr
,
()
−
()
−qT
r
()
Il TrPr
,
()
⋅−:=lnφlT
rPr
,
()
Zl TrPr
,
()
1−ln Zl TrPr
,
()
βTrPr
,
()
−
()
−qT
r
()
Il TrPr
,
()
⋅−:=lnφlT
rPr
,
()
Zl TrPr
,
()
1−ln Zl TrPr
,
()
βTrPr
,
()
−
()
−qT
r
()
Il TrPr
,
()
⋅−:=
Eq. (11.37)
lnφvT
rPr
,
()
Zv TrPr
,
()
1−ln Zv TrPr
,
()
βTrPr
,
()
−
()
−qT
r
()
Iv TrPr
,
()
⋅−:=lnφvT
rPr
,
()
Zv TrPr
,
()
1−ln Zv TrPr
,
()
βTrPr
,
()
−
()
−qT
r
()
Iv TrPr
,
()
⋅−:=lnφvT
rPr
,
()
Zv TrPr
,
()
1−ln Zv TrPr
,
()
βTrPr
,
()
−
()
−qT
r
()
Iv TrPr
,
()
⋅−:=
Guess Psat:Guess Psat:Guess Psat: Psatr
1bar
Pc
:=Psatr
1bar
Pc
:=Psatr
1bar
Pc
:=
Eq. (6.65b)
Il TrPr
,
()
1
σε−ln Zl TrPr
,
()
σβ TrPr
,
()
⋅+
Zl TrPr
,
()
εβ TrPr
,
()
⋅+
⎛
⎜
⎝
⎞
⎠
⋅:=
Define I for liquid (Il) and vapor (Iv)
Zl TrPr
,
()
Find zl():=
zl 0.2<
To find liquid root, restrict search for zl to values less than 0.2,
⎜
Eq. (3.56)
Given
zl 0.01:=
Guess:Define Z for the liquid (Zl)
Eq. (3.52)
Given
zv 0.9:=
Guess:Define Z for the vapor (Zv)
562
⎜

(b) Acetylene: ω0.187:= Tc308.3K:= Pc61.39bar:= Tn189.4K:=
TT
n
:= Note: For solution at 0.85Tc, set T := 0.85Tc.Tr
T
Tc
:=
For PR EOS: Tr0.614=
σ12+:= ε 12−:= Ω 0.07779:= Ψ 0.45724:= Table 3.1
lnφlT
rPr
,
()
Zl TrPr
,
()
1−ln Zl TrPr
,
()
βTrPr
,
()
−
()
−qT
r
()
Il TrPr
,
()
⋅−:=
Eq. (11.37)
lnφvT
rPr
,
()
Zv TrPr
,
()
1−ln Zv TrPr
,
()
βTrPr
,
()
−
()
−qT
r
()
Iv TrPr
,
()
⋅−:=
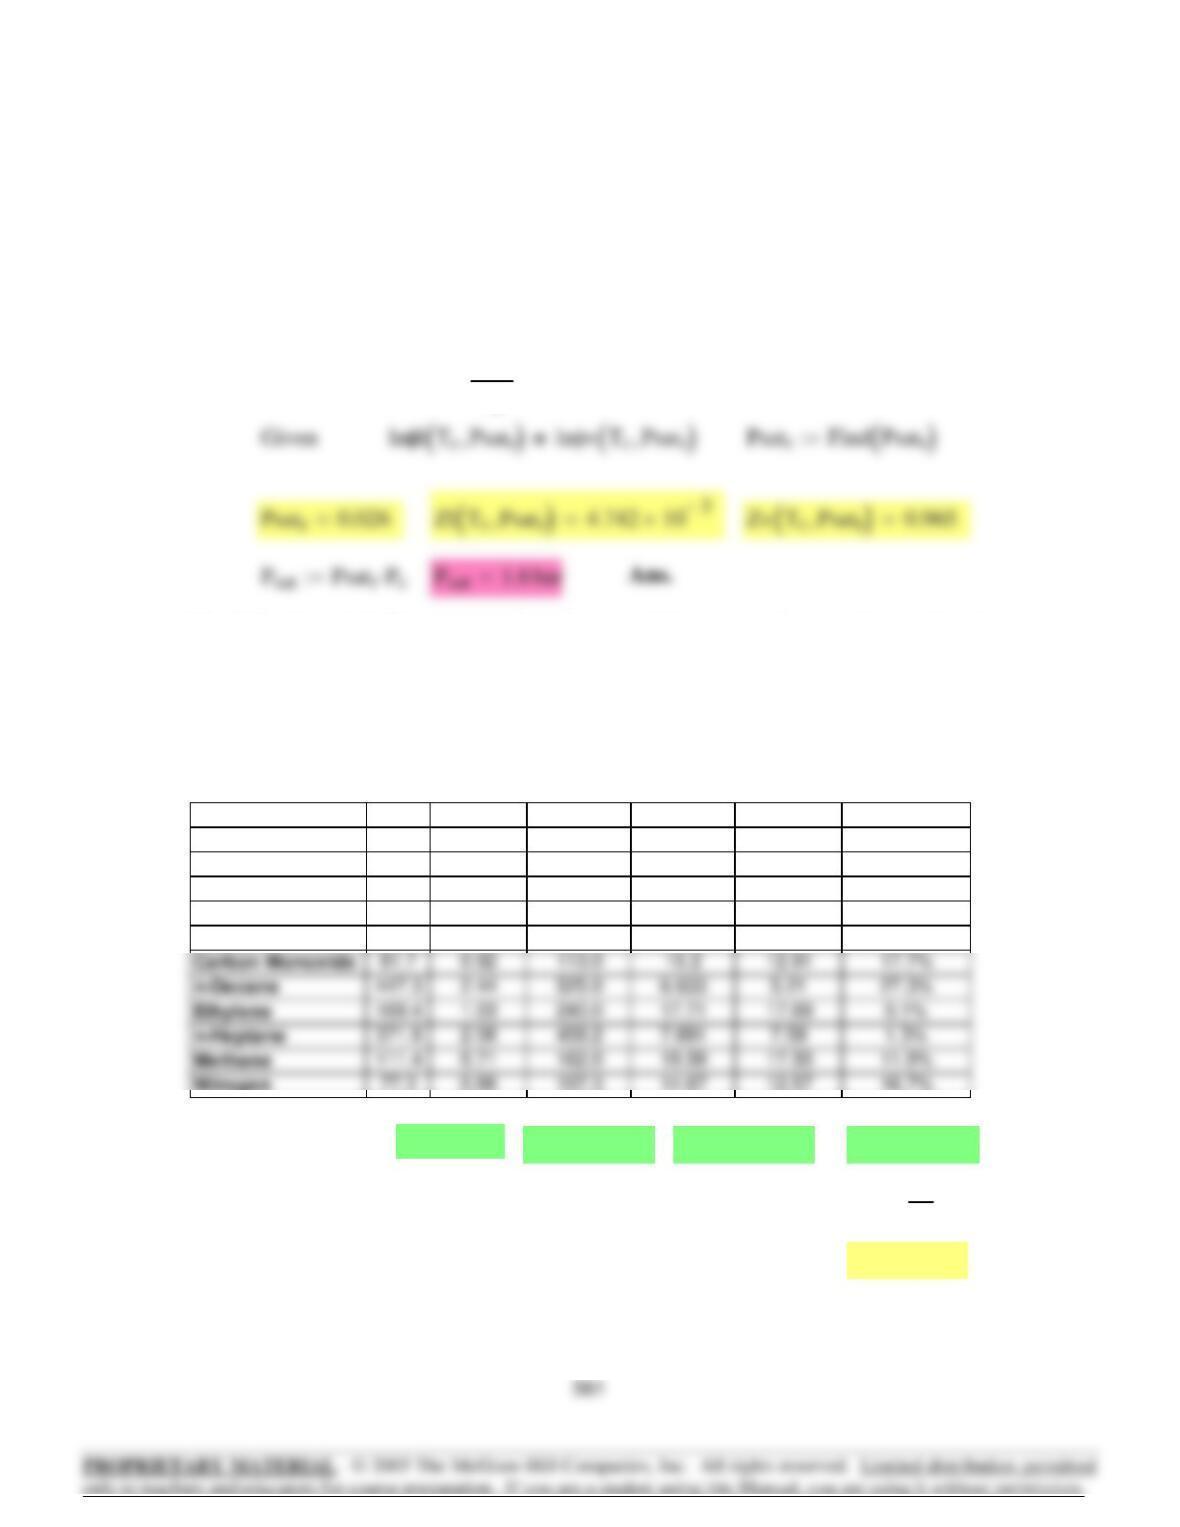
The following table lists answers for all parts. Literature values are interpolated
from tables in Perry’s Chemical Engineers’ Handbook, 6th ed. The last column
shows the percent difference between calculated and literature values at 0.85Tc.
These range from less than 0.1 to 2.5%. For the normal boiling point (Tn), Psat
should be 1.013 bar. Tabulated results for Psat agree well with this value.
Differences range from near 0 to 6%.
Tn (K) Psat (bar) 0.85 Tc (K) Psat (bar) Psat (bar) % Difference
@ Tn @ 0.85 Tc Lit. Values
Acetylene 189.4 1.073 262.1 20.016 19.78 1.2%
Argon 87.3 0.976 128.3 18.79 18.70 0.5%
Benzene 353.2 1.007 477.9 15.658 15.52 0.9%
n-Butane 272.7 1.008 361.3 12.239 12.07 1.4%
Carbon Monoxide 81.7 1.019 113.0 12.871 12.91 -0.3%
n-Decane 447.3 1.014 525.0 5.324 5.21 2.1%
Ethylene 169.4 1.004 240.0 17.918 17.69 1.3%
n-Heptane 371.6 1.011 459.2 7.779 7.59 2.5%
Methane 111.4 0.959 162.0 17.46 17.33 0.8%
Nitrogen 77.3 0.992 107.3 12.617 12.57 0.3%
14.10
563
Il TrPr
,
()
1
σε−ln Zl TrPr
,
()
σβ TrPr
,
()
⋅+
Zl TrPr
,
()
εβ TrPr
,
()
⋅+
⎛
⎜
⎞
⋅:=
Define I for liquid (Il) and vapor (Iv)
Zl TrPr
,
()
Find zl():=
zl 0.2<
To find liquid root, restrict search for zl to values less than 0.2,
⎜
Eq. (3.56)
Given
zl 0.01:=
Guess:Define Z for the liquid (Zl)
Zv TrPr
,
()
Find zv():=
zv 1 βTrPr
,
()
+qT
r
()
βTrPr
,
()
⋅zv βTrPr
,
()
−
zv εβ TrPr
,
()
⋅+
()
zv σβ TrPr
,
()
⋅+
()
⋅
⋅−=
Eq. (3.52)
Given
zv 0.9:=
Guess:Define Z for the vapor (Zv)
564
⎜
Eq. (3.52)
zv 1 βTr Pr,()+qTr()βTr Pr,()⋅zv βTr Pr,()−
zv()
2
⋅−=Given
(guess)
zv 0.9:=β Tr Pr,()
ΩPr⋅
Tr
:=qTr() ΨαTr()⋅
ΩTr⋅
:=
Ψ27
64
:=Ω 1
8
:= αTr() 1:=ε 0:=σ 0:=
Tr 0.7:=
(a) van der Waals Eqn.14.12
lnφlT
rPr
,
()
Zl TrPr
,
()
1−ln Zl TrPr
,
()
βTrPr
,
()
−
()
−qT
r
()
Il TrPr
,
()
⋅−:=
Eq. (11.37)
lnφvT
rPr
,
()
Zv TrPr
,
()
1−ln Zv TrPr
,
()
βTrPr
,
()
−
()
−qT
r
()
Iv TrPr
,
()
⋅−:=
The following table lists answers for all parts. Literature values are interpolated
from tables in Perry’s Chemical Engineers’ Handbook, 6th ed. The last column
shows the percent difference between calculated and literature values at 0.85Tc.
These range from less than 0.1 to 1.2%. For the normal boiling point (Tn), Psat
should be 1.013 bar. Tabulated results for Psat agree well with this value.
Differences range from near 0 to 7.6%.
Tn (K) Psat (bar) 0.85 Tc (K) Psat (bar) Psat (bar) % Difference
@ Tn @ 0.85 Tc Lit. Values
Acetylene 189.4 1.090 262.1 19.768 19.78 -0.1%
Argon 87.3 1.015 128.3 18.676 18.70 -0.1%
Benzene 353.2 1.019 477.9 15.457 15.52 -0.4%
n-Butane 272.7 1.016 361.3 12.084 12.07 0.1%
Carbon Monoxide 81.7 1.041 113.0 12.764 12.91 -1.2%
n-Decane 447.3 1.016 525.0 5.259 5.21 0.9%
Ethylene 169.4 1.028 240.0 17.744 17.69 0.3%
n-Heptane 371.6 1.012 459.2 7.671 7.59 1.1%
Methane 111.4 0.994 162.0 17.342 17.33 0.1%
Nitrogen 77.3 1.016 107.3 12.517 12.57 -0.4%
565
(b) Redlich/Kwong Eqn.Tr 0.7:=
σ1:= ε 0:= Ω 0.08664:= Ψ 0.42748:=
αTr() Tr
.5−
:=
qTr() ΨαTr()⋅
ΩTr⋅
:= β Tr Pr,()
ΩPr⋅
Tr
:= Guess: zv 0.9:=
Zv Tr Pr,( ) Find zv():=
zl .01:= (guess)
By Eq. (11.39):
lnφvTrPr,( ) Zv Tr Pr,()1−ln Zv Tr Pr,()βTr Pr,()−
()
−qTr( ) Iv Tr Pr,()⋅−:=
lnφlTrPr,( ) Zl Tr Pr,()1−ln Zl Tr Pr,()βTr Pr,()−
()
−qTr( ) Il Tr Pr,()⋅−:=
Psatr .1:=
566
14.15 (a) x1α0.1:= x2α1x1α−:= x1β0.9:= x2β1x1β−:=
A12 2:= A21 2:=
Guess:
γ1αA21 A12
,
()
exp x2α2A12 2A
21 A12
−
()
⋅x1α⋅+
⎡
⎣
⎤
⎦
⋅
⎡
⎣
⎤
⎦
:=
γ1βA21 A12
,
()
exp x2β2A12 2A
21 A12
−
()
⋅x1β⋅+
⎡
⎣
⎤
⎦
⋅
⎡
⎣
⎤
⎦
:=
⎡
⎣
⎤
⎦
⎡
⎣
⎤
⎦
⎡
⎣
⎤
⎦
⎡
⎣
⎤
⎦
Given zl βTr Pr,( ) zl zl βTr Pr,()+
()
⋅1βTr Pr,()+zl−
qTr()βTr Pr,()⋅
⋅+=Eq. (3.55)
zl 0.2<Zl Tr Pr,( ) Find zl():=
Iv Tr Pr,()ln
Zv Tr Pr,()βTr Pr,()+
Zv Tr Pr,()
⎛
⎜
⎝
⎞
⎠
:= Il Tr Pr,()ln
Zl Tr Pr,()βTr Pr,()+
Zl Tr Pr,()
⎛
⎜
⎝
⎞
⎠
:=
By Eq. (11.39):
lnφvTrPr,( ) Zv Tr Pr,()1−ln Zv Tr Pr,()βTr Pr,()−
()
−qTr( ) Iv Tr Pr,()⋅−:=
567
(c) x1α0.1:= x2α1x1α−:= x1β0.8:= x2β1x1β−:=
Guess: A12 2:= A21 2:=
γ1αA21 A12
,
()
exp x2α2A12 2A
21 A12
−
()
⋅x1α⋅+
⎡
⎣
⎤
⎦
⋅
⎡
⎣
⎤
⎦
:=
γ1βA21 A12
,
()
exp x2β2A12 2A
21 A12
−
()
⋅x1β⋅+
⎡
⎣
⎤
⎦
⋅
⎡
⎣
⎤
⎦
:=
γ2αA21 A12
,
()
exp x1α2A21 2A
12 A21
−
()
⋅x2α⋅+
⎡
⎣
⎤
⎦
⋅
⎡
⎣
⎤
⎦
:=
γ2βA21 A12
,
()
exp x1β2A21 2A
12 A21
−
()
⋅x2β⋅+
⎡
⎣
⎤
⎦
⋅
⎡
⎣
⎤
⎦
:=
Given x1αγ1αA21 A12
,
()
⋅x1βγ1βA21 A12
,
()
⋅=
x2αγ2αA21 A12
,
()
⋅x2βγ2βA21 A12
,
()
⋅=
⎜
(b) x1α0.2:= x2α1x1α−:= x1β0.9:= x2β1x1β−:=
A12 2:= A21 2:=
Guess:
γ1αA21 A12
,
()
exp x2α2A12 2A
21 A12
−
()
⋅x1α⋅+
⎡
⎣
⎤
⎦
⋅
⎡
⎣
⎤
⎦
:=
γ1βA21 A12
,
()
exp x2β2A12 2A
21 A12
−
()
⋅x1β⋅+
⎡
⎣
⎤
⎦
⋅
⎡
⎣
⎤
⎦
:=
γ2αA21 A12
,
()
exp x1α2A21 2A
12 A21
−
()
⋅x2α⋅+
⎡
⎣
⎤
⎦
⋅
⎡
⎣
⎤
⎦
:=
568
⎜
⎡
⎣
⎤
⎦
⎡
⎣
⎤
⎦
(b) x1α0.2:= x2α1x1α−:= x1β0.9:= x2β1x1β−:=
Guess: a12 2:= a21 2:=
Given
exp a12 1a12 x1α⋅
a21 x2α⋅
+
⎛
⎜
⎝
⎞
⎠
2−
⋅
⎡
⎢
⎢
⎣
⎤
⎥
⎥
⎦x1α⋅ exp a12 1a12 x1β⋅
a21 x2β⋅
+
⎛
⎜
⎝
⎞
⎠
2−
⋅
⎡
⎢
⎢
⎣
⎤
⎥
⎥
⎦x1β⋅=
⎜
⎢
⎢
⎥
⎥
⎜
⎢
⎢
⎥
⎥
14.16 (a) x1α0.1:= x2α1x1α−:= x1β0.9:= x2β1x1β−:=
Guess: a12 2:= a21 2:=
Given
exp a12 1a12 x1α⋅
a21 x2α⋅
+
⎛
⎜
⎝
⎞
⎠
2−
⋅
⎡
⎢
⎢
⎣
⎤
⎥
⎥
⎦x1α⋅ exp a12 1a12 x1β⋅
a21 x2β⋅
+
⎛
⎜
⎝
⎞
⎠
2−
⋅
⎡
⎢
⎢
⎣
⎤
⎥
⎥
⎦x1β⋅=
569
⎜
⎢
⎢
⎥
⎥
⎜
⎢
⎢
⎥
⎥
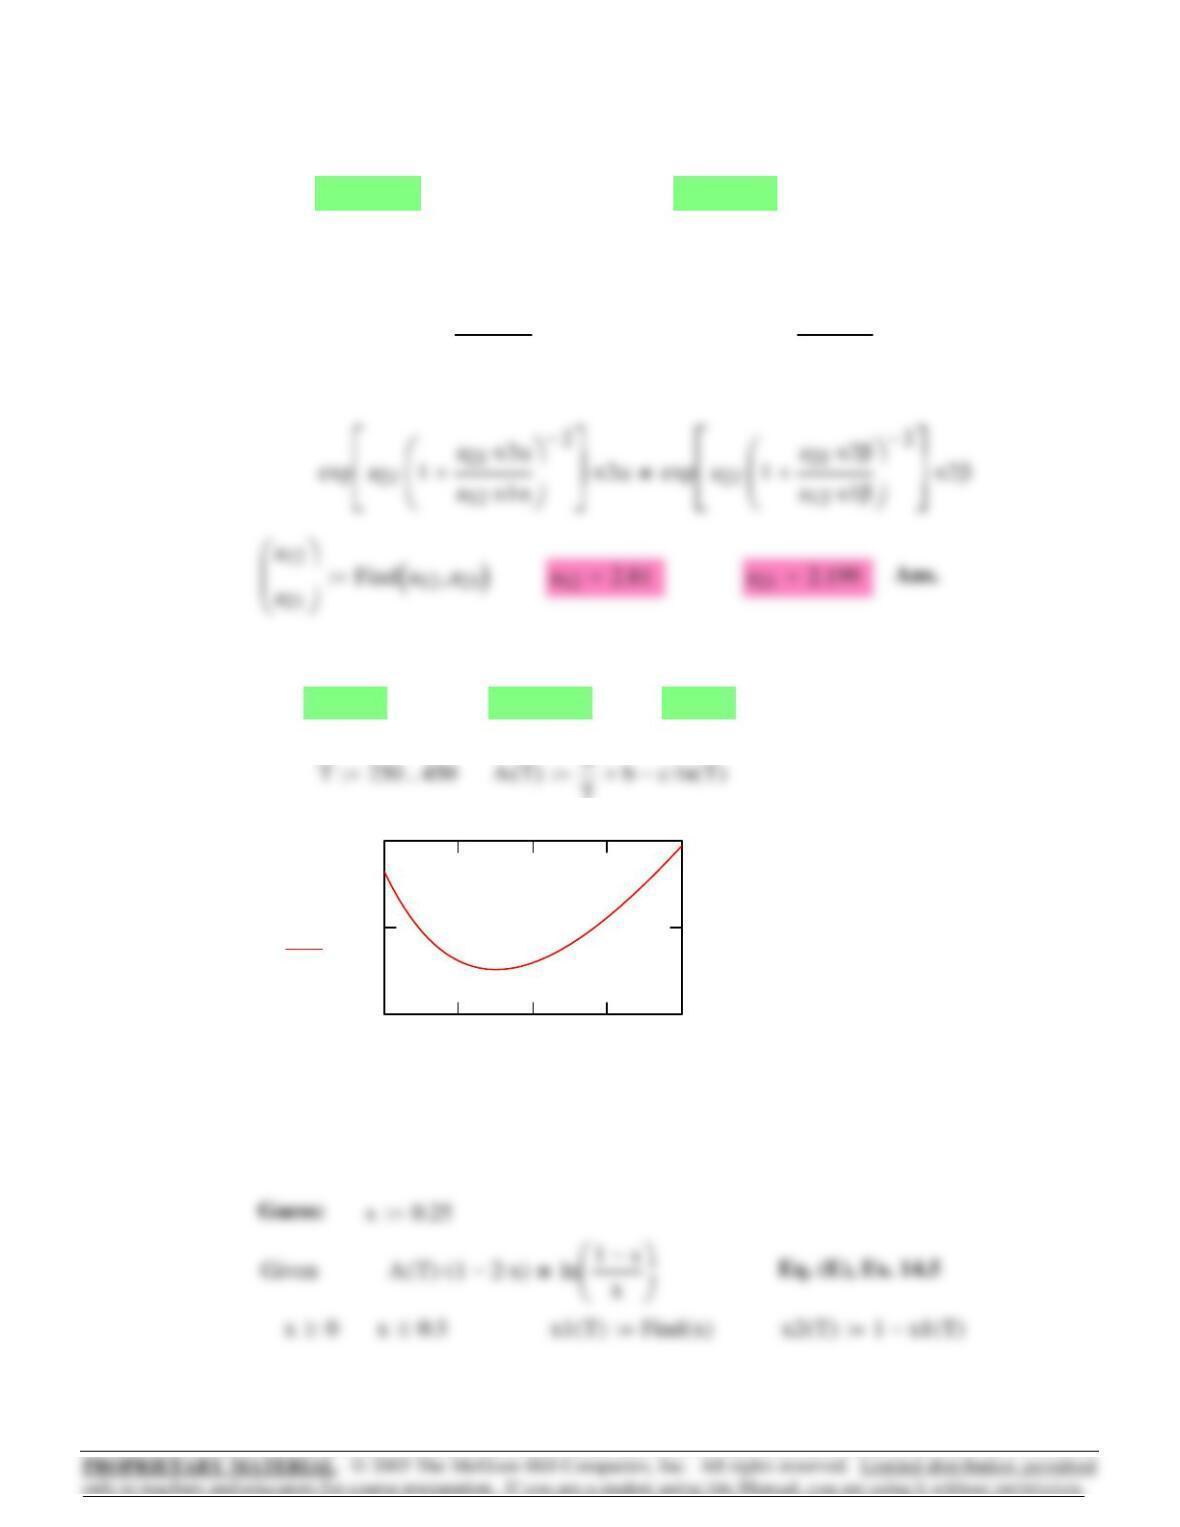
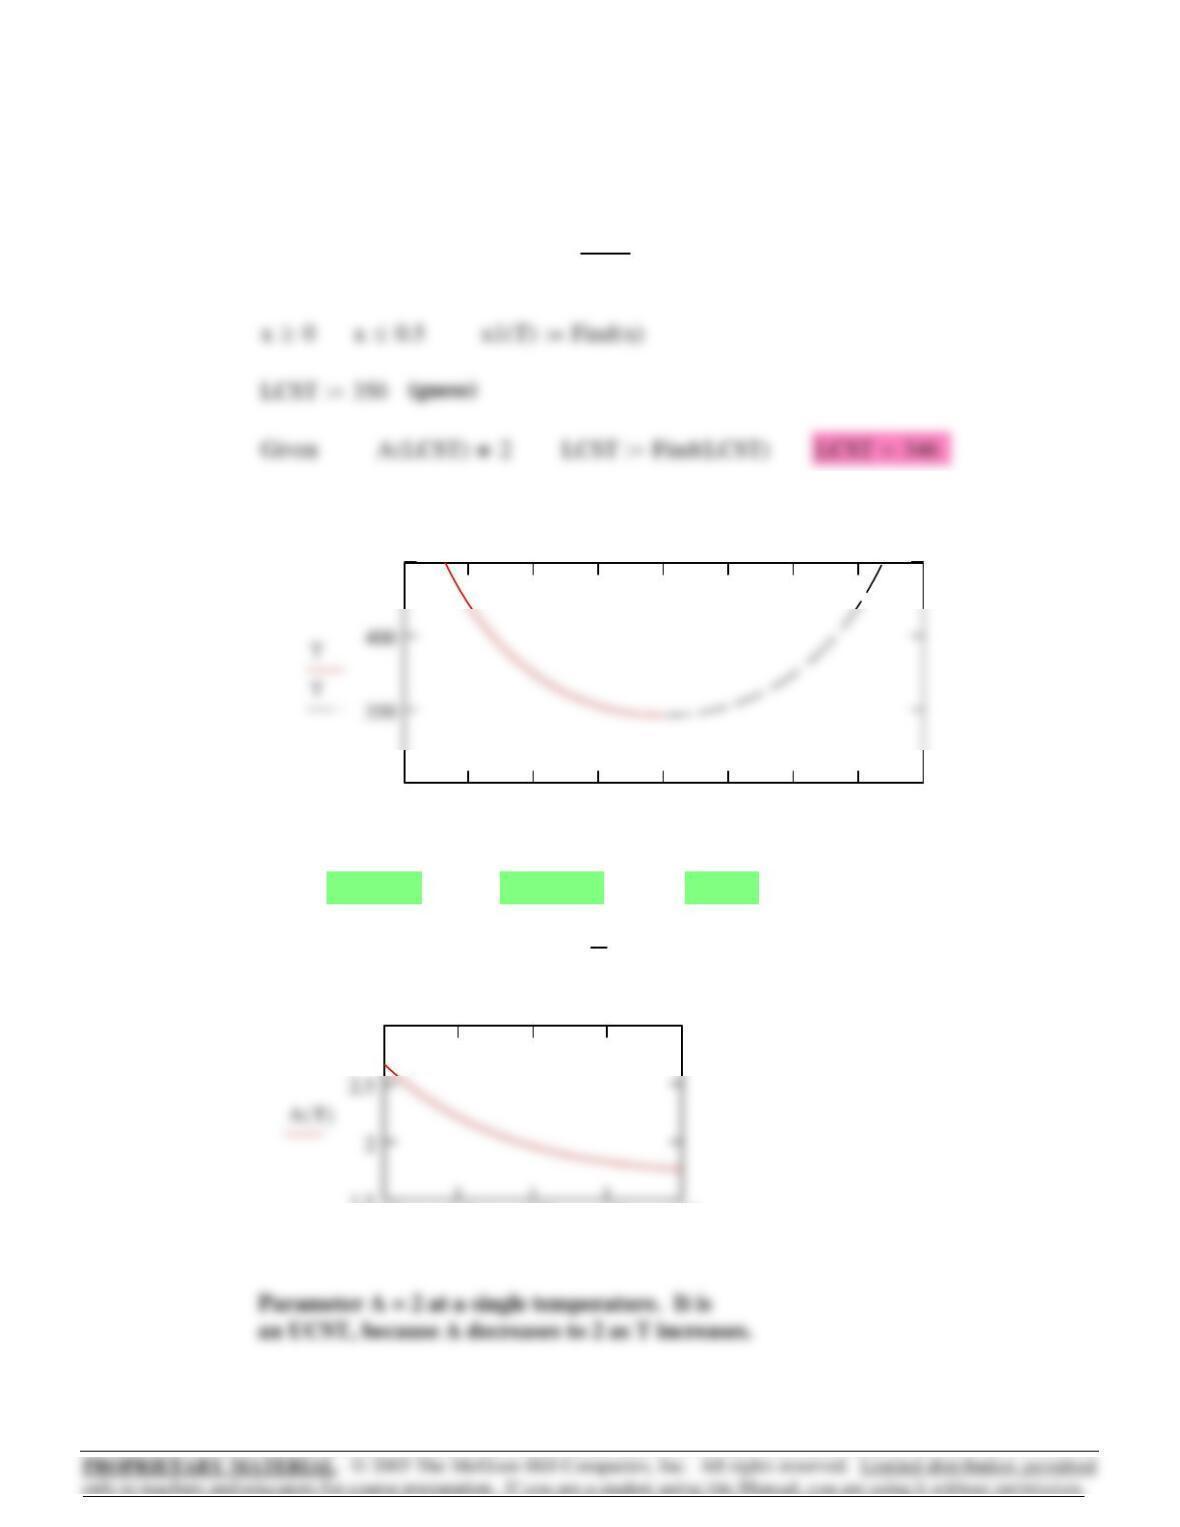
a 975:= b 18.4−:= c3−:=
250 300 350 400 450
1.9
2
2.1
AT()
T
Parameter A = 2 at two temperatures. The lower one is an UCST,
because A decreases to 2 as T increases. The higher one is a LCST,
because A decreases to 2 as T decreases.
(c) x1α0.1:= x2α1x1α−:= x1β0.8:= x2β1x1β−:=
Guess: a12 2:= a21 2:=
Given
exp a12 1a12 x1α⋅
a21 x2α⋅
+
⎛
⎜
⎝
⎞
⎠
2−
⋅
⎡
⎢
⎢
⎣
⎤
⎥
⎥
⎦x1α⋅ exp a12 1a12 x1β⋅
a21 x2β⋅
+
⎛
⎜
⎝
⎞
⎠
2−
⋅
⎡
⎢
⎢
⎣
⎤
⎥
⎥
⎦x1β⋅=
⎜
⎢
⎢
⎥
⎥
⎜
⎢
⎢
⎥
⎥
14.18 (a)
570
Parameter A = 2 at a single temperature. It is
a LCST, because A decreases to 2 as T decreases.
250 300 350 400 450
1.5
2
2.5
AT()
T
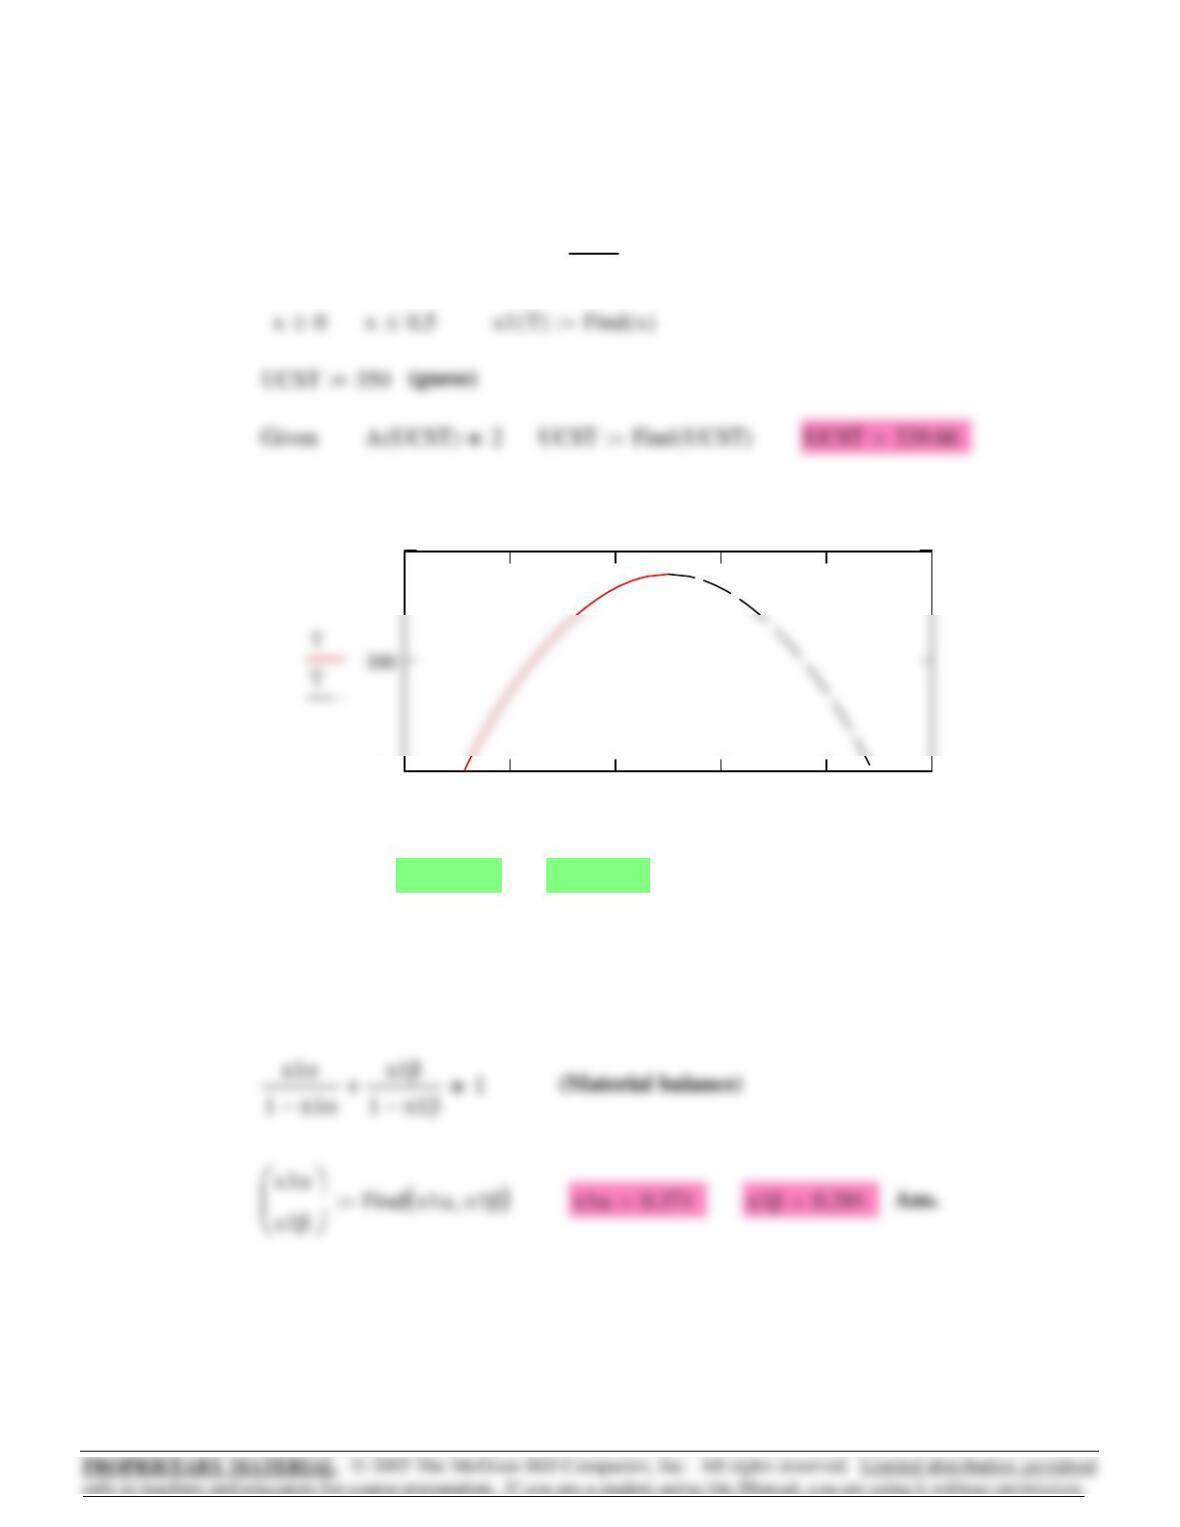
AT() a
Tb+clnT()⋅−:=T 250 450..:=
c3−:=b 17.1−:=a 540:=
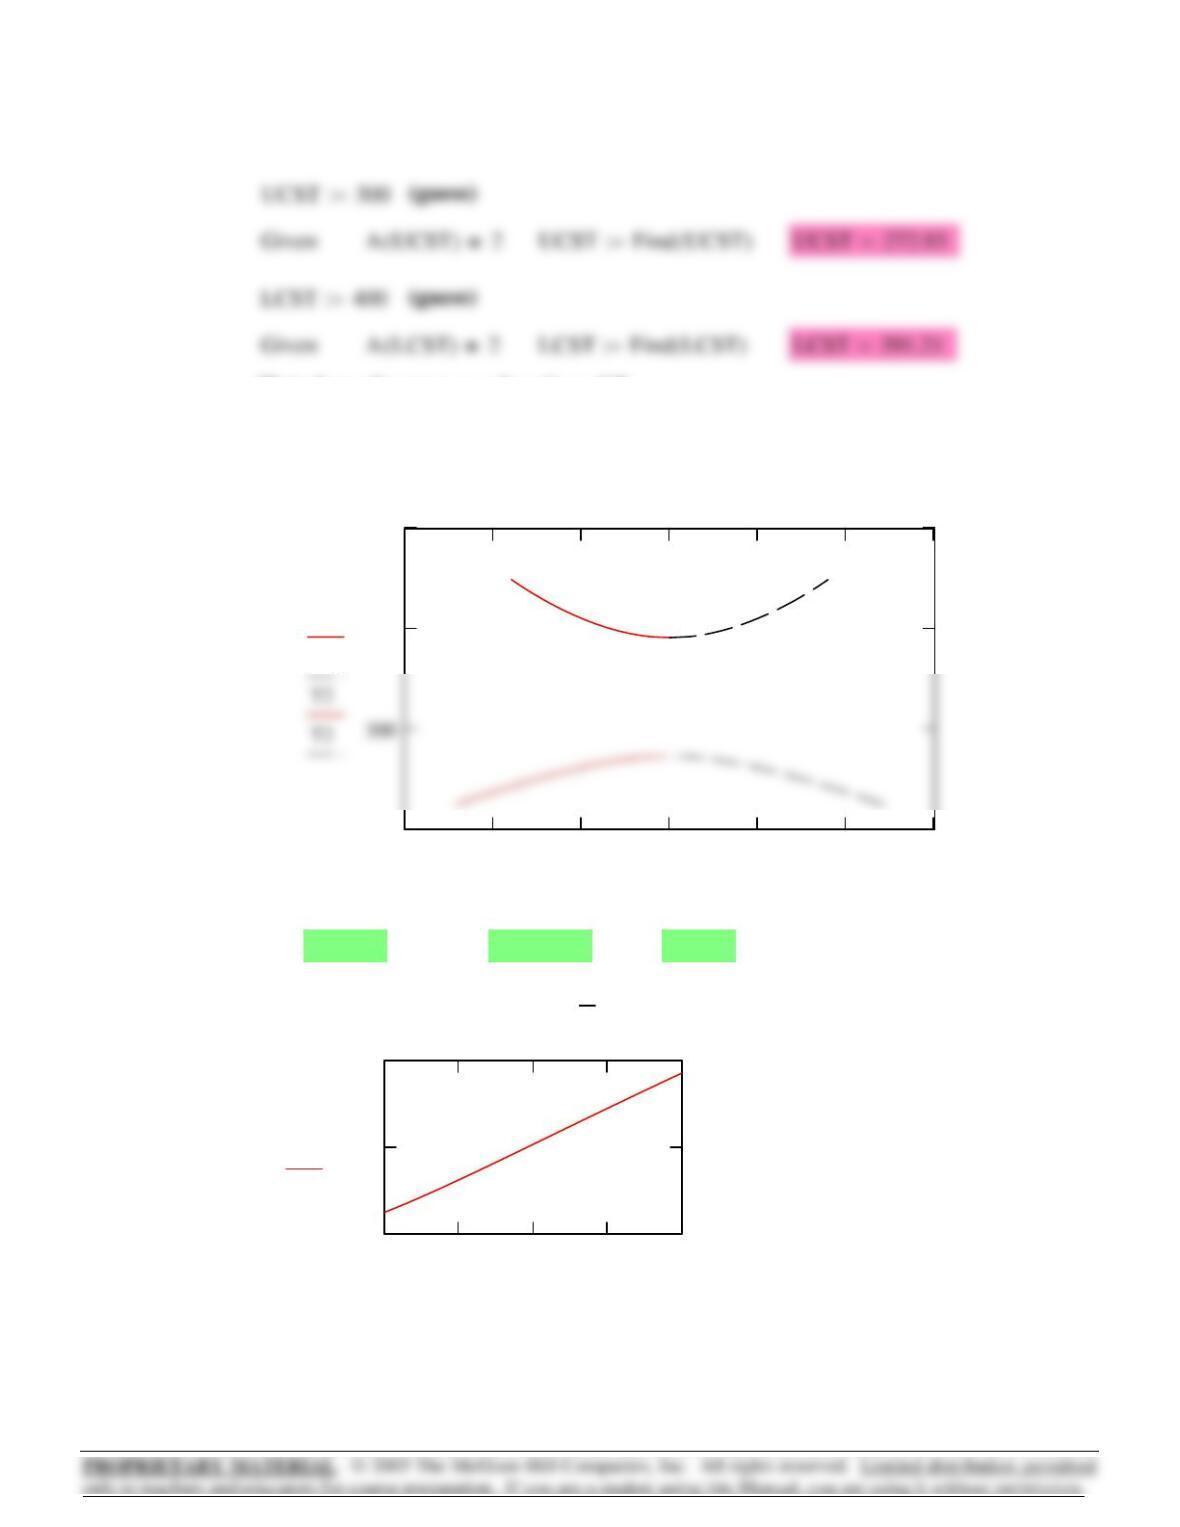
(b)
0.2 0.3 0.4 0.5 0.6 0.7 0.8
200
400
500
T1
T1
x1 T1( ) x2 T1(),x1 T2(),x2 T2(),
T2 LCST 450..:=T1 225 225.1,UCST..:=
Plot phase diagram as a function of T
571
250 300 350 400 450
1.5
3
T
AT() a
Tb+clnT()⋅−:=T 250 450..:=
c3−:=b 19.9−:=a 1500:=
(c)
0.1 0.2 0.3 0.4 0.5 0.6 0.7 0.8
300
450
x1 T()1x1T()−,
T LCST 450..:=
Plot phase diagram as a function of T
Eq. (E), Ex. 14.5
AT()1 2x⋅−()⋅ln 1x−
x
⎛
⎜
⎝
⎞
⎠
=Given
x 0.25:=
Guess:
572
x1αexp 0.4 1 x1α−
()
2
⋅
⎡
⎣
⎤
⎦
⋅x1βexp 0.8 1 x1β−
()
2
⋅
⎡
⎣
⎤
⎦
⋅=
Write Eq. (14.74) for species 1:
Given
x1β0.5:=x1α0.5:=
Guess:14.20
0 0.2 0.4 0.6 0.8
250
350
x1 T()1x1T()−,
T UCST 250..:=
Plot phase diagram as a function of T
Eq. (E), Ex. 14.5
AT()1 2x⋅−()⋅ln 1x−
x
⎛
⎜
⎝
⎞
⎠
=Given
x 0.25:=
Guess:
573
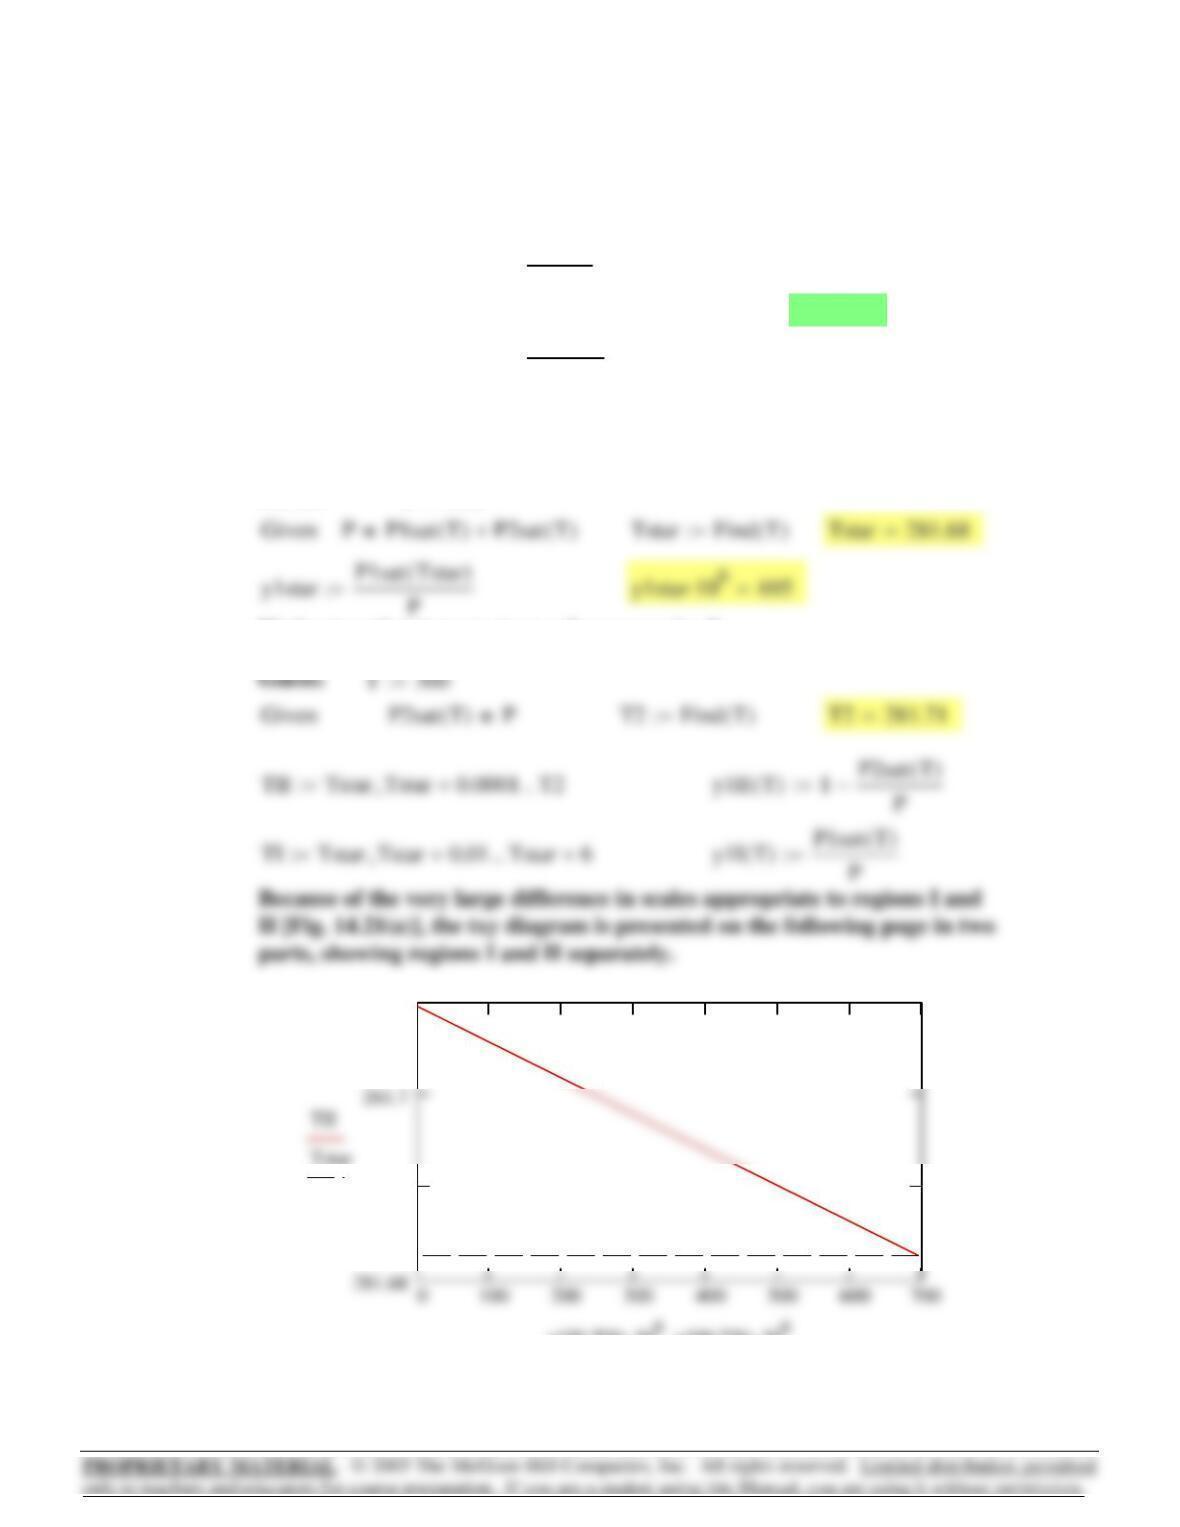
281.69
y1II TII()10
⋅y1II TII()10
⋅,
Find saturation temperatures of pure species 2:
T 300:=
Guess:
Find 3-phase equilibrium temperature and vapor-phase composition (pp.
594-5 of text):
SF6
P2sat T( ) exp 14.6511 2048.97
T
−
⎛
⎜
⎝
⎞
⎠
:=
P 1600:=
water
P1sat T( ) exp 19.1478 5363.7
T
−
⎛
⎜
⎝
⎞
⎠
:=
Temperatures in kelvins; pressures in kPa.14.22
574
Tdew Tstar:=
Guess:
y1 0.2:=
For z1 < y1*, first liquid is pure species 2.
Find the three-phase equilibrium T and y:
Water
P2sat T( ) exp 16.3872 3885.70
T 230.170+
−
⎛
⎜
⎝
⎞
⎠
:=
P 101.33:=
Toluene
P1sat T( ) exp 13.9320 3056.96
T 217.625+
−
⎛
⎜
⎝
⎞
⎠
:=
Temperatures in deg. C; pressures in kPa14.24
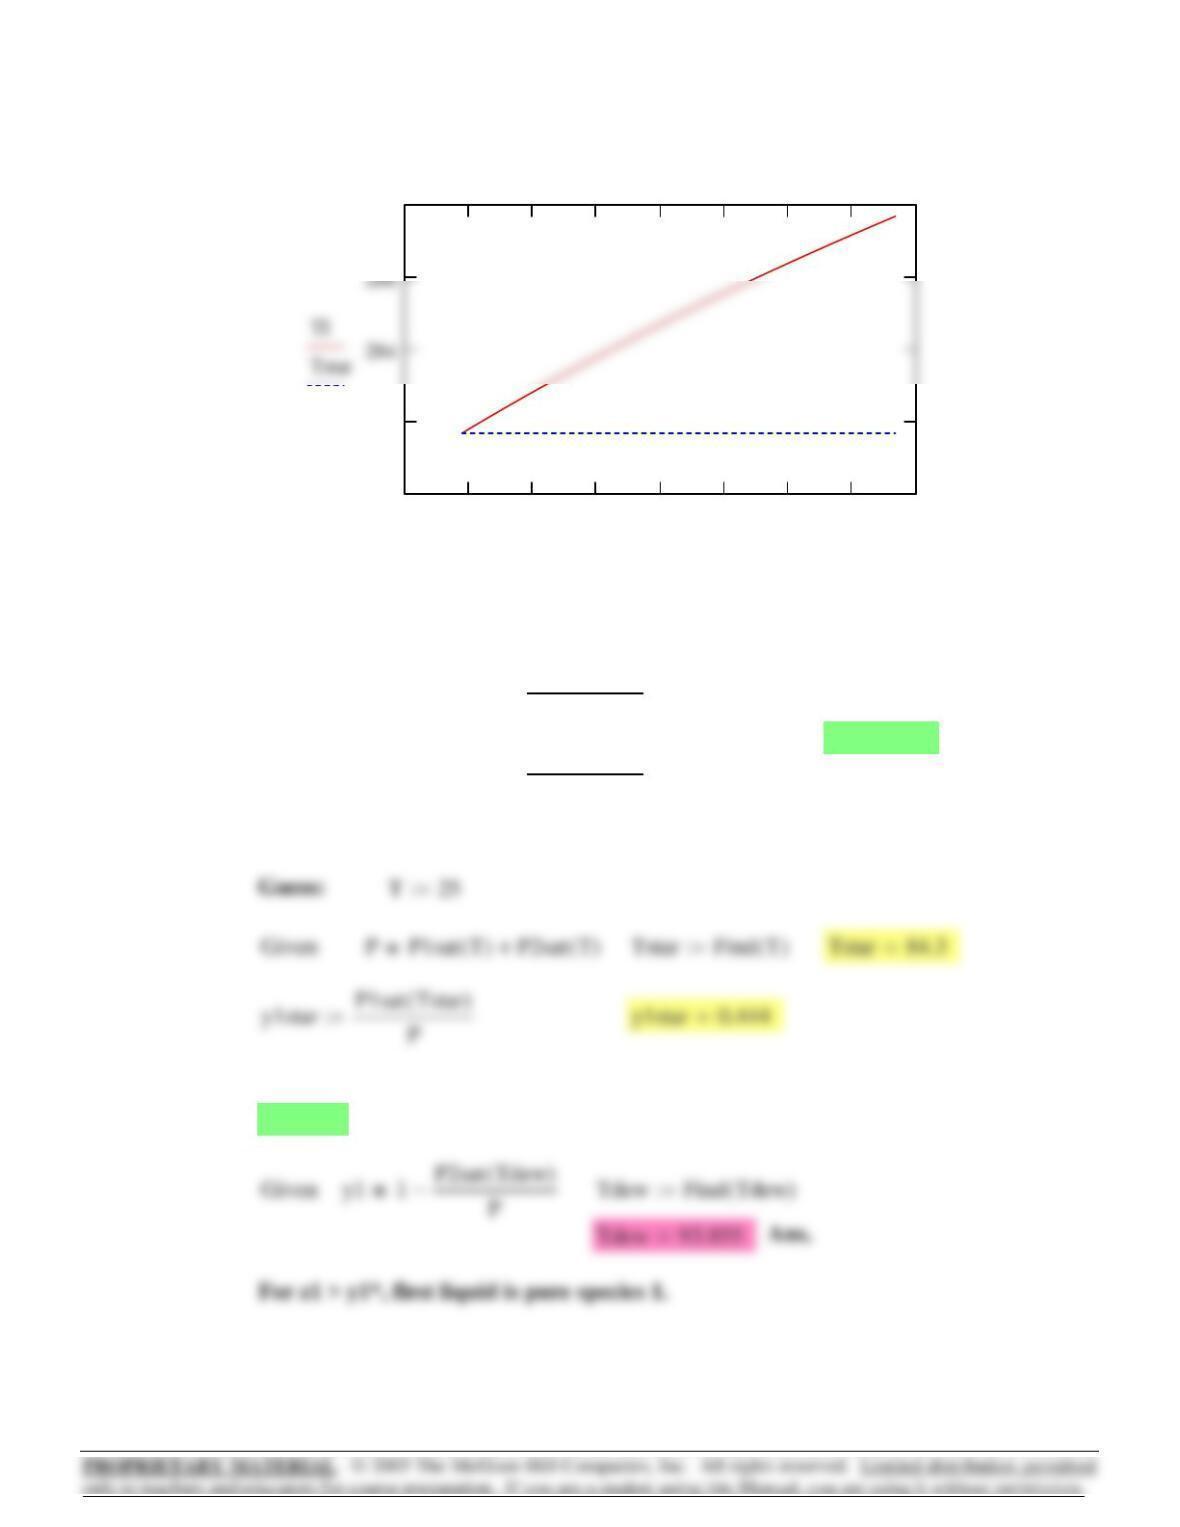
650 700 750 800 850 900 950 1000 1050
280
282
288
y1I TI()10
6
⋅y1I TI()10
6
⋅,
575
Since 0.35<y1*, first liquid is pure species 2.
y1 T() 1 P2sat T()
P
−:=
Find temperature of initial condensation at y1=0.35:
y100.35:= Guess: Tdew Tstar:=
Define the path of vapor mole fraction above and below the dew point.
y1 0.7:= Guess: Tdew Tstar:=
14.25 Temperatures in deg. C; pressures in kPa.
P1sat T( ) exp 13.8622 2910.26
T 216.432+
−
⎛
⎜
⎝
⎞
⎠
:= n-heptane
⎜
Find the three-phase equilibrium T and y:
Guess: T50:=
576