Solution 14.88
The schematic is shown below. We insert a voltage marker to measure Vo. In the AC
Copyright © 2017 McGraw–Hill Education. All rights reserved. No reproduction or distribution without the
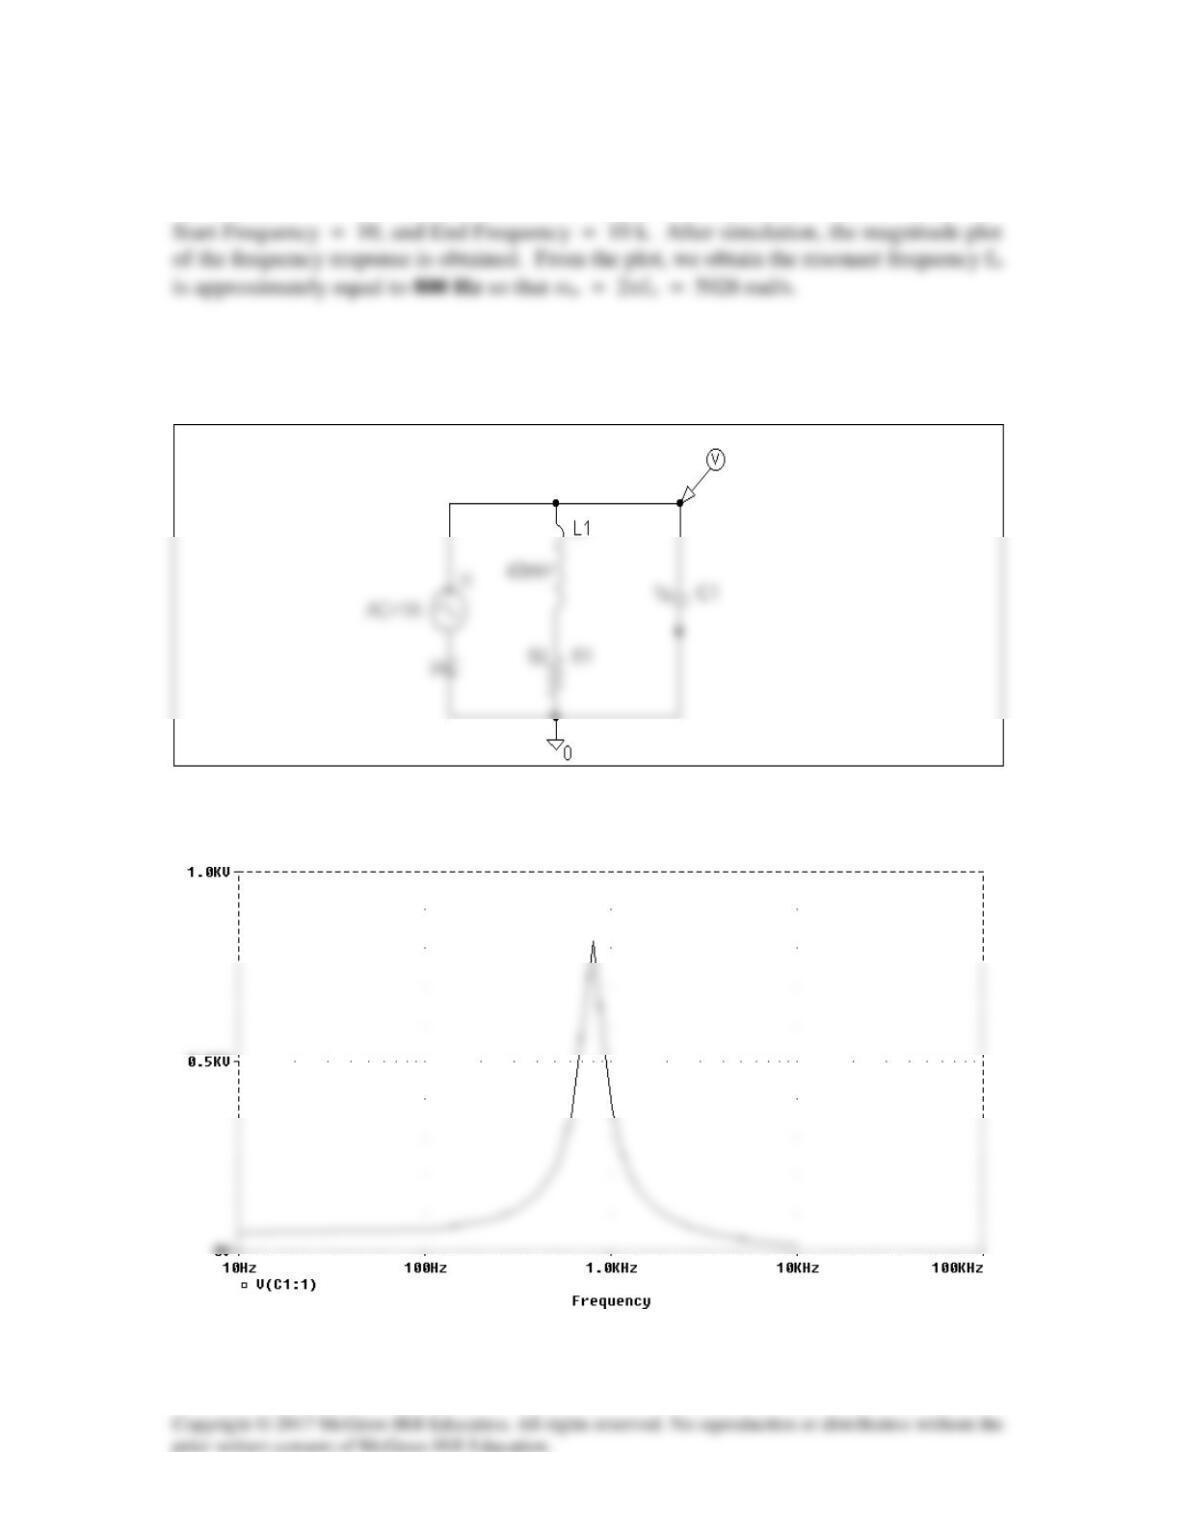
Solution 14.89
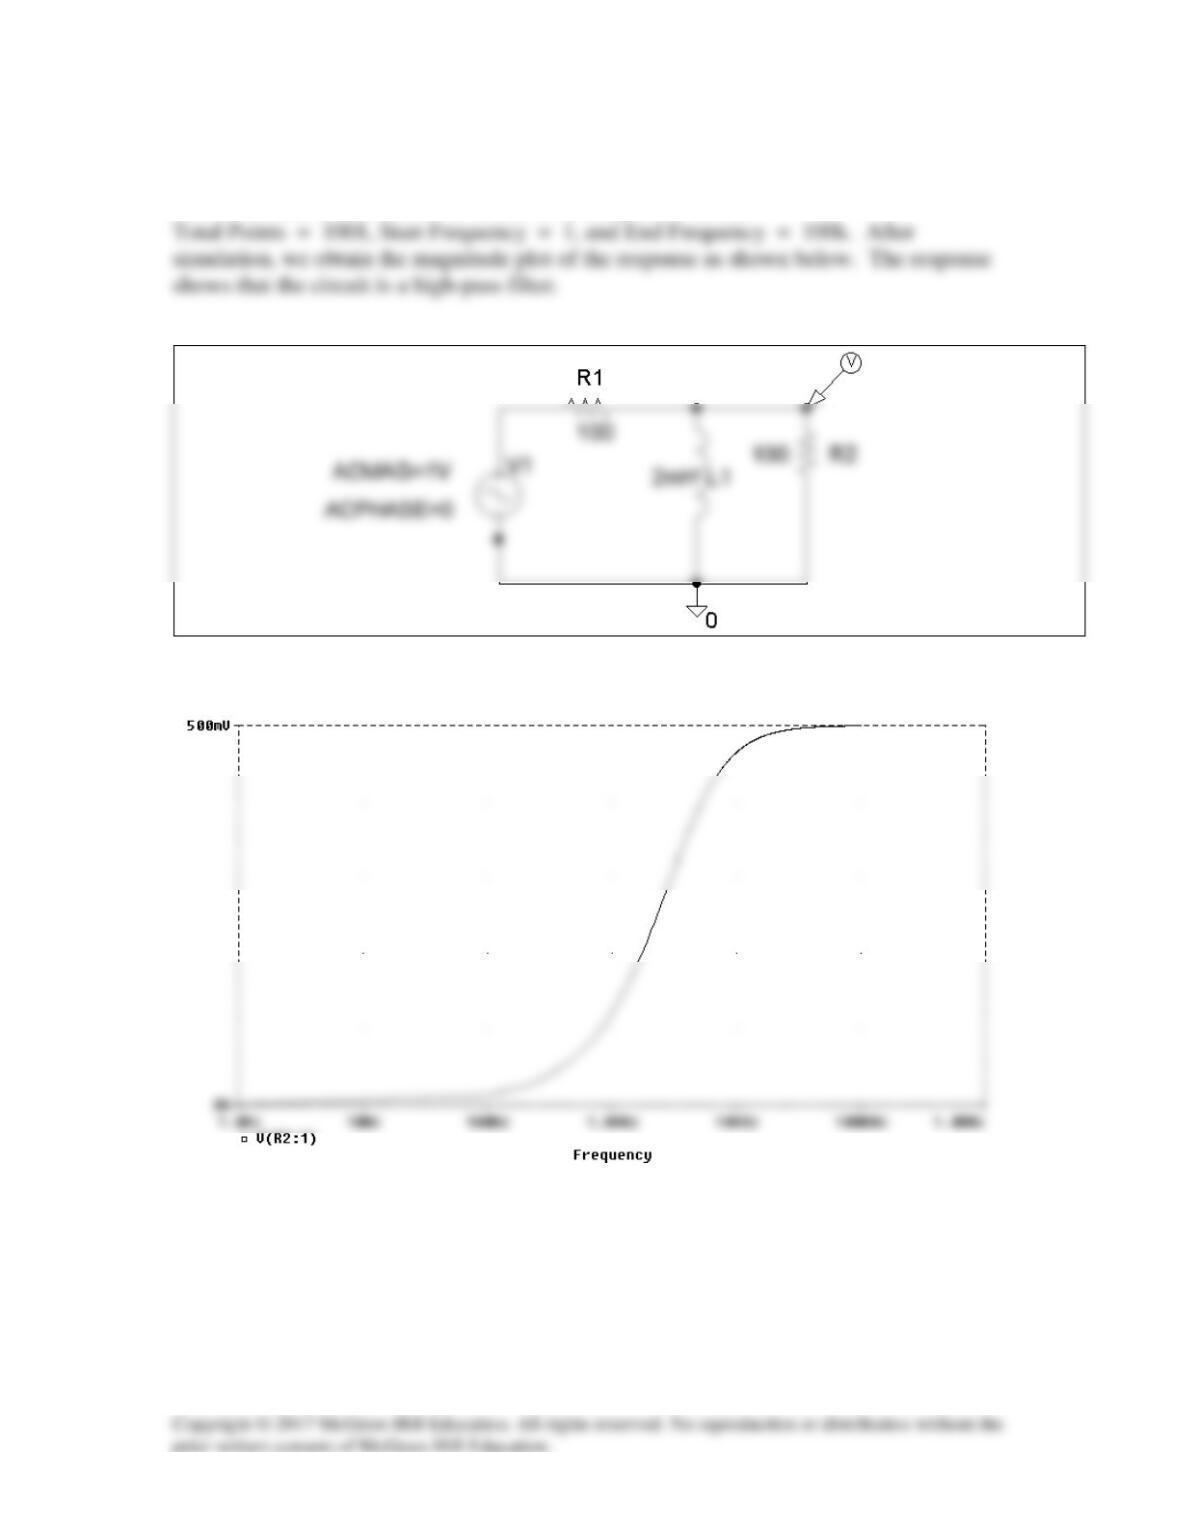
The schematic is shown below. In the AC Sweep box, we type Total Points = 101, Start
Frequency = 100, and End Frequency = 1 k. After simulation, the magnitude plot of
the response Vo is obtained as shown below.
Solution 14.90
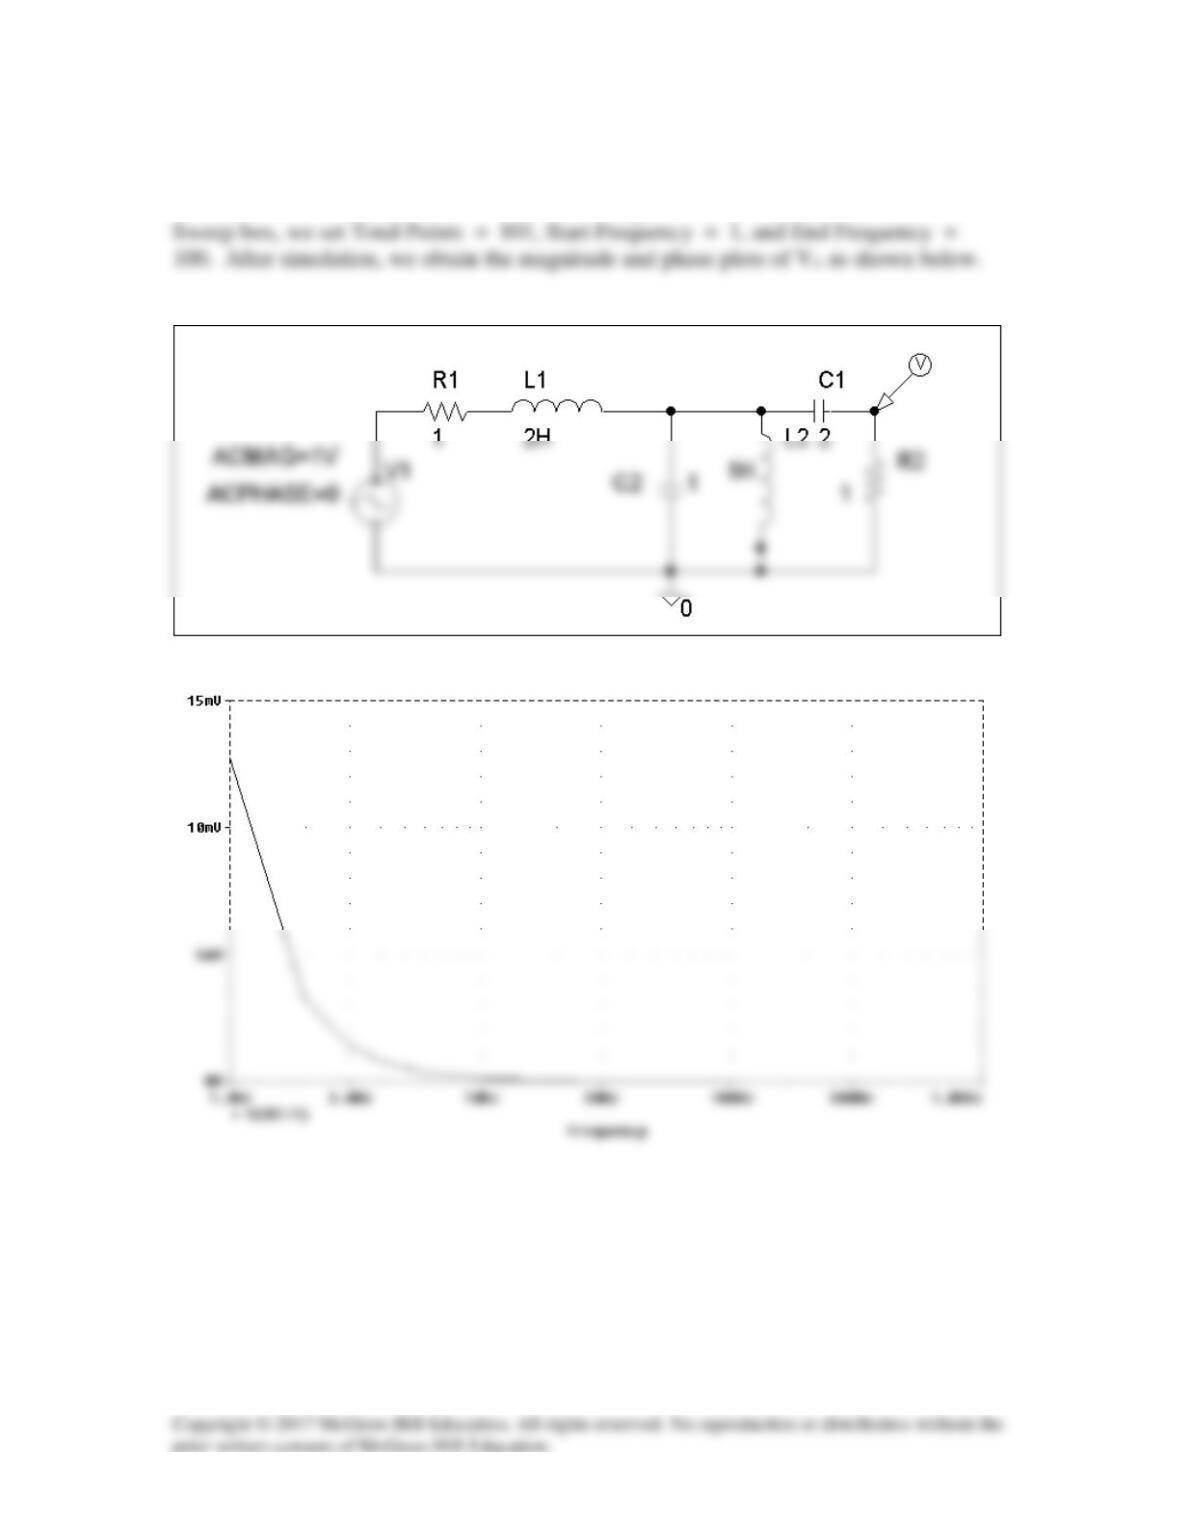
The schematic is shown below. In the AC Sweep box, we set

Solution 14.91
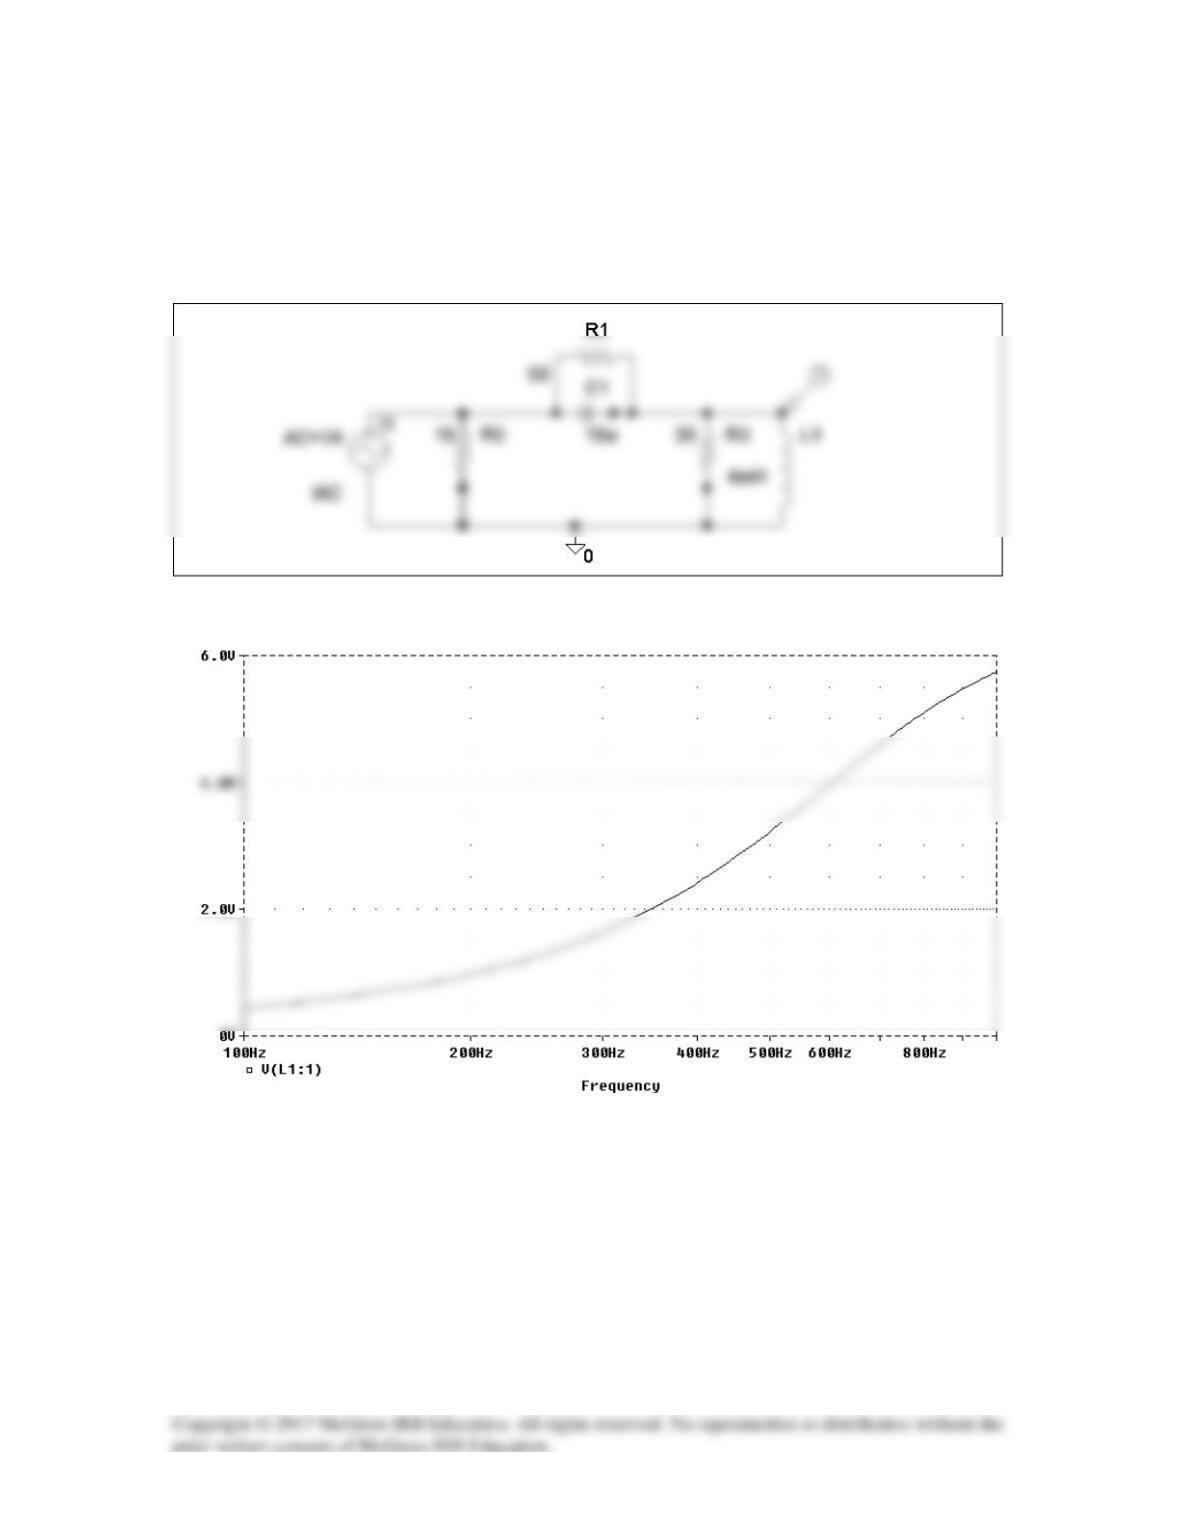
The schematic is shown below. In the AC Sweep box, we select Total Points = 101,
Solution 14.92
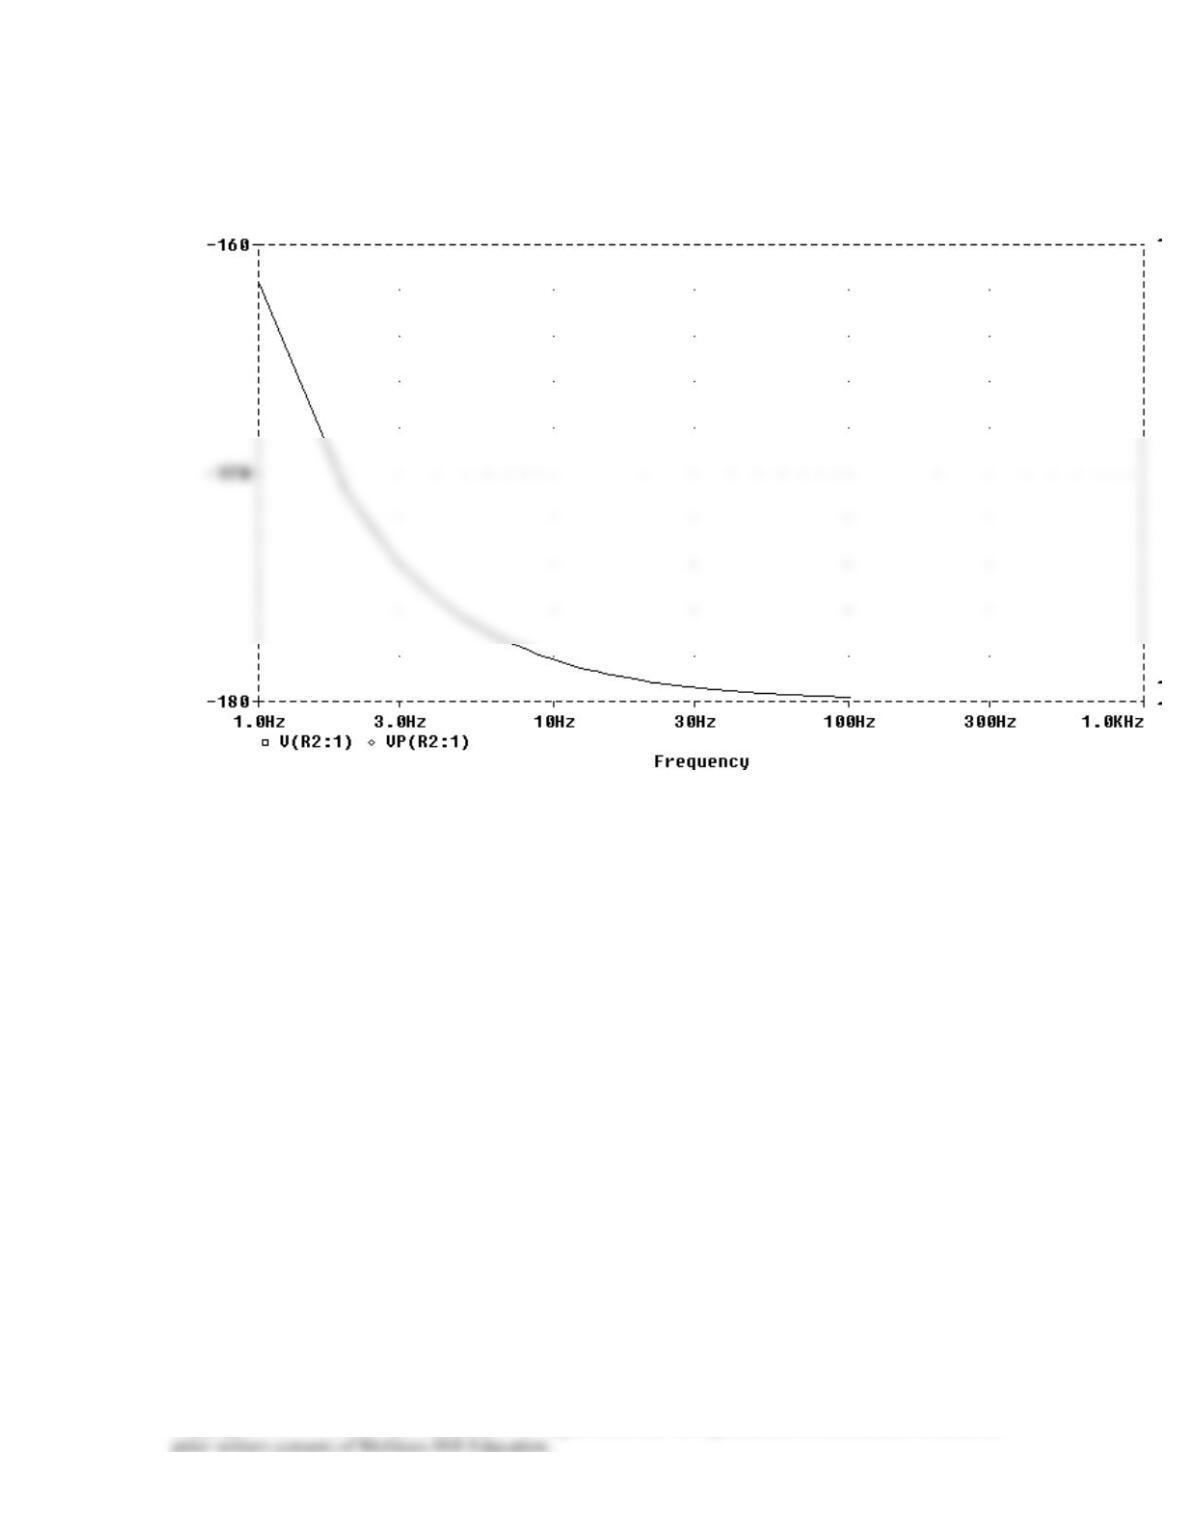
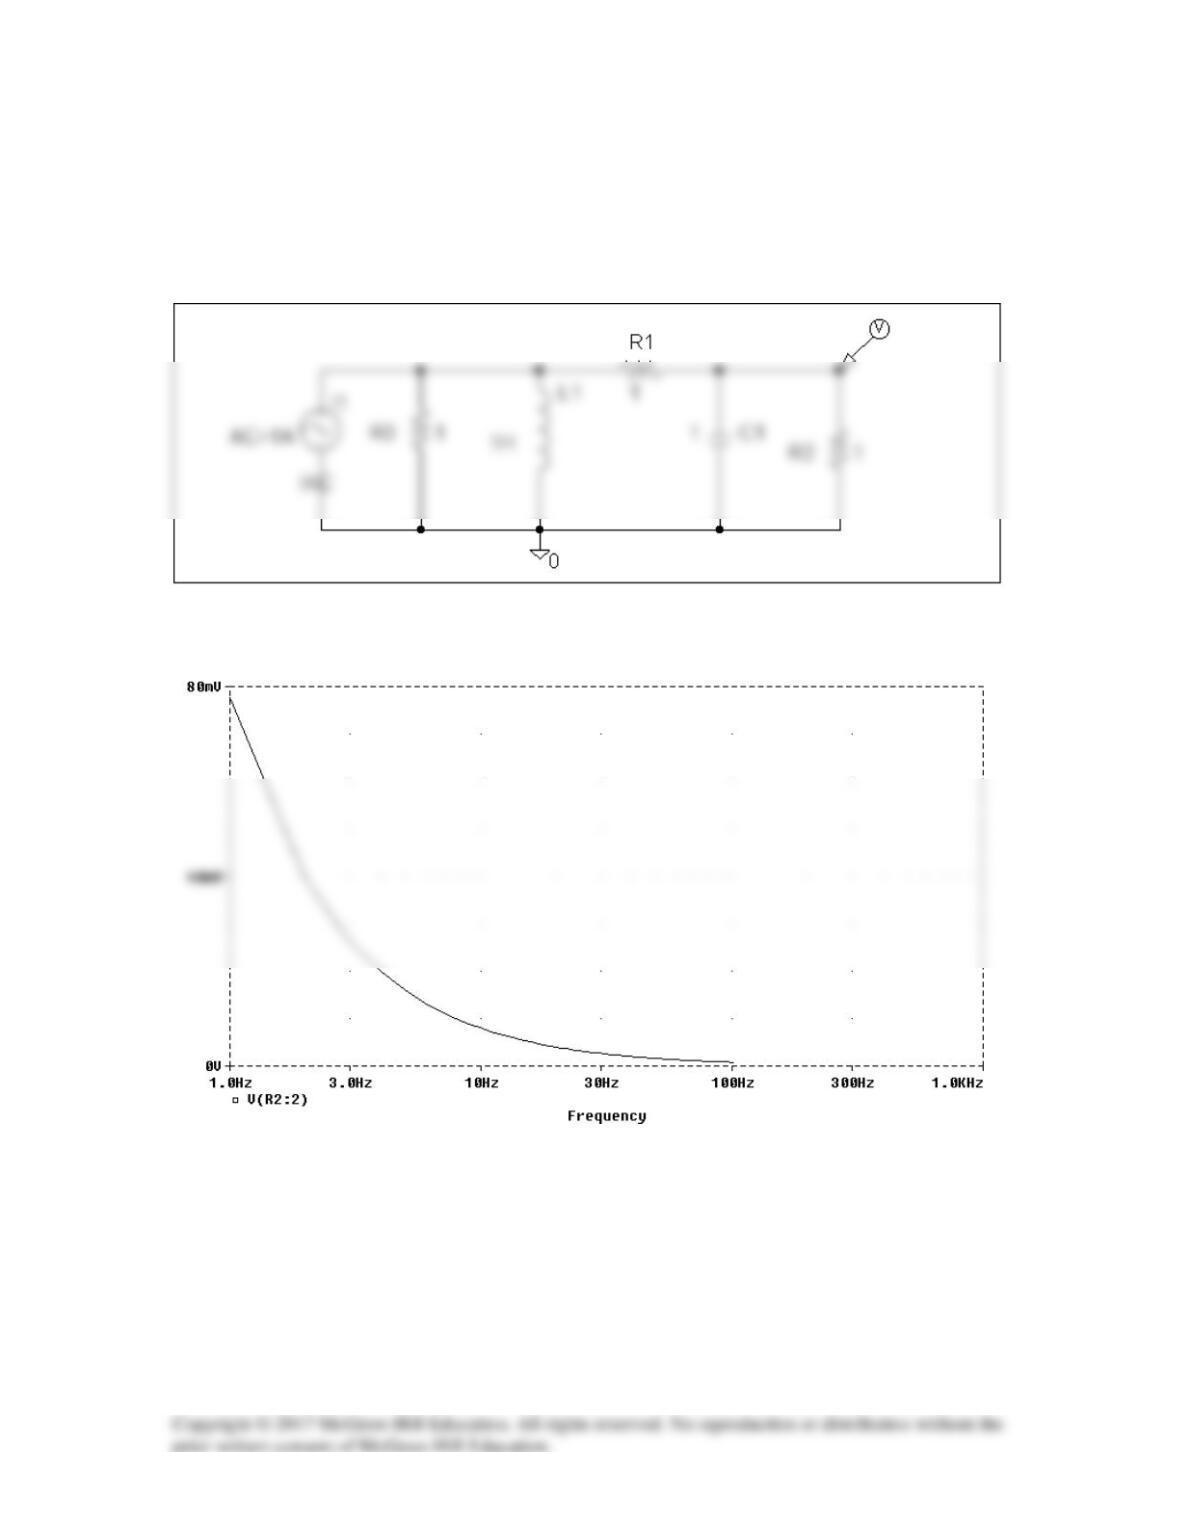
The schematic is shown below. We type Total Points = 101, Start Frequency = 1, and
End Frequency = 100 in the AC Sweep box. After simulating the circuit, the magnitude
plot of the frequency response is shown below.

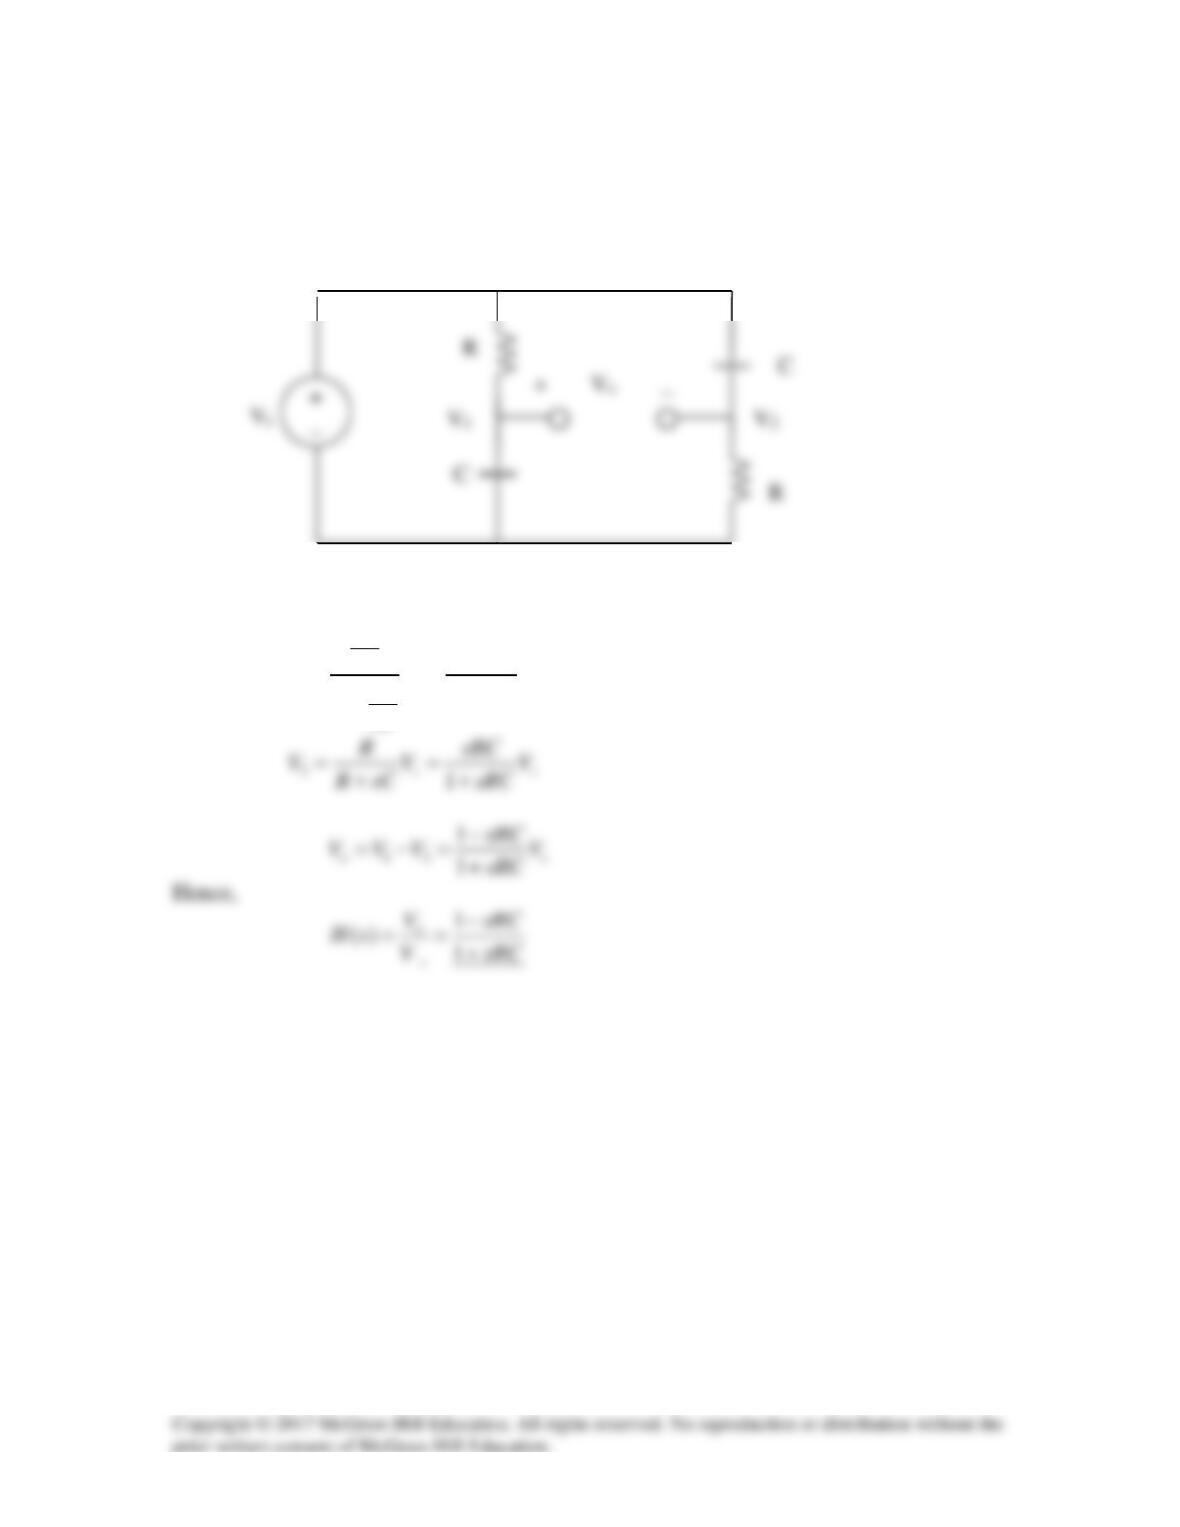
Solution 14.93
Consider the circuit as shown below.
1
1
11
s
V
sC
VV
sRC
R
sC
= =
+
+
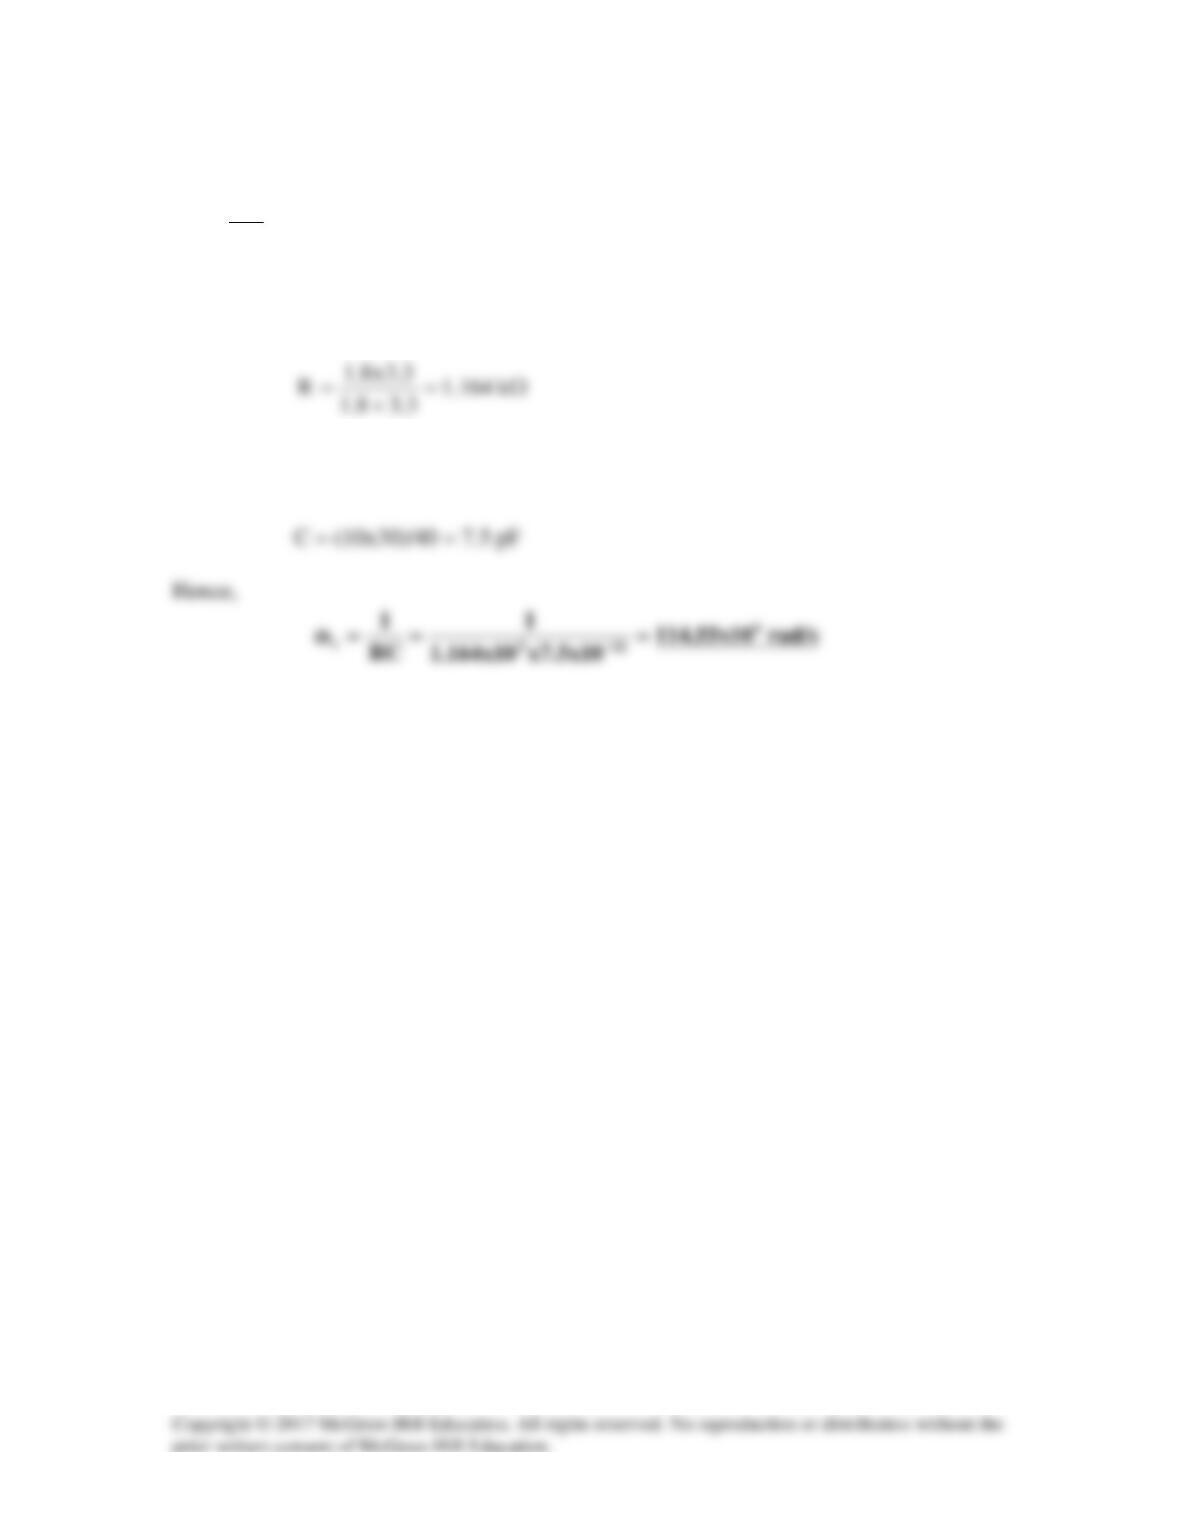
Solution 14.94
RC
1
c
=ω
We make R and C as small as possible. To achieve this, we connect 1.8 k
Ω
and 3.3 k
Ω
in parallel so that
We place the 10-pF and 30-pF capacitors in series so that
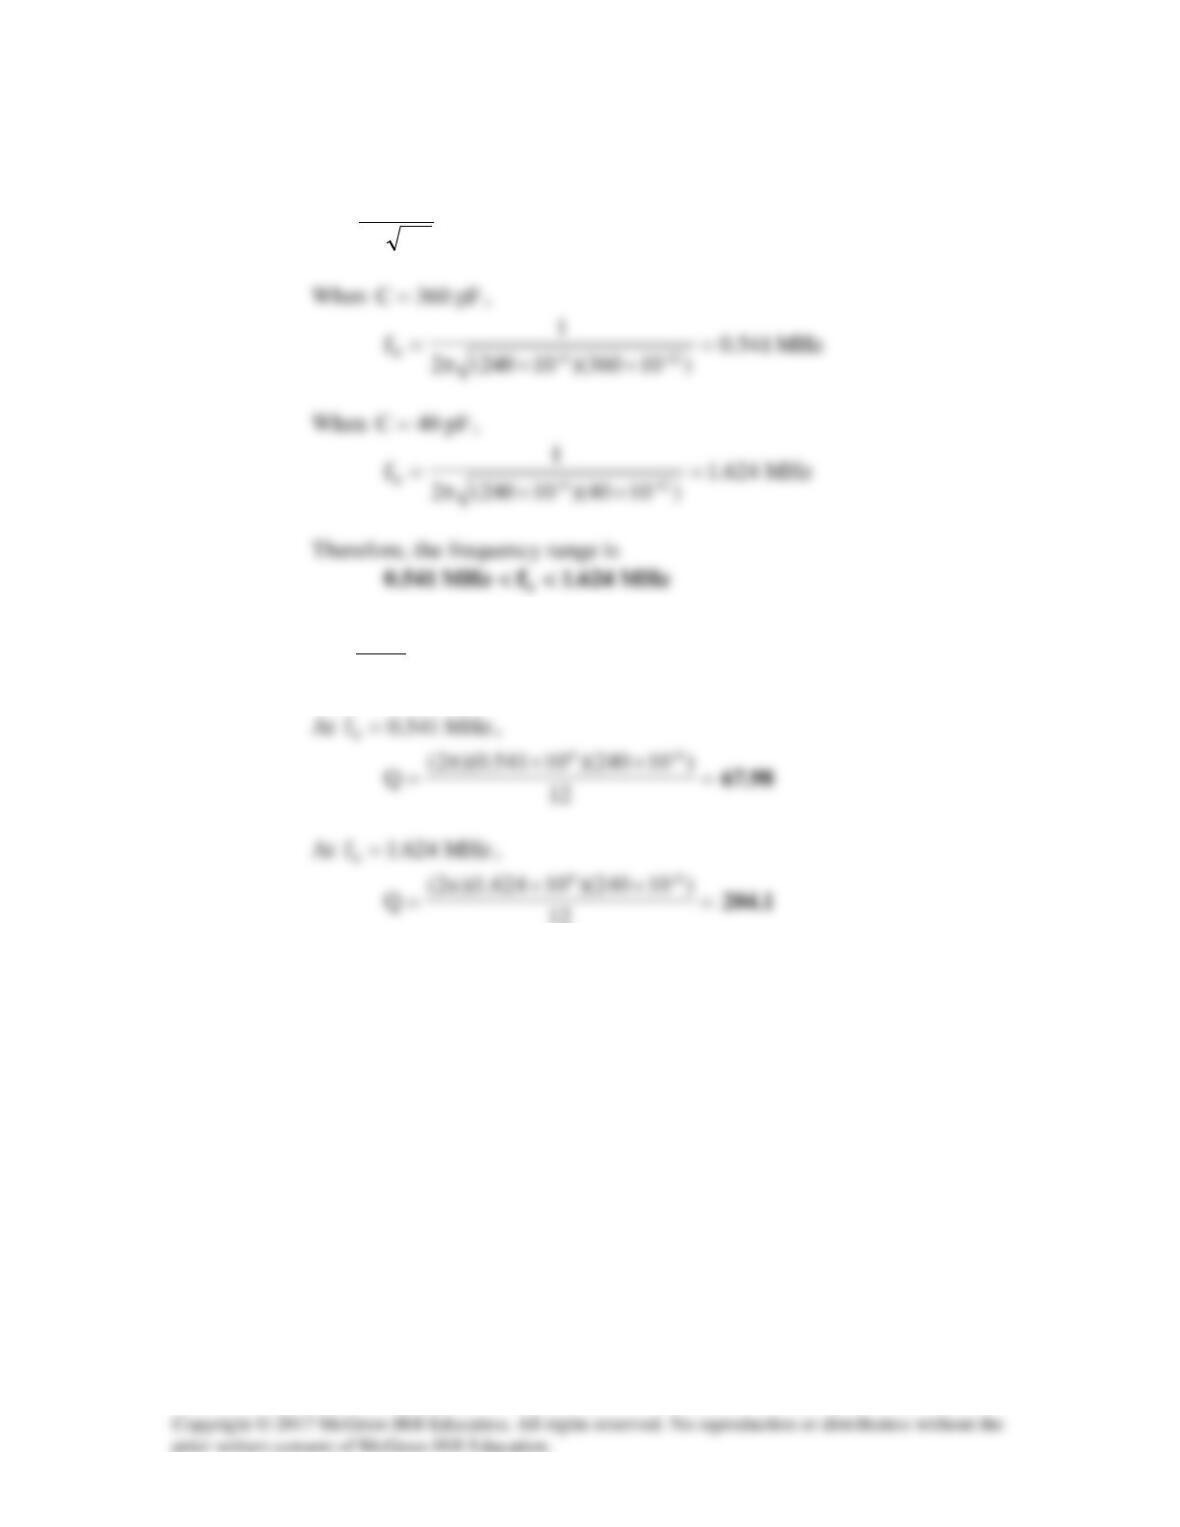
Solution 14.95
(a)
LC2
1
f0π
=
(b)
R
fL2
Q
π
=