Year 0 Year 1 Year 2 Year 3 Year 4 Year 5 Year 6 Year 7 Year 8
Assumptions:
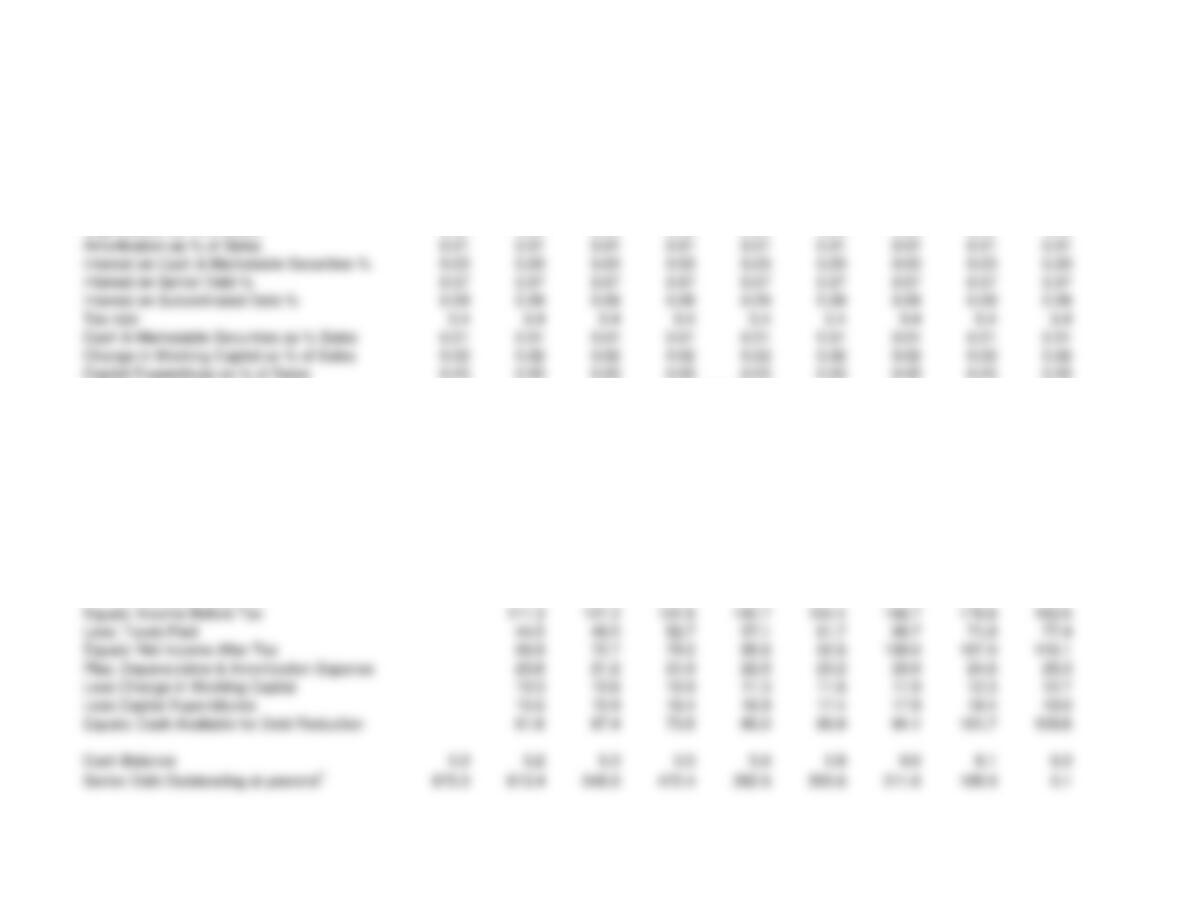
Sales Growth % 0 1.03 1.03 1.03 1.03 1.03 1.03 1.03 1.03
Cost of Sales (COS) as % of Sales 0.5 0.5 0.5 0.5 0.5 0.5 0.5 0.5 0.5
Sales, General & Admin. Exp. as % of Sales 0.1 0.1 0.1 0.1 0.1 0.1 0.1 0.1 0.1
Depreciation as % of Sales 0.03 0.03 0.03 0.03 0.03 0.03 0.03 0.03 0.03
Capital Expenditues as % of Sales 0.03 0.03 0.03 0.03 0.03 0.03 0.03 0.03 0.03
Sales 500.0 515.0 530.5 546.4 562.8 579.6 597.0 614.9 633.4
Less: Cost of Sales 250.0 257.5 265.2 273.2 281.4 289.8 298.5 307.5 316.7
Less: Sales, General Admin. Exp. 50.0 51.5 53.0 54.6 56.3 58.0 59.7 61.5 63.3
Equals: EBITDA 200.0 206.0 212.2 218.5 225.1 231.9 238.8 246.0 253.4
Less: Depreciation 15.0 15.5 15.9 16.4 16.9 17.4 17.9 18.4 19.0
Less: Amortization 5.0 5.2 5.3 5.5 5.6 5.8 6.0 6.1 6.3
Plus: Interest Income 0.2 0.2 0.2 0.2 0.2 0.2 0.2 0.2 0.2
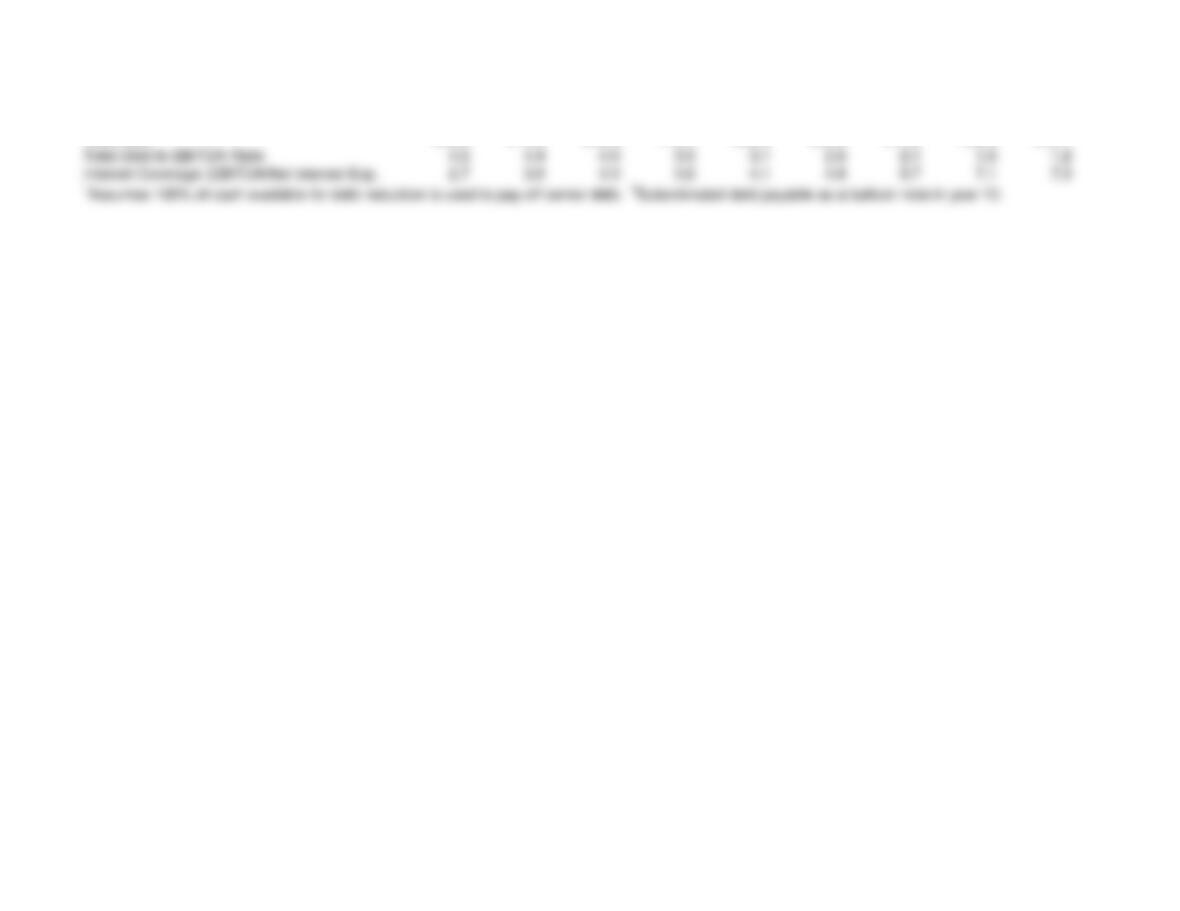
Less: Interest Expense
Senior Debt 47.3 42.9 38.2 33.1 27.5 21.4 14.8 7.7
Subordinated Debt 27.0 27.0 27.0 27.0 27.0 27.0 27.0 27.0
Total Interest Expense 74.3 69.9 65.2 60.1 54.5 48.4 41.8 34.7
($Millions)
Problem 13-11 Solution to Part B
Subordinated Debt Outstanding at yearend2300.0 300.0 300.0 300.0 300.0 300.0 300.0 300.0 300.0
Total Debt 900.0 913.4 846.0 772.4 692.5 605.6 511.6 409.9 300.1