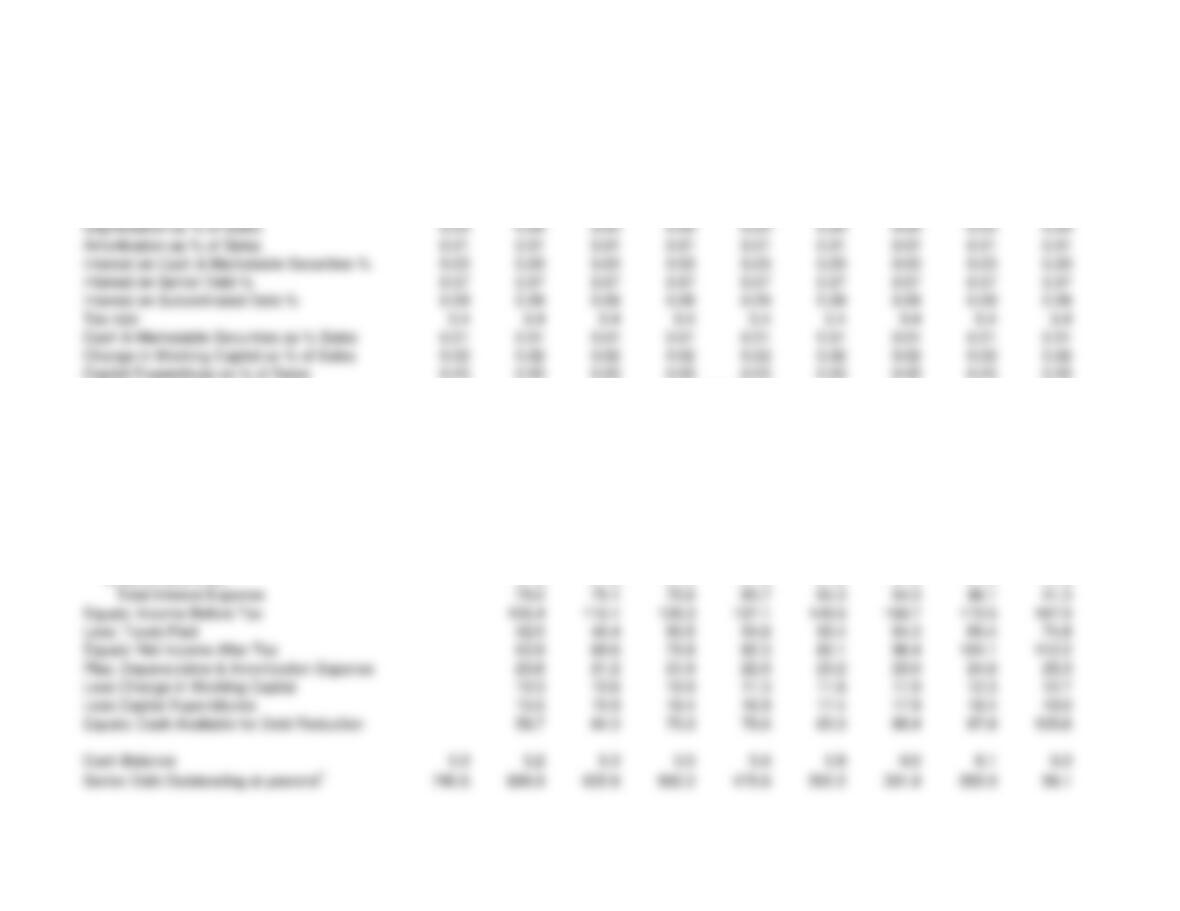
Year 0 Year 1 Year 2 Year 3 Year 4 Year 5 Year 6 Year 7 Year 8
Assumptions:
Sales Growth % 0 1.03 1.03 1.03 1.03 1.03 1.03 1.03 1.03
Cost of Sales (COS) as % of Sales 0.5 0.5 0.5 0.5 0.5 0.5 0.5 0.5 0.5
Sales, General & Admin. Exp. as % of Sales 0.1 0.1 0.1 0.1 0.1 0.1 0.1 0.1 0.1
Capital Expenditues as % of Sales 0.03 0.03 0.03 0.03 0.03 0.03 0.03 0.03 0.03
Sales 500.0 515.0 530.5 546.4 562.8 579.7 597.1 615.0 633.4
Less: Cost of Sales 250.0 257.5 265.3 273.2 281.4 289.8 298.5 307.5 316.7
Less: Sales, General Admin. Exp. 50.0 51.5 53.1 54.6 56.3 58.0 59.7 61.5 63.3
Equals: EBITDA 200.0 206.0 212.2 218.6 225.1 231.9 238.8 246.0 253.4
Less: Depreciation 15.0 15.5 15.9 16.4 16.9 17.4 17.9 18.4 19.0
Less: Amortization 5.0 5.2 5.3 5.5 5.6 5.8 6.0 6.1 6.3
Plus: Interest Income 0.2 0.2 0.2 0.2 0.2 0.2 0.2 0.2 0.2
Less: Interest Expense
Senior Debt 52.2 48.1 43.6 38.7 33.3 27.5 21.1 14.3
Subordinated Debt 27.0 27.0 27.0 27.0 27.0 27.0 27.0 27.0
($Millions)
Problem 13-16 Solution to Part A
Subordinated Debt Outstanding at yearend2300.0 300.0 300.0 300.0 300.0 300.0 300.0 300.0 300.0
Total Debt 1045.6 986.9 922.6 852.2 775.6 692.2 601.8 503.9 398.1