Solution
S-177
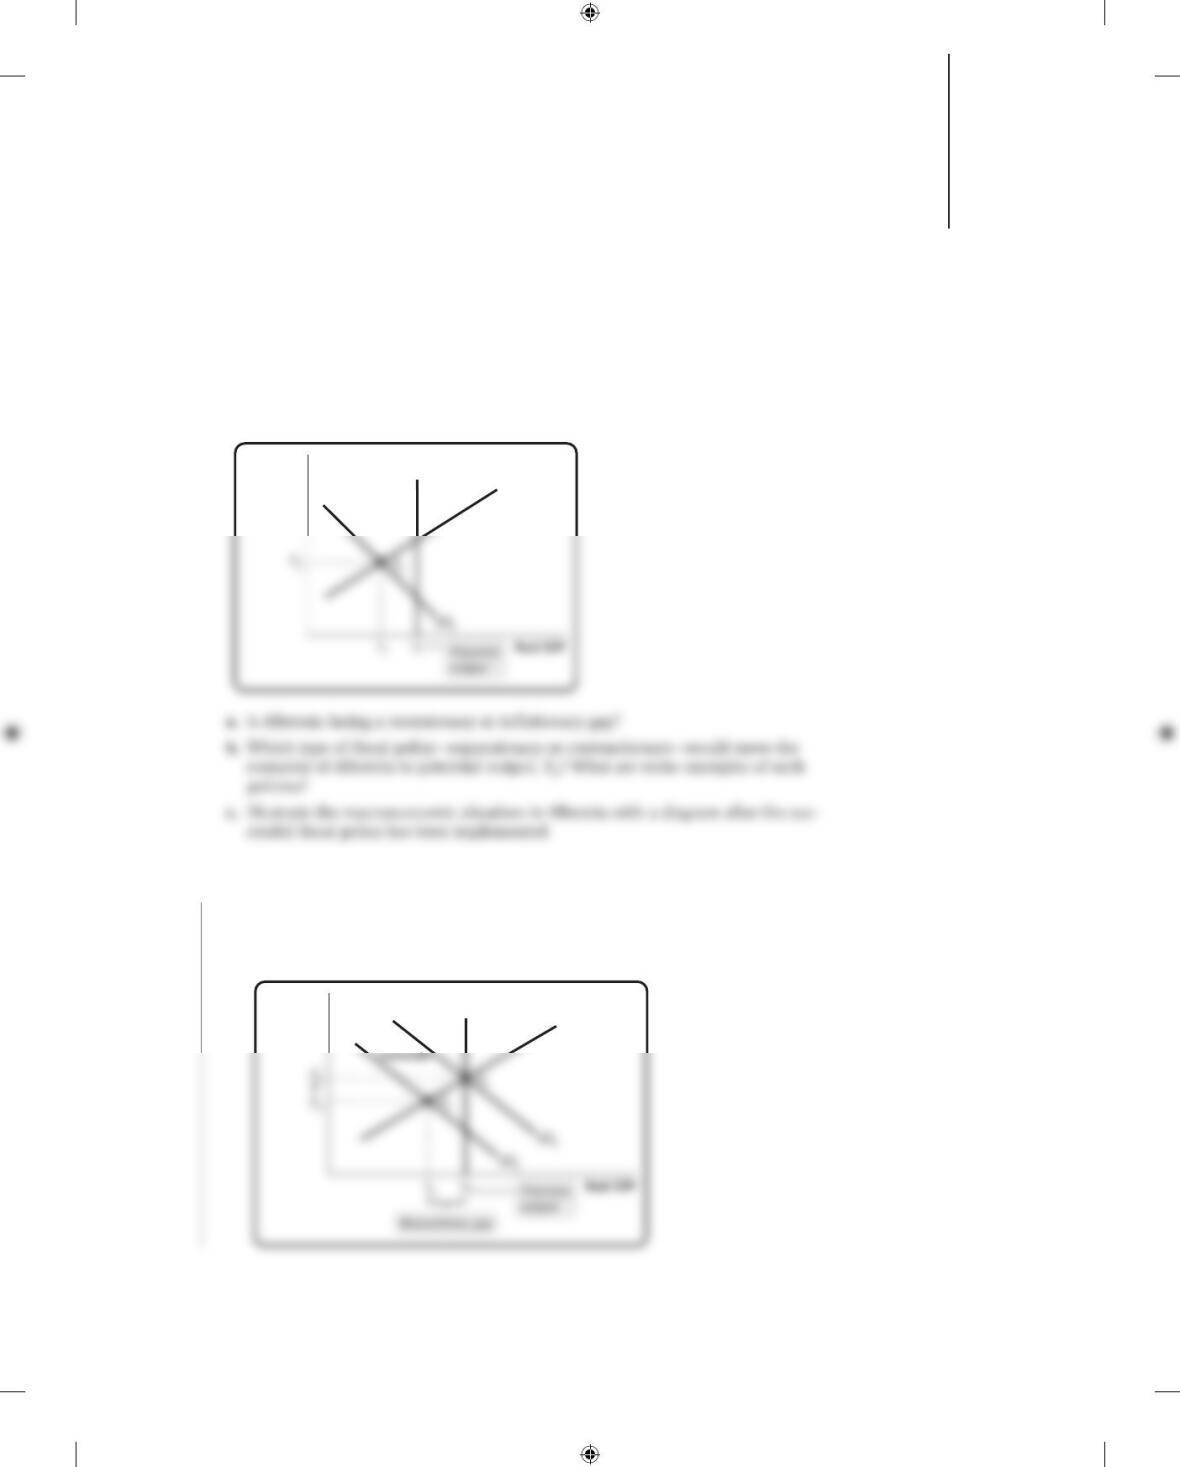
1. The accompanying diagram shows the current macroeconomic situation for the econ-
omy of Albernia. You have been hired as an economic consultant to help the economy
move to potential output, YP.
SRAS
Aggregate
price
level
LRAS
1. a. Albernia is facing a recessionary gap; Y1 is less than YP.
b. Albernia could use expansionary fiscal policies to move the economy to potential
output. Such policies include increasing government purchases of goods and ser-
vices, increasing government transfers, and reducing taxes.
c.
SRAS
Aggregate
price
level
LRAS
Fiscal Policy 13
CHAPTER
KrugWellsECPS4e_Macro_CH13.indd S-177KrugWellsECPS4e_Macro_CH13.indd S-177 1/30/15 12:14 PM1/30/15 12:14 PM
Solution
S-178 CHAPTER 13 FISCAL POLICY
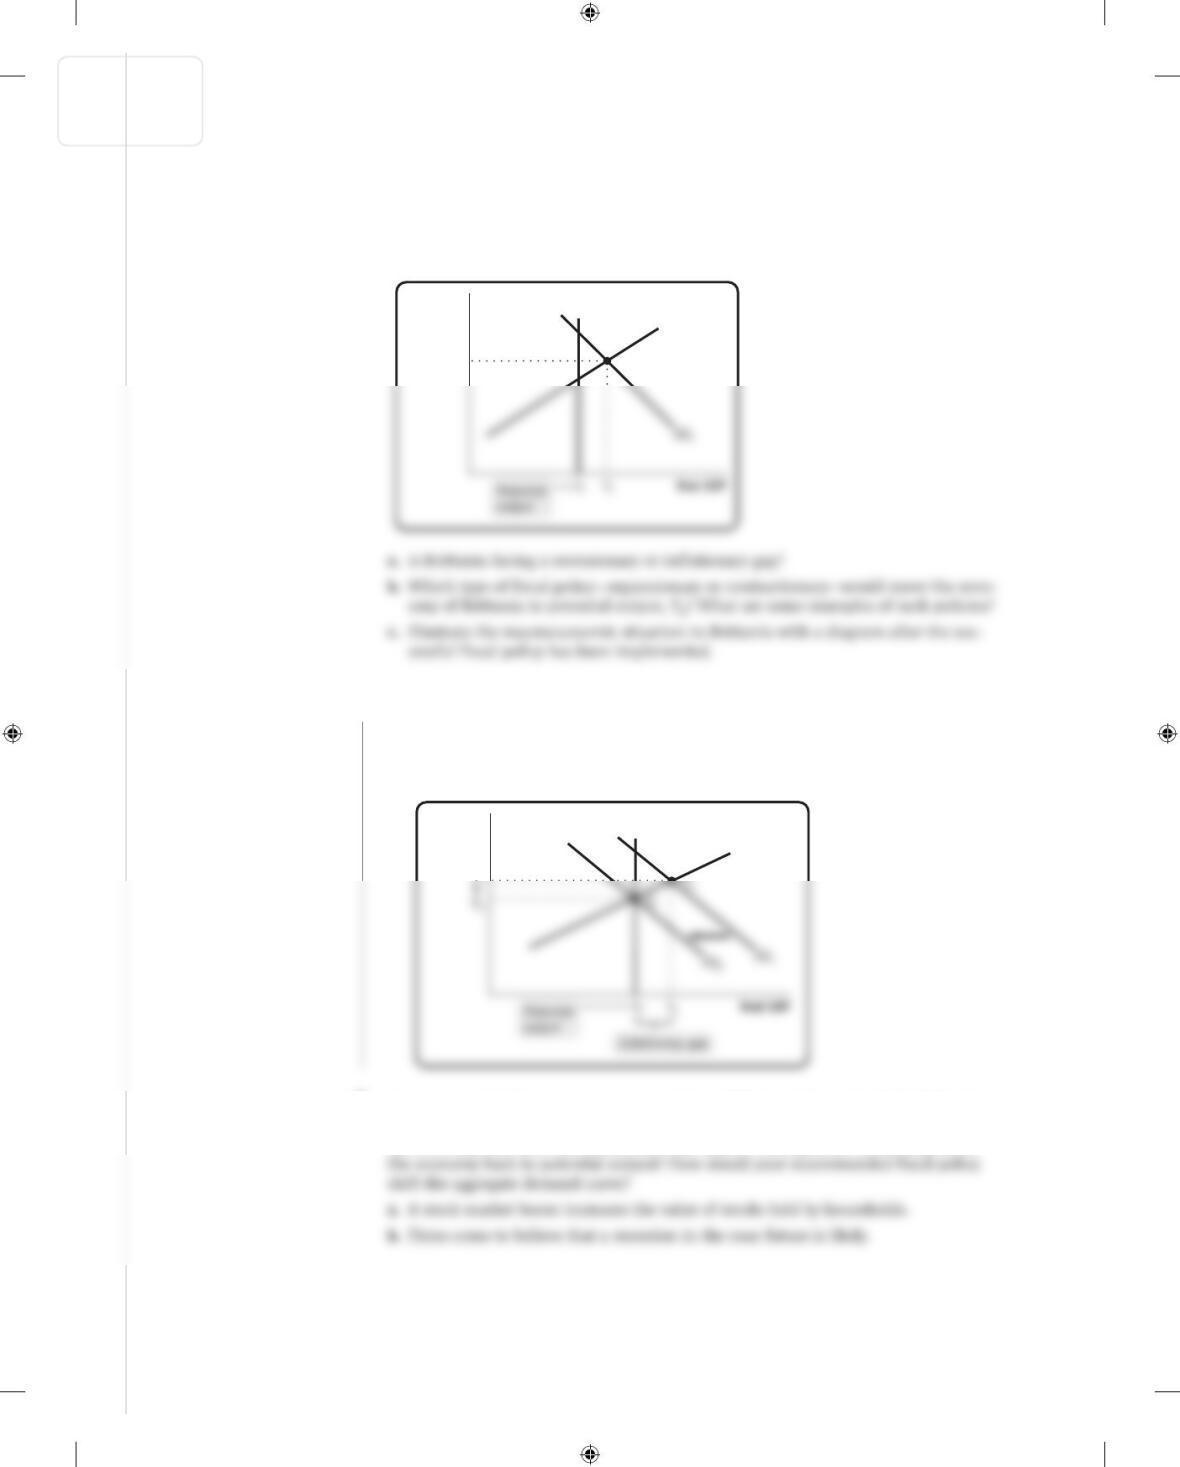
2. The accompanying diagram shows the current macroeconomic situation for the econ-
omy of Brittania; real GDP is Y1, and the aggregate price level is P1. You have been
hired as an economic consultant to help the economy move to potential output, YP.
SRAS
P1
Aggregate
price
level
E1
LRAS
2. a. Brittania is facing an inflationary gap; Y1 is greater than YP.
b. Brittania could use contractionary fiscal policies to move the economy to potential
output. Such policies include reducing government purchases of goods and ser-
vices, lowering government transfers, and raising taxes.
c.
SRAS
P1
Aggregate
price
level
LRAS
3. An economy is in long – run macroeconomic equilibrium when each of the following
aggregate demand shocks occurs. What kind of gap—inflationary or recessionary—will
the economy face after the shock, and what type of fiscal policies would help move
KrugWellsECPS4e_Macro_CH13.indd S-178KrugWellsECPS4e_Macro_CH13.indd S-178 1/30/15 12:14 PM1/30/15 12:14 PM
Solution
CHAPTER 13 FISCAL POLICY S-179
3. a. As the stock market booms and the value of stocks held by households increases,
there will be an increase in consumer spending; this will shift the aggregate
demand curve to the right. The economy will face an inflationary gap. Policy mak–
ers could use contractionary fiscal policies to move the economy back to potential
output. This would shift the aggregate demand curve to the left.
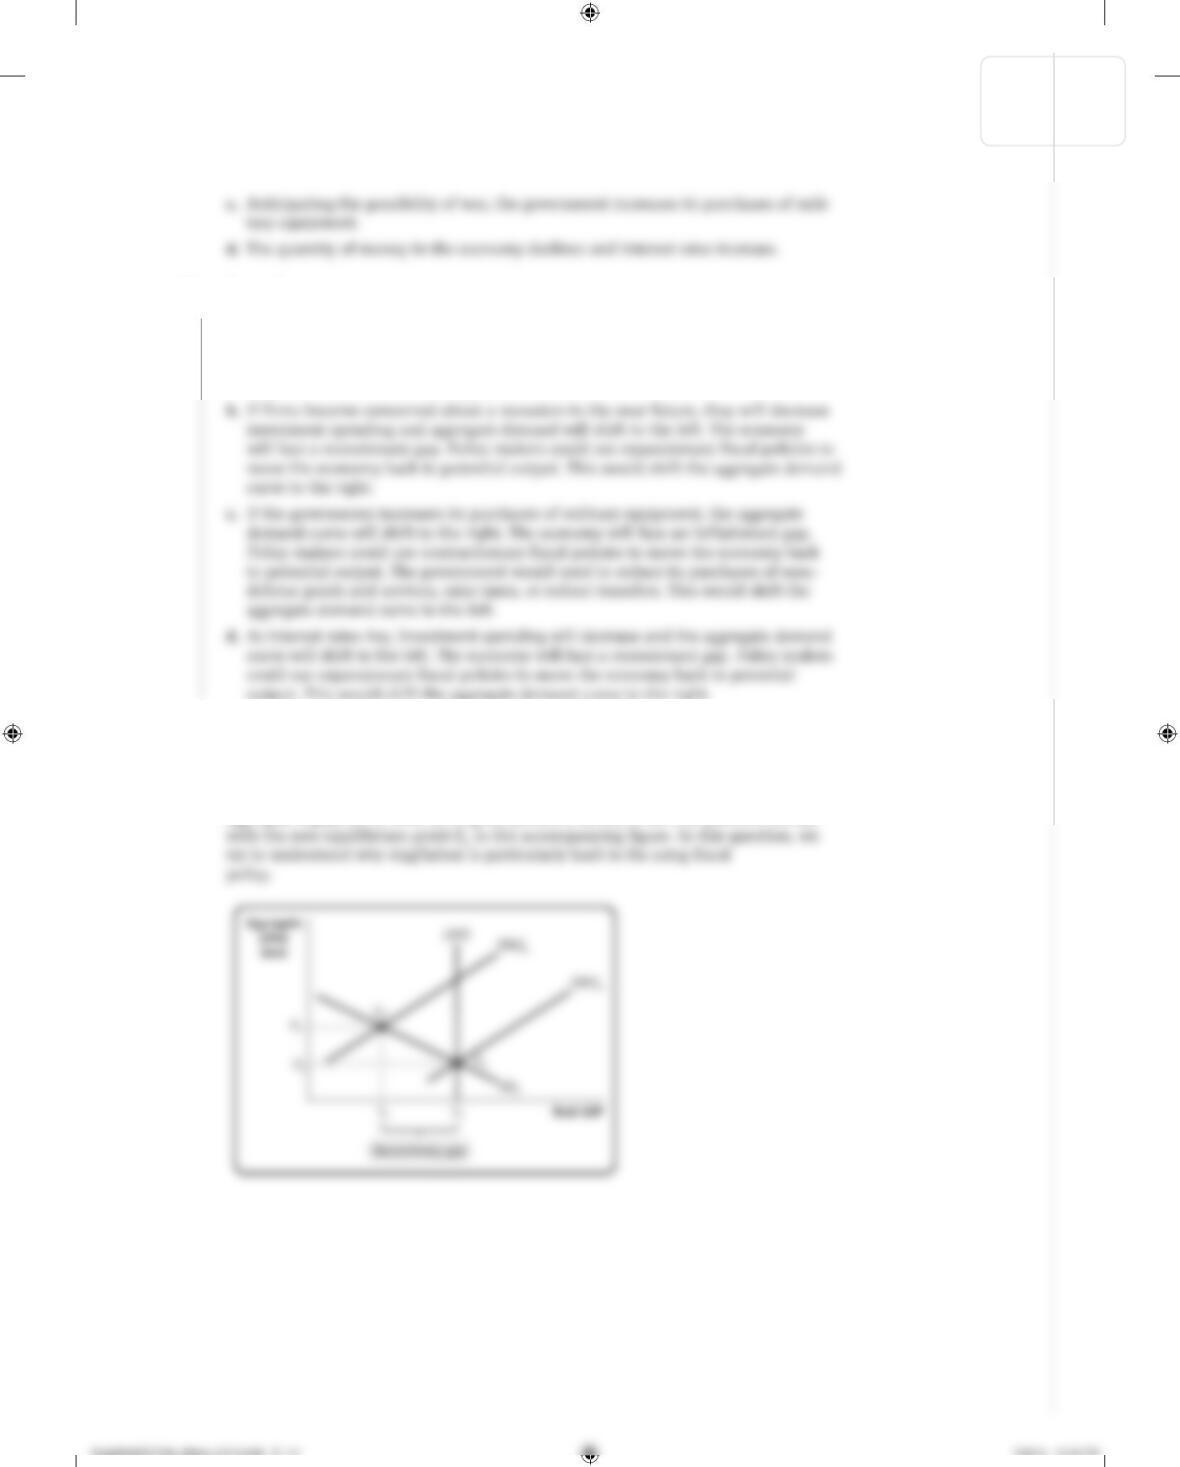
4. During a 2008 interview, then German Finance Minister Peer Steinbrueck said, “We
have to watch out that in Europe and beyond, nothing like a combination of down-
ward economic [growth] and high inflation rates emerges—something that experts
call stagflation.” Such a situation can be depicted by the movement of the short-run
aggregate supply curve from its original position, SRAS1, to its new position, SRAS2,
Solution
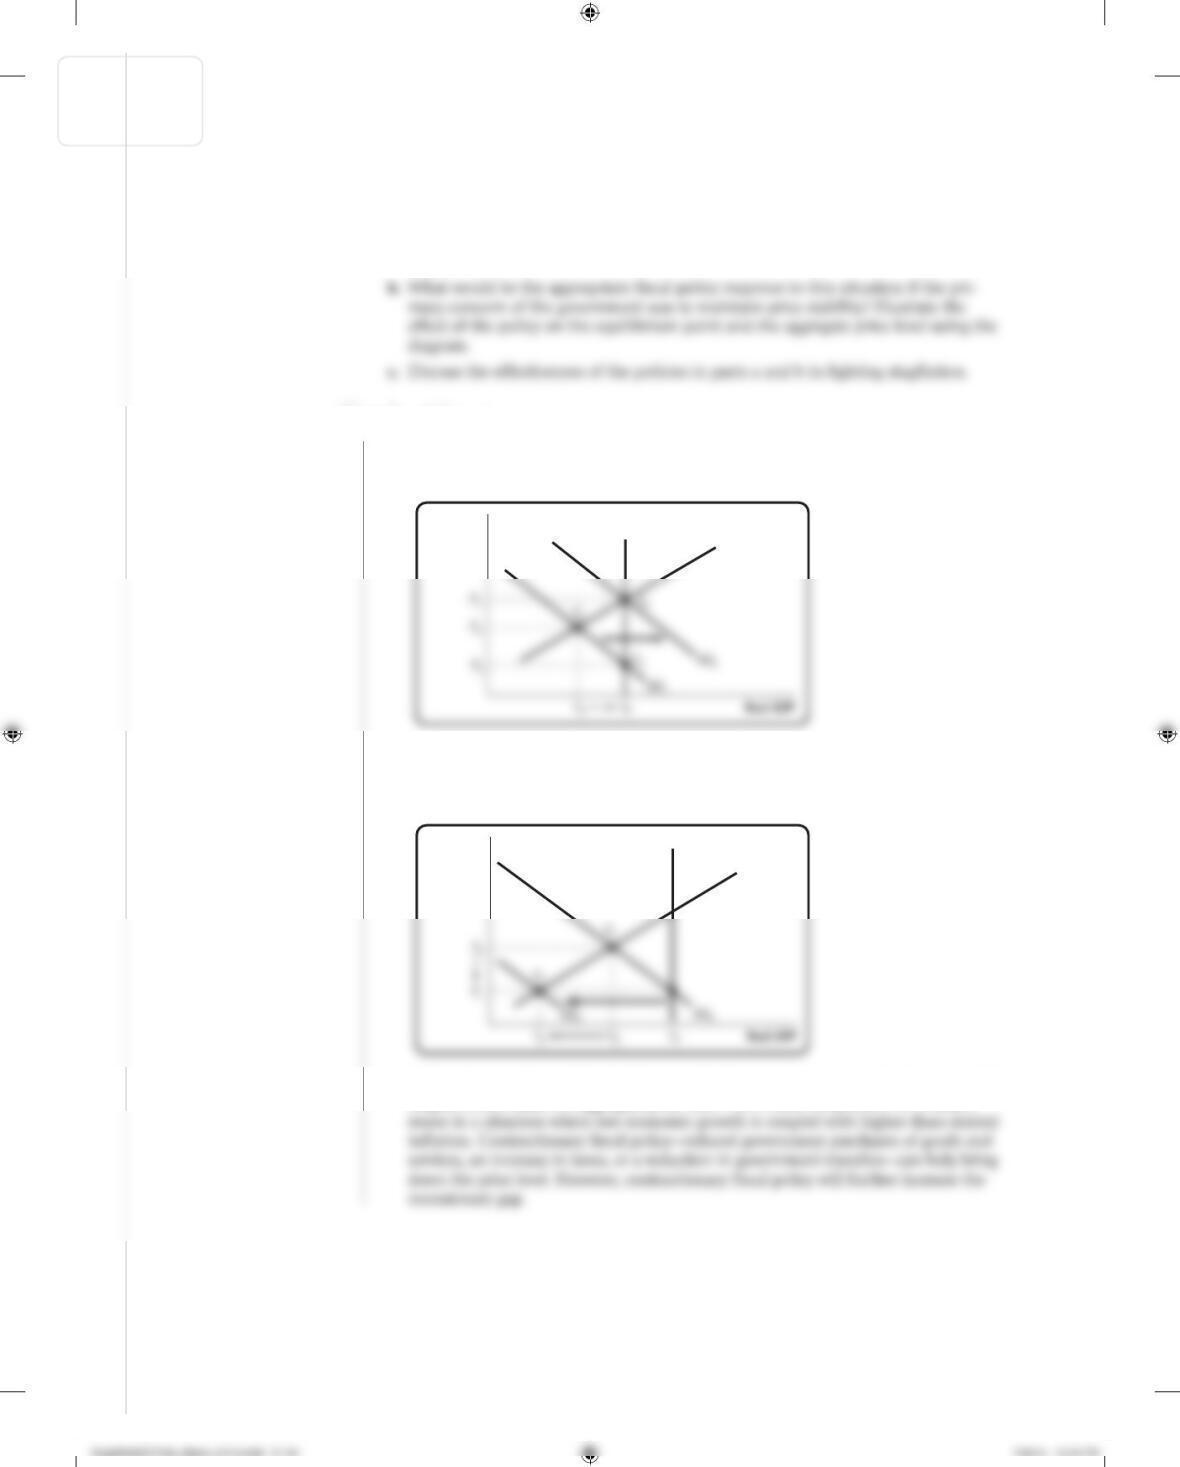
a. What would be the appropriate fiscal policy response to this situation if the pri-
mary concern of the government was to maintain economic growth? Illustrate the
effect of the policy on the equilibrium point and the aggregate price level using the
diagram.
4. a. The government should adopt expansionary fiscal policy, such as lowering taxes
or increasing spending. This would shift the aggregate demand curve to the right,
moving the equilibrium output back to YP but increasing the price to P3.
SRAS2
Aggregate
price
level
LRAS
b. The government should adopt contractionary fiscal policy such as raising taxes or
lowering government spending, causing the aggregate demand curve to shift to the
left. The price level will decrease back to P1, but the recessionary gap will increase.
SRAS2
LRAS
Aggregate
price
level
c. Although expansionary fiscal policy can help bring aggregate output back to potential
output, it also raises the aggregate price level. This makes the problem of inflation
S-180 CHAPTER 13 FISCAL POLICY
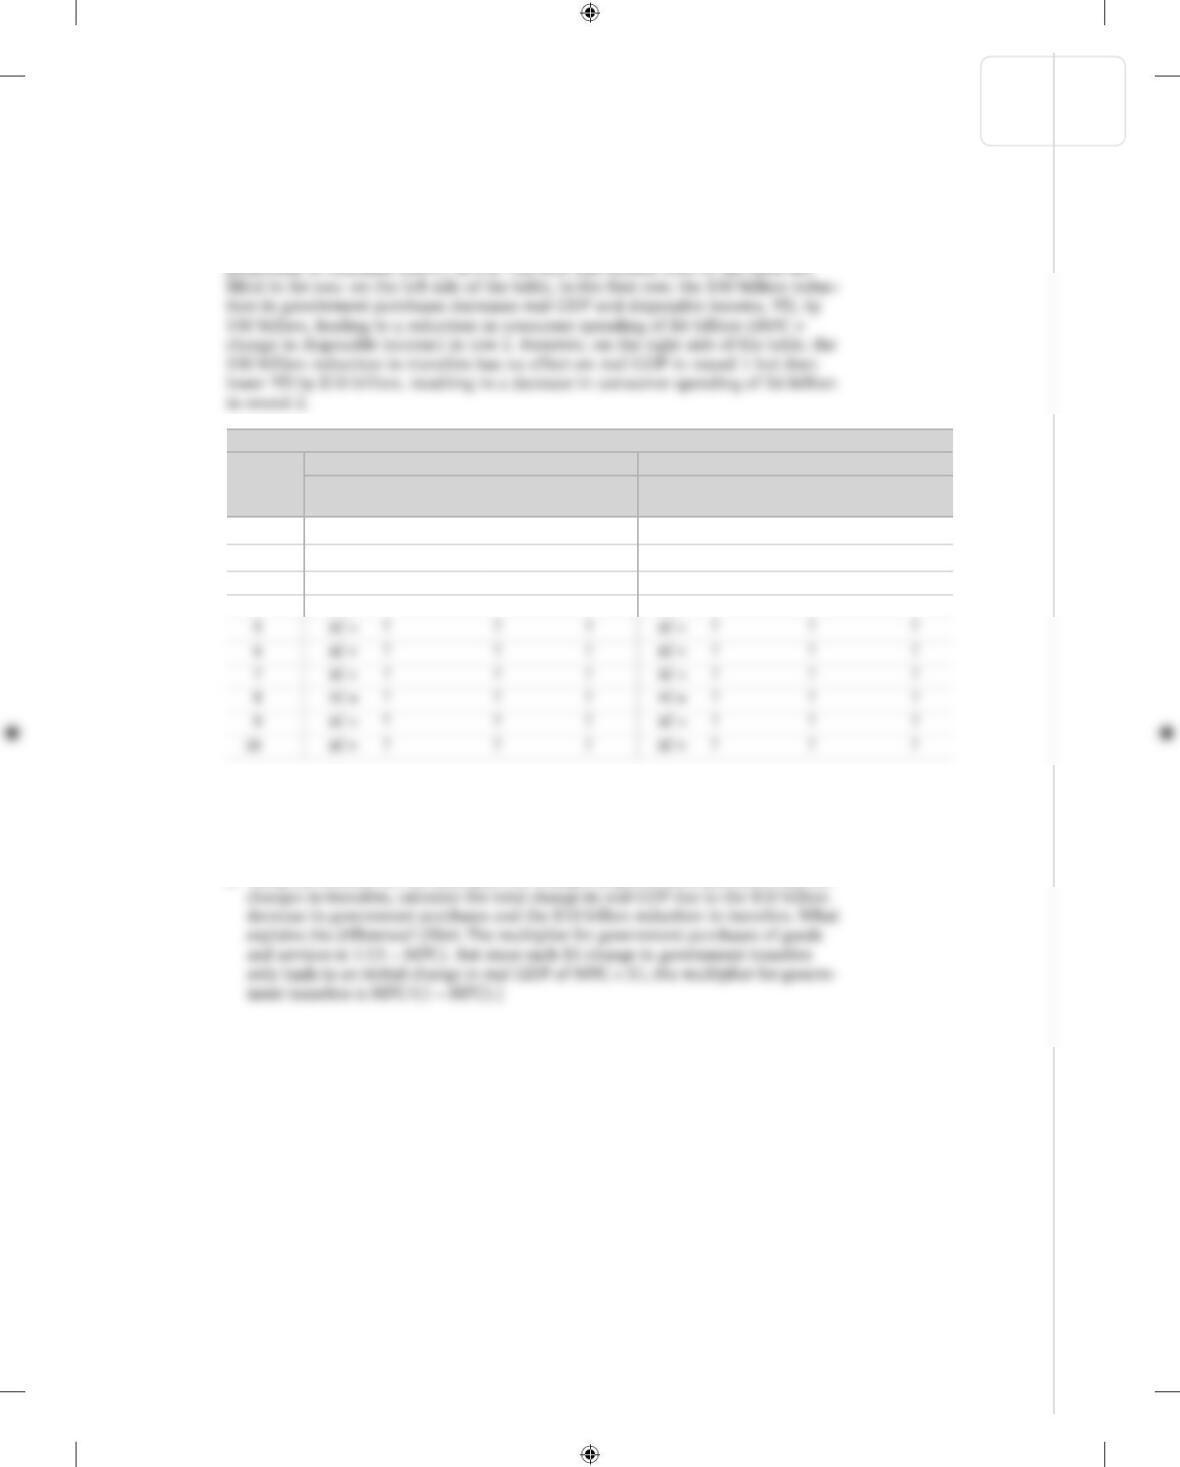
5. Show why a $10 billion reduction in government purchases of goods and services
will have a larger effect on real GDP than a $10 billion reduction in government
transfers by completing the accompanying table for an economy with a marginal
propensity to consume (MPC) of 0.6. The first and second rows of the table are
a. When government purchases decrease by $10 billion, what is the sum of the
changes in real GDP after the 10 rounds?
b. When the government reduces transfers by $10 billion, what is the sum of the
changes in real GDP after the 10 rounds?
c. Using the formula for the multiplier for changes in government purchases and for
CHAPTER 13 FISCAL POLICY S-181
Decrease in G ⴝ ⴚ$10 billion Decrease in TR ⴝ ⴚ$10 billion
Change Change in Change Change Change in Change
in G or C real GDP in YD in TR or C real GDP in YD
Rounds
1 ΔG = −$10.00 −$10.00 −$10.00 ΔTR = −$10.00 $0.00 −$10.00
2 ΔC = −6.00 −6.00 −6.00 ΔC = −6.00 −6.00 −6.00
3 ΔC = ? ? ? ΔC = ? ? ?
4 ΔC = ? ? ? ΔC = ? ? ?
Billions of dollars Billions of dollars
KrugWellsECPS4e_Macro_CH13.indd S-181KrugWellsECPS4e_Macro_CH13.indd S-181 1/30/15 12:14 PM1/30/15 12:14 PM
Solution
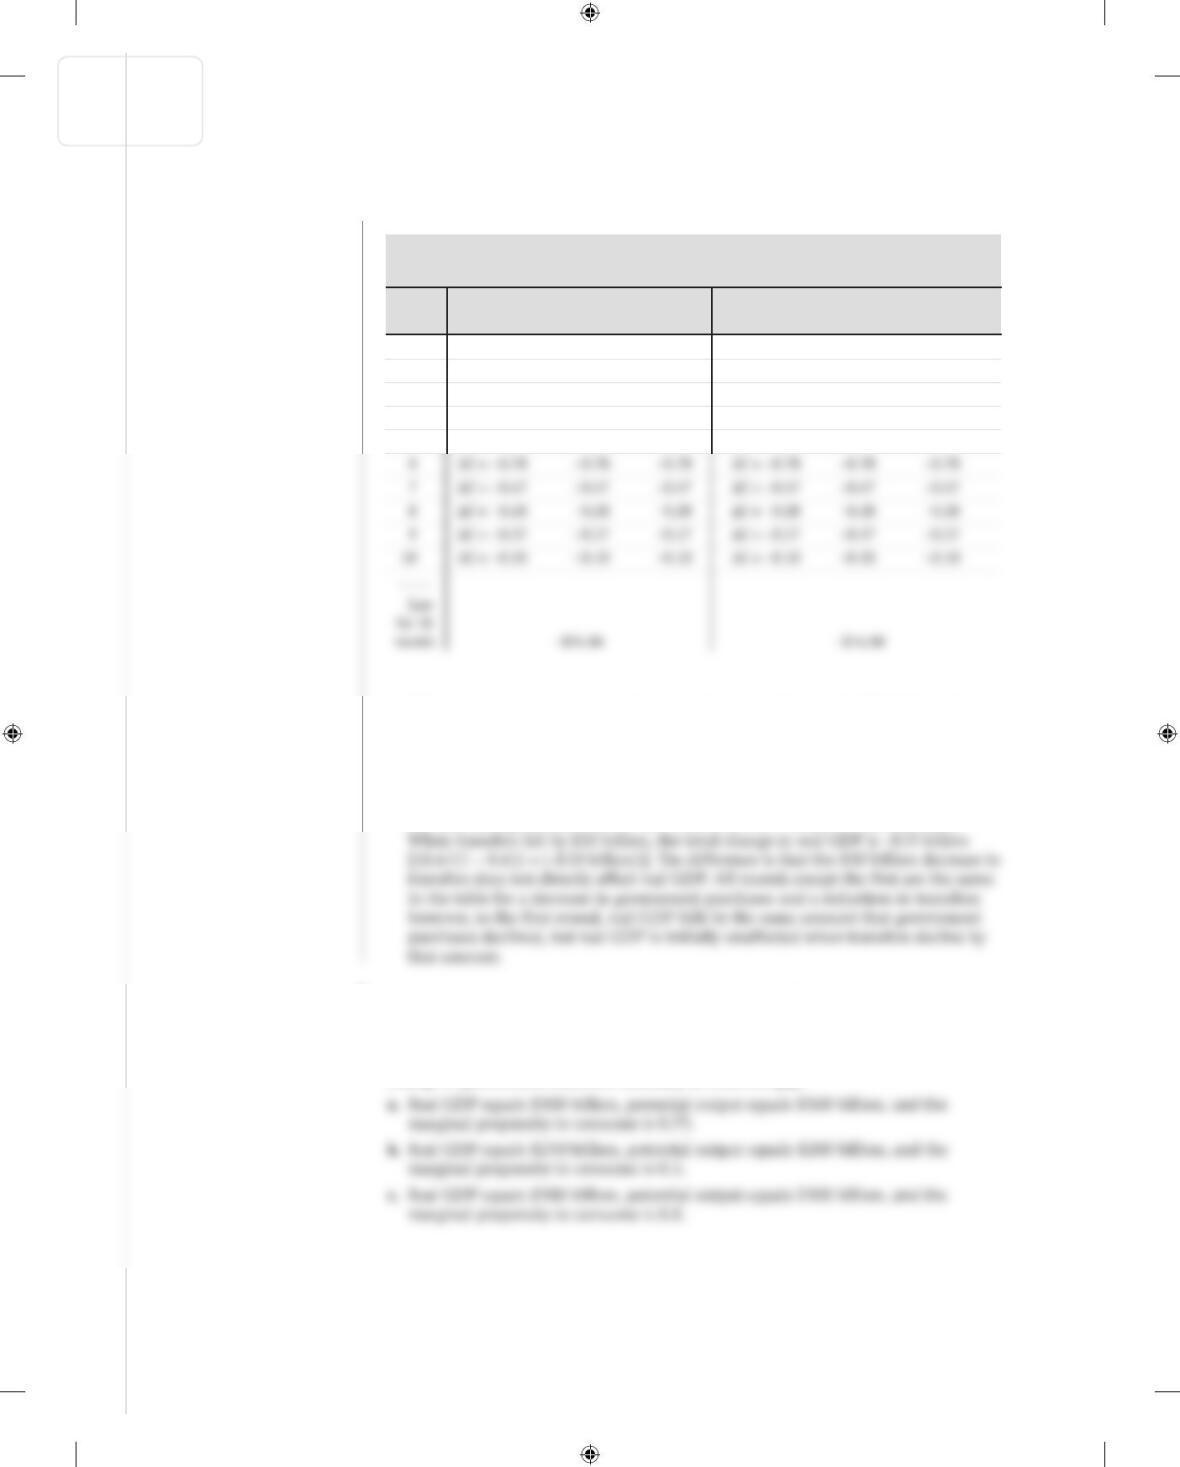
5. Here is the completed table:
a. When government purchases of goods and services decrease by $10 billion, the
change in real GDP is −$24.86 billion after 10 rounds.
b. When government transfers fall by $10 billion, the change in real GDP is −$14.86
billion after 10 rounds.
c. When the government decreases purchases of goods and services by $10 billion,
the total change in real GDP is −$25 billion [(1/(1 − 0.6)) × (−$10 billion)].
6. In each of the following cases, either a recessionary or inflationary gap exists. Assume
that the aggregate supply curve is horizontal, so that the change in real GDP arising
from a shift of the aggregate demand curve equals the size of the shift of the curve.
Calculate both the change in government purchases of goods and services and the
change in government transfers necessary to close the gap.
(billions of dollars)(billions of dollars)
Rounds
1 ⌬G = −$10.00 −$10.00 −$10.00 ⌬TR = −$10.00 $0.00 −$10.00
2 ⌬C = −6.00 −6.00 −6.00 ⌬C = −6.00 −6.00 −6.00
3 ⌬C = −3.60 −3.60 −3.60 ⌬C = −3.60 −3.60 −3.60
4 ⌬C = −2.16 −2.16 −2.16 ⌬C = −2.16 −2.16 −2.16
5 ⌬C = −1.30 −1.30 −1.30 ⌬C = −1.30 −1.30 −1.30
Change in
real GDP
Change in
YD
Change in
G or C
Change in
real GDP
Change in
YD
Change in
TR or C
Decrease in G ⴝ ⴚ$10 billion Decrease in TR ⴝ ⴚ$10 billion
S-182 CHAPTER 13 FISCAL POLICY
KrugWellsECPS4e_Macro_CH13.indd S-182KrugWellsECPS4e_Macro_CH13.indd S-182 1/30/15 12:14 PM1/30/15 12:14 PM
Solution
Solution
Solution
6. a. The economy is facing a recessionary gap; real GDP is less than potential output.
Since the multiplier for a change in government purchases of goods and services is
1/(1 − 0.75) = 4, an increase in government purchases of $15 billion will increase
real GDP by $60 billion and close the recessionary gap. Each dollar of a govern-
7. Most macroeconomists believe it is a good thing that taxes act as automatic stabiliz-
ers and lower the size of the multiplier. However, a smaller multiplier means that the
7. Automatic stabilizers, such as taxes, help to dampen the business cycle. As the
economy expands, taxes increase; this increase acts as a contractionary fiscal policy.
8. The government’s budget surplus in Macroland has risen consistently over the past
five years. Two government policy makers disagree as to why this has happened. One
8. It’s impossible to determine which policy maker is correct given the information avail-
able. Other things equal, the government’s budget surplus will rise either if real GDP
is growing or if Macroland is using contractionary fiscal policy. When the economy
CHAPTER 13 FISCAL POLICY S-183
KrugWellsECPS4e_Macro_CH13.indd S-183KrugWellsECPS4e_Macro_CH13.indd S-183 1/30/15 12:14 PM1/30/15 12:14 PM
Solution
Solution
9. Figure 13-10 shows the actual budget deficit and the cyclically adjusted budget deficit
as a percentage of GDP in the United States from 1970 to 2014. Assuming that poten-
9. Since the cyclically adjusted budget balance is an estimate of what the budget balance
would be if real GDP were exactly equal to potential output, the effects of the business
cycle on the budget has been eliminated. And since we have assumed that there are
no changes in potential output, any change in the cyclically adjusted budget balance
10. You are an economic adviser to a candidate for national office. She asks you for a
summary of the economic consequences of a balanced -budget rule for the federal gov-
ernment and for your recommendation on whether she should support such a rule.
How do you respond?
10. You might respond that balanced- budget rules are usually proposed because the gov-
ernment is running a budget deficit and many people think of deficits as bad. When
the government runs a budget deficit, it adds to the public debt. If the government
persists in running budget deficits, interest payments become an increasing part of
S-184 CHAPTER 13 FISCAL POLICY
KrugWellsECPS4e_Macro_CH13.indd S-184KrugWellsECPS4e_Macro_CH13.indd S-184 1/30/15 12:14 PM1/30/15 12:14 PM
Solution
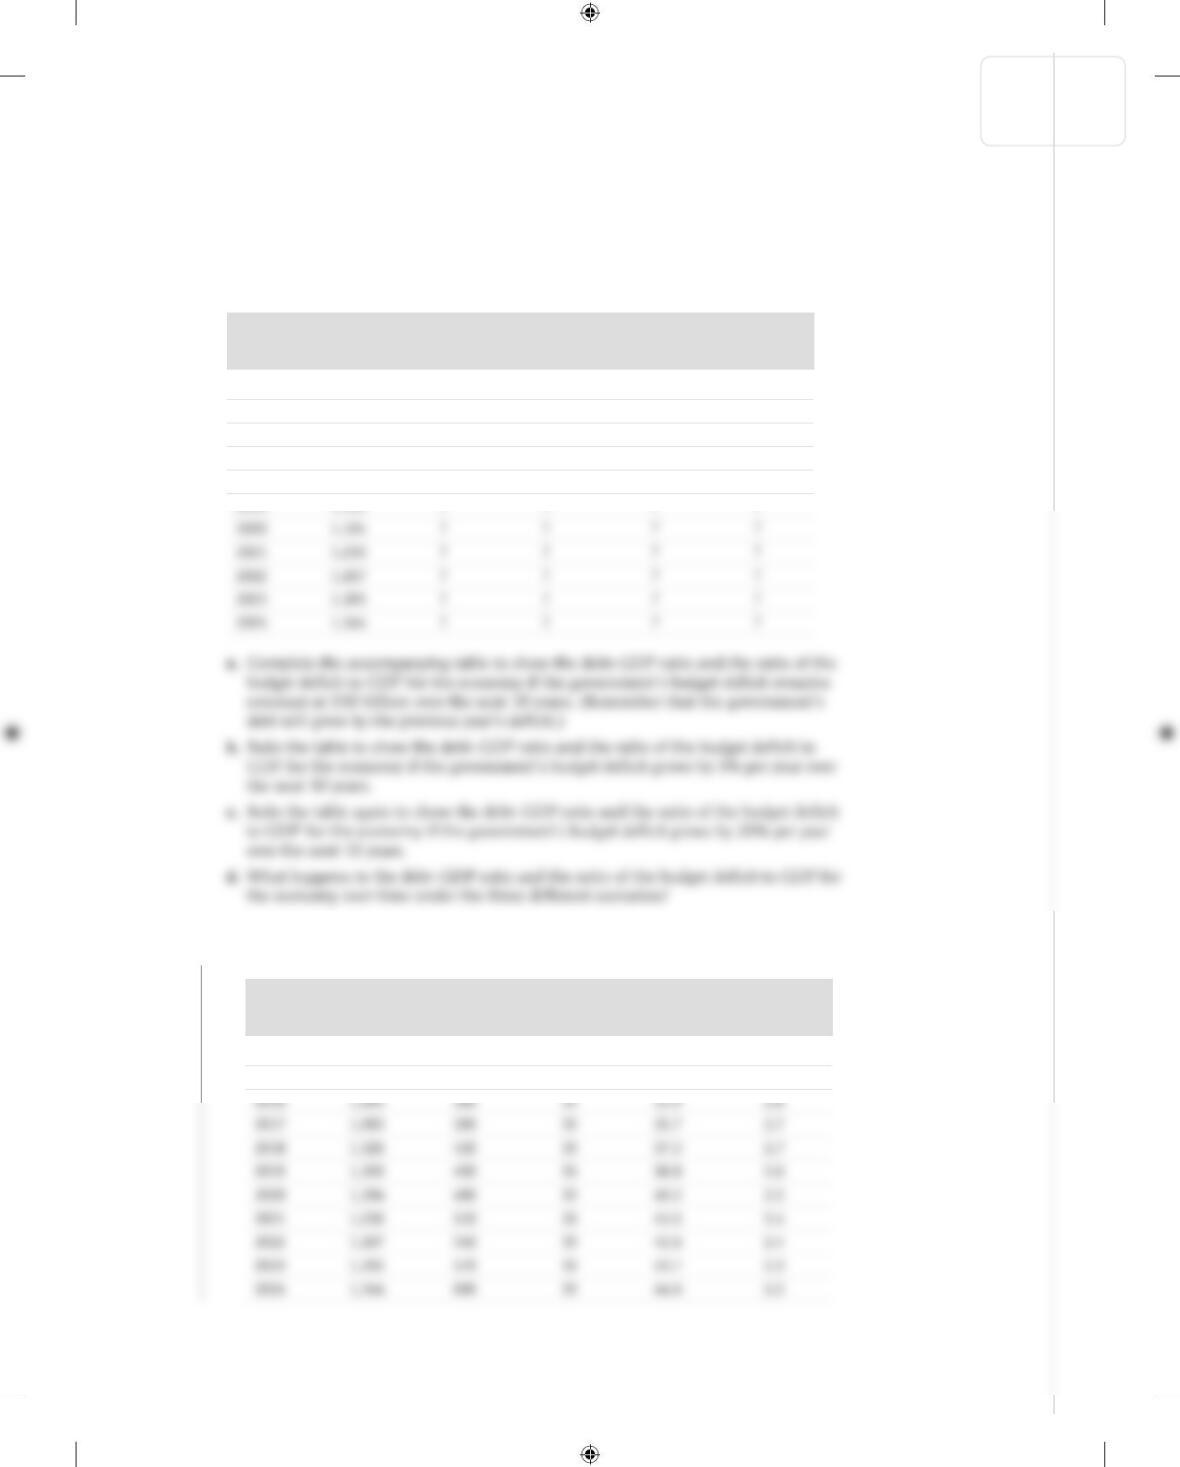
11. In 2014, the policy makers of the economy of Eastlandia projected the debt– GDP
ratio and the ratio of the budget deficit to GDP for the economy for the next 10 years
under different scenarios for growth in the government’s deficit. Real GDP is cur-
rently $1,000 billion per year and is expected to grow by 3% per year, the public debt
is $300 billion at the beginning of the year, and the deficit is $30 billion in 2014.
Real GDP Debt Budget deficit Debt Budget deficit
(billions (billions (billions of (percent of (percent of
Year of dollars) of dollars) dollars) real GDP) real GDP)
2014 $1,000 $300 $30 ? ?
2015 1,030 ? ? ? ?
2016 1,061 ? ? ? ?
2017 1,093 ? ? ? ?
2018 1,126 ? ? ? ?
2019 1,159 ? ? ? ?
11. a. Here is the completed table (numbers are rounded):
Real GDP Debt Budget deficit Debt Budget deficit
(billions (billions (billions of (percent of (percent of
Year of dollars) of dollars) dollars) real GDP) real GDP)
2014 $1,000 $300 $30 30.0% 3.0%
2015 1,030 330 30 32.0 2.9
CHAPTER 13 FISCAL POLICY S-185
KrugWellsECPS4e_Macro_CH13.indd S-185KrugWellsECPS4e_Macro_CH13.indd S-185 1/30/15 12:14 PM1/30/15 12:14 PM
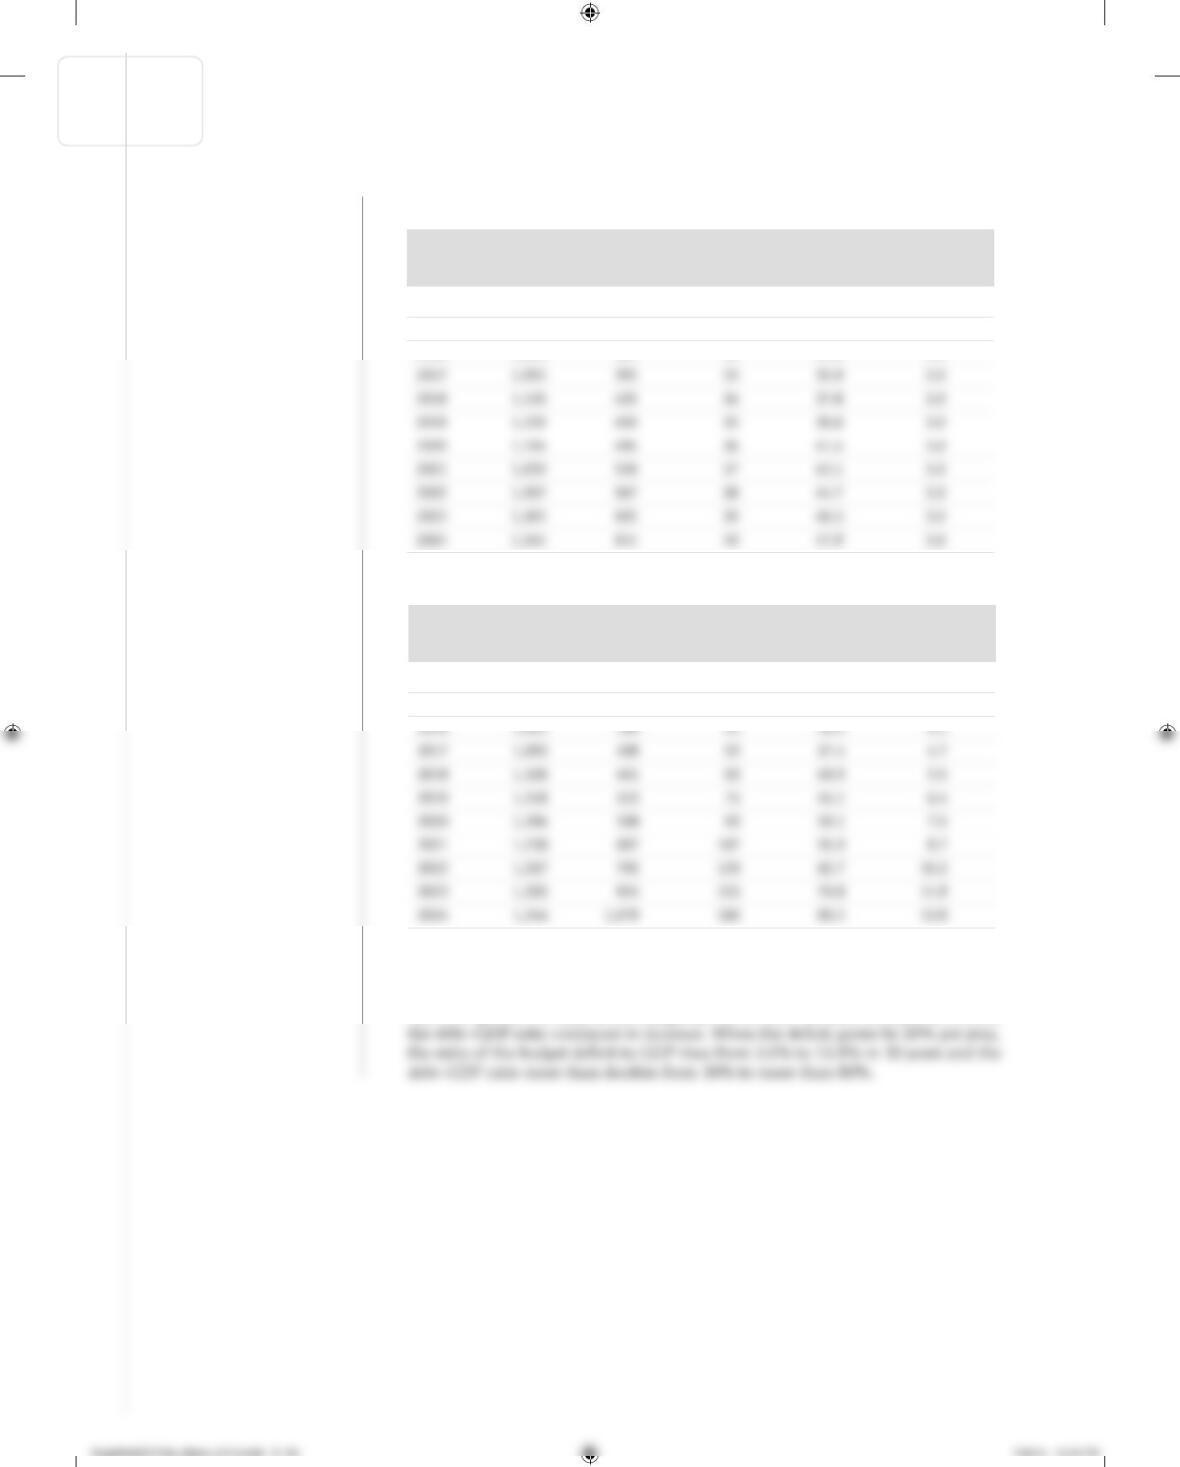
b. Here is the table redone (numbers are rounded):
Real GDP Debt Budget deficit Debt Budget deficit
(billions (billions (billions of (percent of (percent of
Year of dollars) of dollars) dollars) real GDP) real GDP)
2014 $1,000 $300 $30 30.0% 3.0%
2015 1,030 330 31 32.0 3.0
2016 1,061 361 32 34.0 3.0
c. And here is the table again (numbers are rounded):
Real GDP Debt Budget deficit Debt Budget deficit
(billions (billions (billions of (percent of (percent of
Year of dollars) of dollars) dollars) real GDP) real GDP)
2014 $1,000 $300 $30 30.0% 3.0%
2015 1,030 330 36 32.0 3.5
d. When the deficit remains constant at $30 billion, the ratio of the budget deficit to
GDP declines but the debt–GDP ratio continues to increase because debt is rising
faster than GDP. When the deficit grows by 3% per year, the same rate at which
real GDP grows, the ratio of the budget deficit to GDP remains constant at 3% and
S-186 CHAPTER 13 FISCAL POLICY
Solution
Solution
CHAPTER 13 FISCAL POLICY S-187
12. Your study partner argues that the distinction between the government’s budget defi-
cit and debt is similar to the distinction between consumer savings and wealth. He
also argues that if you have large budget deficits, you must have a large debt. In what
ways is your study partner correct and in what ways is he incorrect?
12. Your study partner is correct that the distinction between the government’s budget
deficit and debt is similar to the distinction between consumer savings and wealth.
Savings and deficits refer to actions that take place over time. When the government
13. In which of the following cases does the size of the government’s debt and the size of
the budget deficit indicate potential problems for the economy?
a. The government’s debt is relatively low, but the government is running a large bud-
13. a. If the government has relatively little debt but is running a large budget deficit as
it builds a high- speed rail system, this should not indicate potential problems for
the economy. Like funding a war effort, it is difficult, if not impossible, to finance
major improvements in a nation’s infrastructure without borrowing. As long as
the budget deficit ends with the building project, this should not create long- term
problems.
KrugWellsECPS4e_Macro_CH13.indd S-187KrugWellsECPS4e_Macro_CH13.indd S-187 1/30/15 12:14 PM1/30/15 12:14 PM
Solution
14. How did or would the following affect the current public debt and implicit liabilities
of the U.S. government?
a. In 2003, Congress passed and President Bush signed the Medicare Modernization
Act, which provides seniors and individuals with disabilities with a prescription
14. a. Because of its immediate impact on government spending, the Medicare
Modernization Act increased the current public debt; implicit liabilities also rose
because the act commits the government to a higher level of spending in the
future.
15. Unlike households, governments are often able to sustain large debts. For example,
in 2013, the U.S. government’s total debt reached $17.3 trillion, approximately equal
to 101.6% of GDP. At the time, according to the U.S. Treasury, the average interest
rate paid by the government on its debt was 2.0%. However, running budget deficits
becomes hard when very large debts are outstanding.
a. Calculate the dollar cost of the annual interest on the government’s total debt
assuming the interest rate and debt figures cited above.
b. If the government operates on a balanced budget before interest payments are
S-188 CHAPTER 13 FISCAL POLICY
Solution
Solution
15. a. The annual interest on the debt is 2.0% of $17.8 trillion, or $356 billion.
b. U.S. GDP must grow at 2.0% so that the debt–GDP ratio remains unchanged. This
is because the total debt and GDP would grow at the same rate.
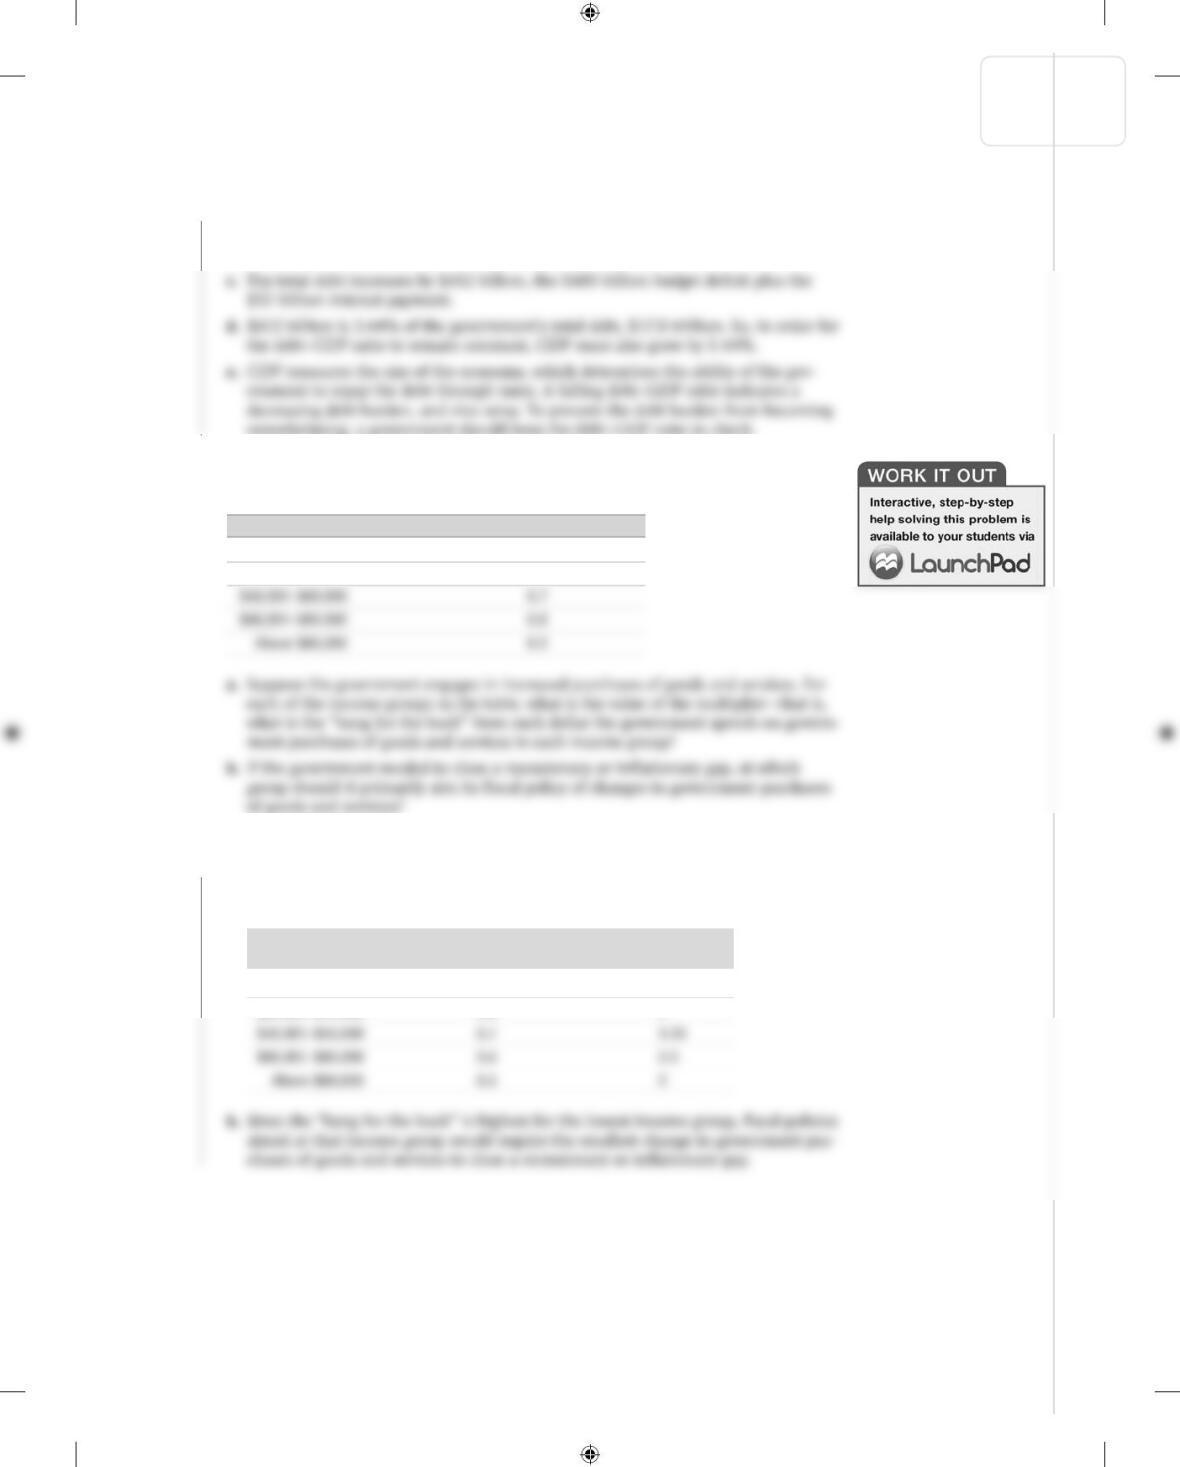
16. The accompanying table shows how consumers’ marginal propensities to consume in
a particular economy are related to their level of income.
Income range Marginal propensity to consume
$0–$20,000 0.9
$20,001–$40,000 0.8
16. a. The accompanying table shows the “bang for the buck” for an additional $1 of gov-
ernment purchases of goods and services for a consumer in each income range. It
is calculated as 1/(1 − MPC).
Marginal propensity
Income range to consume “Bang for the buck”
$0–$20,000 0.9 10
$20,001–$40,000 0.8 5
CHAPTER 13 FISCAL POLICY S-189
KrugWellsECPS4e_Macro_CH13.indd S-189 1/30/15 12:14 PM