13-1
CHAPTER 13
Financial Statement Analysis
OVERVIEW OF EXERCISES, PROBLEMS, AND CASES
Estimated
Time in
Learning Objectives Exercises Minutes Level
Module 1
1. Explain the various limitations and considerations in financial
statement analysis.
Module 2
4. Compute and use various ratios to assess liquidity. 1 10 Mod
2 15 Mod
3 10 Mod
Module 3
5. Compute and use various ratios to assess solvency. 8 20 Mod
9 20 Mod
10 10 Mod
Module 4
6. Compute and use various ratios to assess profitability. 11 15 Mod
12 15 Mod
13-2 FINANCIAL ACCOUNTING SOLUTIONS MANUAL
Problems Estimated
and Time in
Learning Objectives Alternates Minutes Level
Module 1
1. Explain the various limitations and considerations in financial
statement analysis.
Module 2
4. Compute and use various ratios to assess liquidity. 1 40 Mod
2 40 Mod
5* 30 Mod
7* 40 Mod
Module 3
5. Compute and use various ratios to assess solvency. 1** 30 Mod
2** 30 Mod
CHAPTER 13 • FINANCIAL STATEMENT ANALYSIS 13-3
Estimated
Time in
Learning Objectives Cases Minutes Level
Module 1
1. Explain the various limitations and considerations in financial
statement analysis.
6 45 Mod
Module 2
4. Compute and use various ratios to assess liquidity. 4* 45 Mod
5* 45 Mod
7* 45 Diff
8 20 Mod
Module 3
Module 4
13-4 FINANCIAL ACCOUNTING SOLUTIONS MANUAL
EXERCISES
LO 4 EXERCISE 13-1 WORKING BACKWARD: CURRENT RATIO
The current ratio on December 31, 2015, is $120,000/$100,000 = 1.20. The ratio in-
creased during 2016 by 25%; thus, the ratio at the end of 2016 is 1.20 × 125% = 1.50.
Current liabilities are $140,000 at the end of 2016; thus, current assets are $140,000 ×
1.50 = $210,000.
LO 4 EXERCISE 13-2 ACCOUNTS RECEIVABLE ANALYSIS
1. Accounts receivable turnover:
2. Number of days’ sales in receivables:
3. The average age of a receivable in 2015 was the same number of days as the max-
imum credit period of 60 days. The average age in 2016 of 75 days, however, is sig-
nificantly in excess of the credit period. The company needs to investigate this
LO 4 EXERCISE 13-3 WORKING BACKWARD: ACCOUNTS RECEIVABLE ANALYSIS
The average time to collect accounts receivable is 30 days plus 15 days = 45 days. This
CHAPTER 13 • FINANCIAL STATEMENT ANALYSIS 13-5
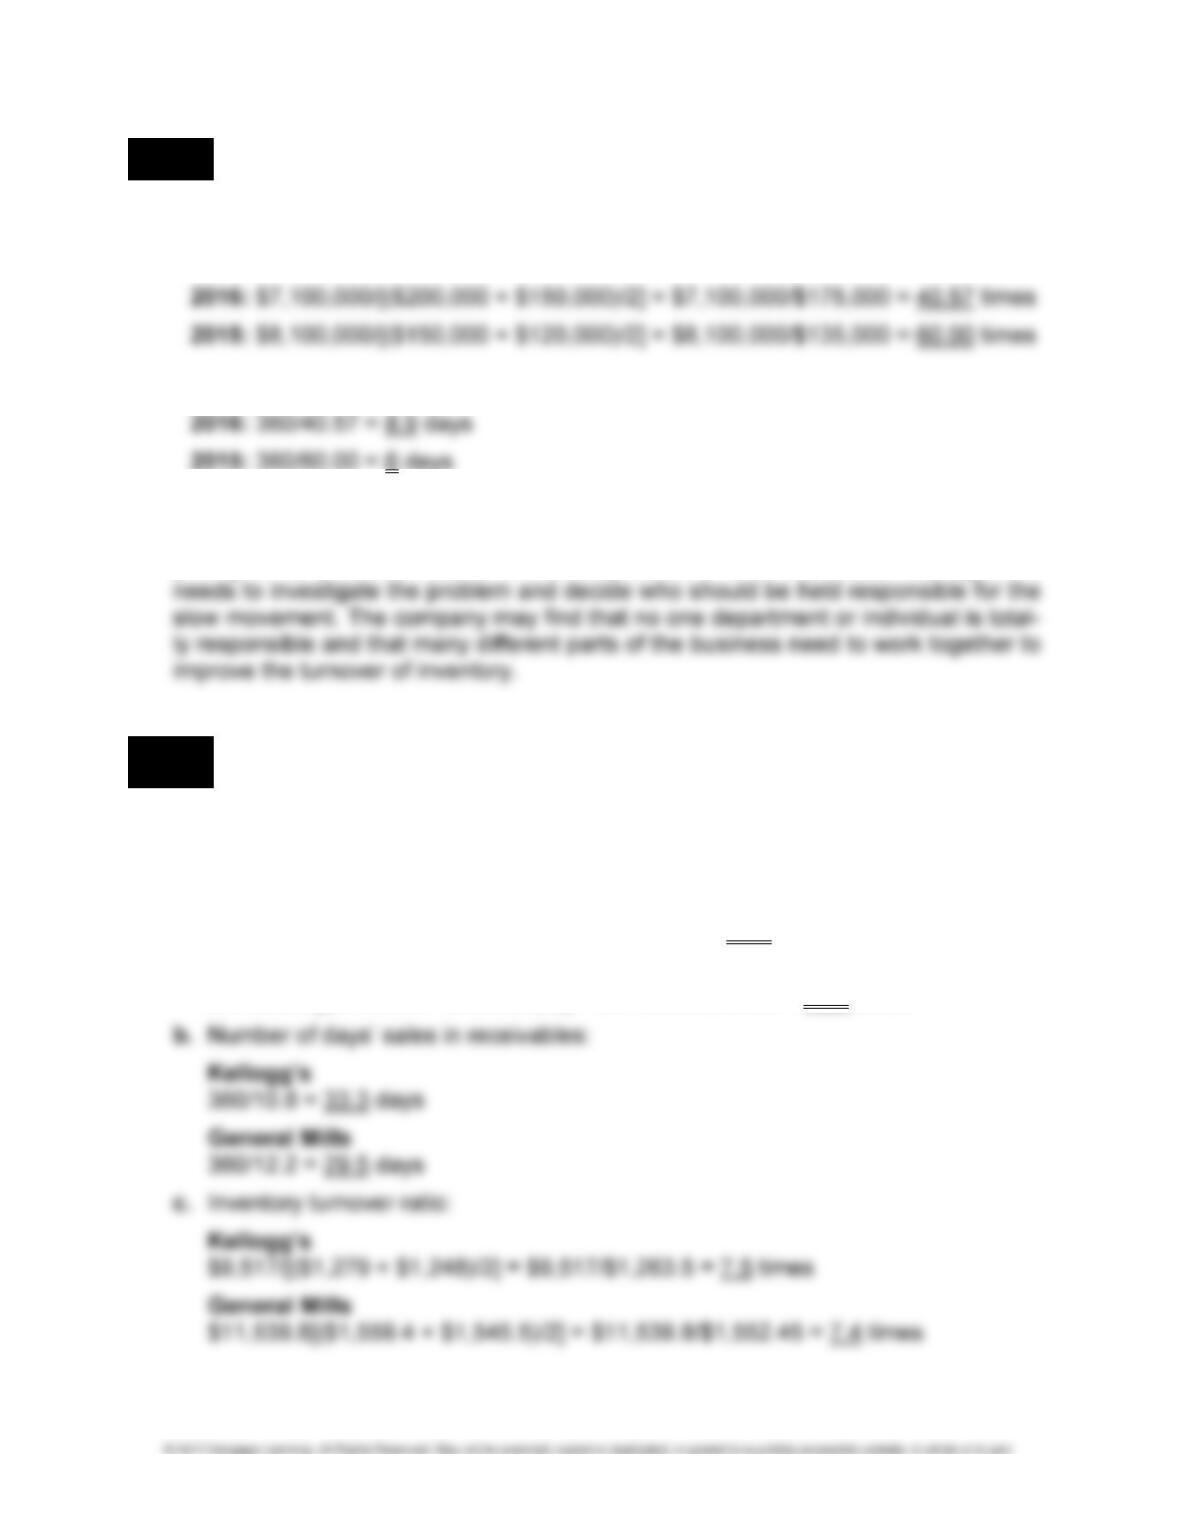
LO 4 EXERCISE 13-4 INVENTORY ANALYSIS
1. Inventory turnover:
Cost of goods sold/Average inventory:
2. Number of days’ sales in inventory:
3. Inventory turnover has declined dramatically from the prior year. Many different ex-
planations are possible for this decline, such as problems in the sales effort, over-
pricing of the products relative to the competition, or inferior produce. Management
LO 4 EXERCISE 13-5 ACCOUNTS RECEIVABLE AND INVENTORY ANALYSES FOR
KELLOGG’S AND GENERAL MILLS
1. Calculations (all dollar amounts in millions):
a. Accounts receivable turnover ratio:
Kellogg’s
$14,580/[($1,276 + $1,424)/2] = $14,580/$1,350 = 10.8 times
General Mills
$17,909.6/[($1,483.6 + $1,446.4)/2] = $17,909.6/$1,465 = 12.2 times
13-6 FINANCIAL ACCOUNTING SOLUTIONS MANUAL
EXERCISE 13-5 (Concluded)
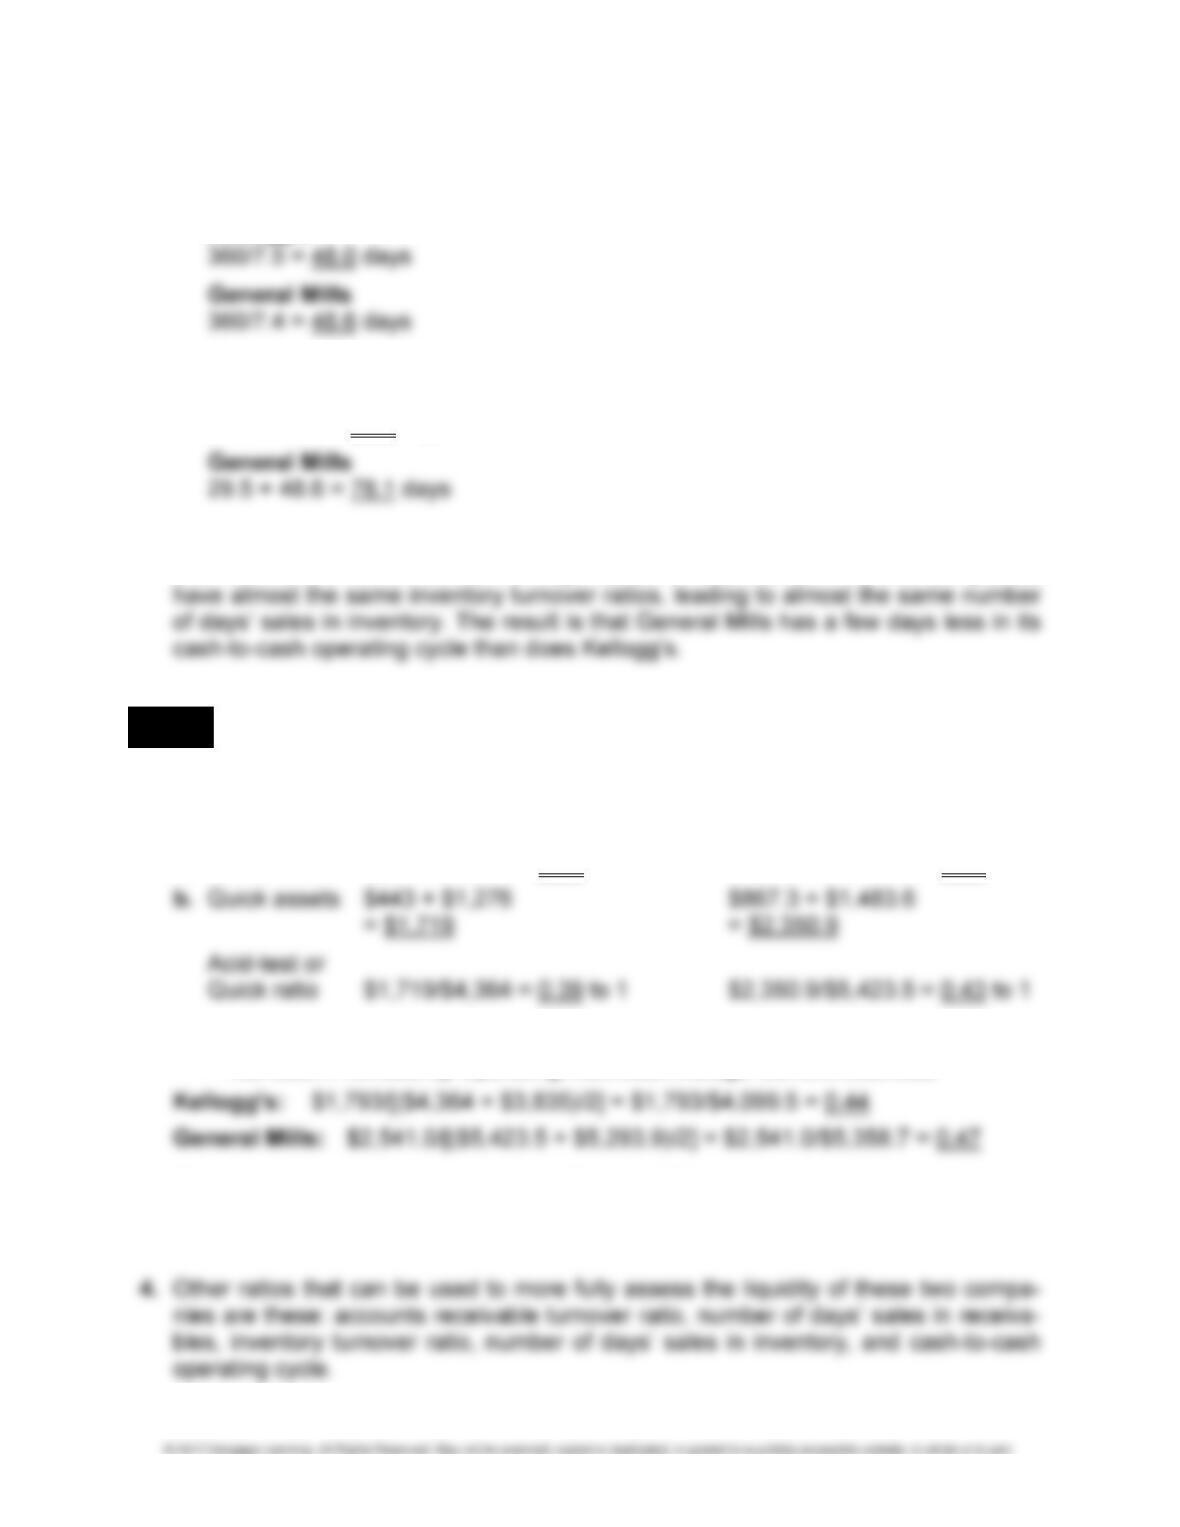
d. Number of days’ sales in inventory:
Kellogg’s
e. Cash-to-cash operating cycle:
Kellogg’s
33.3 + 48.0 = 81.3 days
2. General Mills has a slightly higher accounts receivable turnover ratio than Kellogg’s
and therefore a lower number of days’ sales in receivables. The two companies
LO 4 EXERCISE 13-6 LIQUIDITY ANALYSES FOR KELLOGG’S AND GENERAL MILLS
1. Calculations (all dollar amounts in millions):
Kellogg’s General Mills
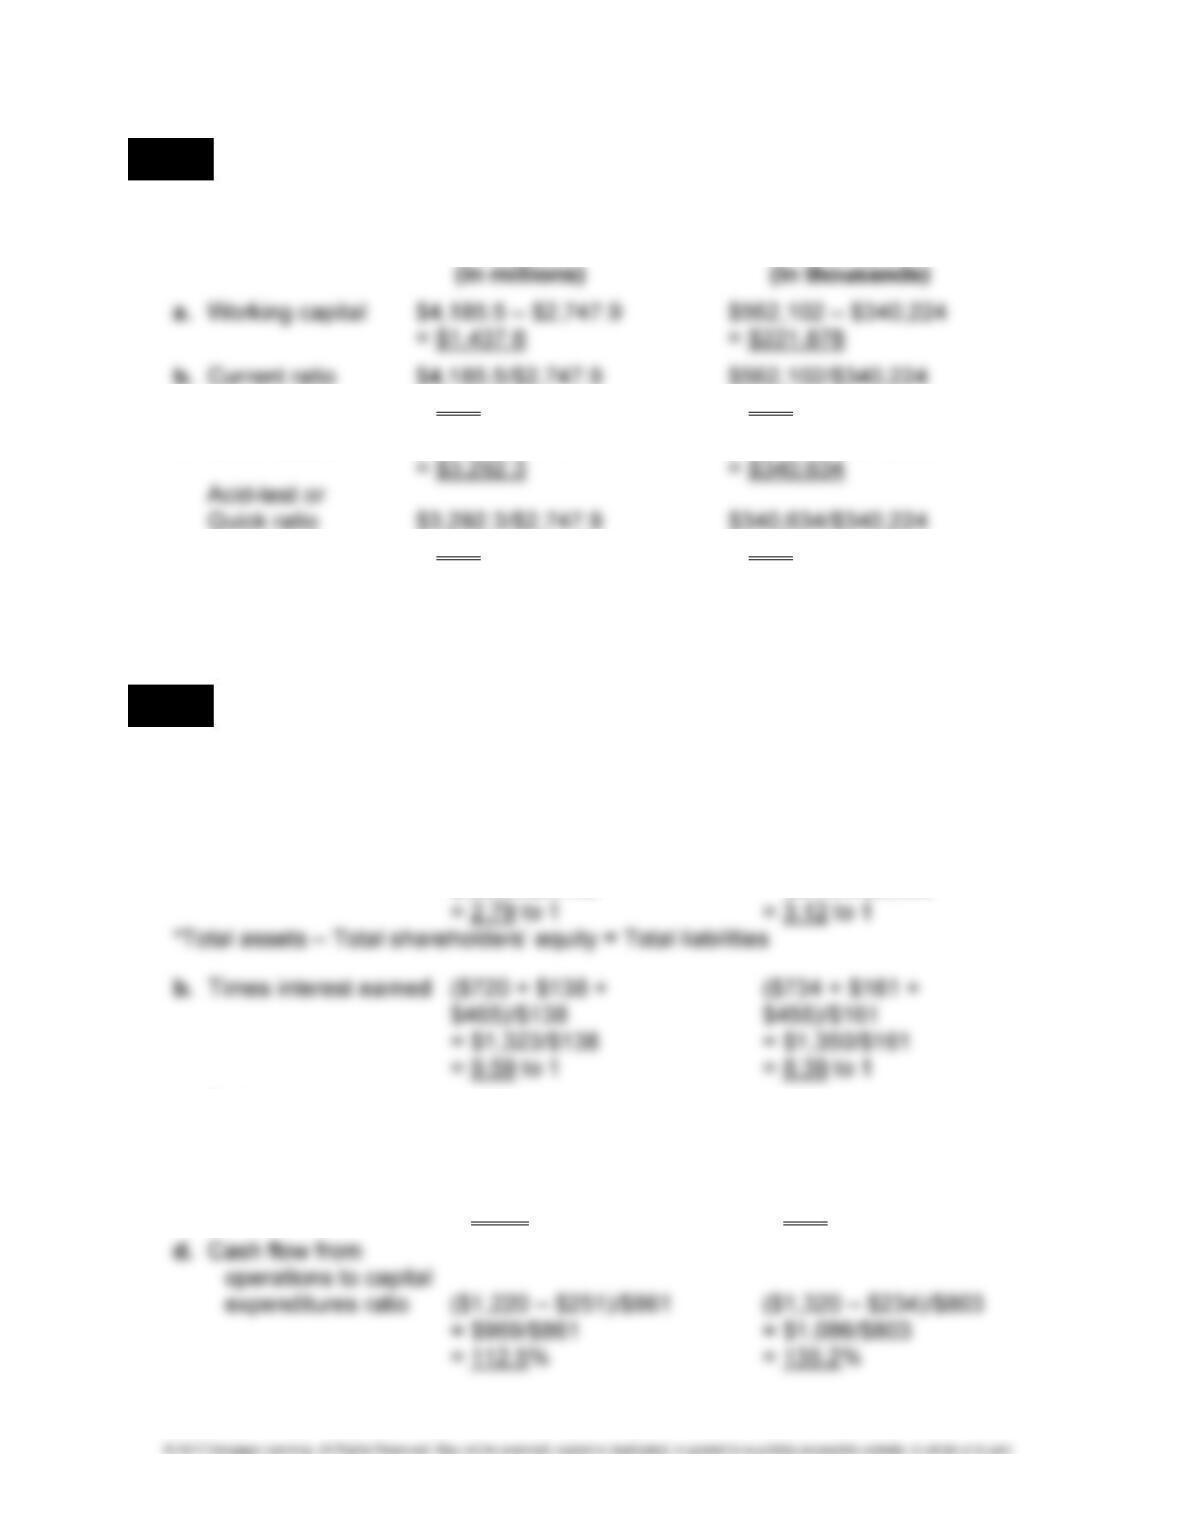
a. Current ratio $3,340/$4,364 = 0.77 to 1 $4,393.5/$5,423.5 = 0.81 to 1
2. Cash flows from operations to current liabilities ratio:
= Net Cash Provided by Operating Activities/Average Current Liabilities
3. The two companies’ ratios are similar; General Mills has a slightly higher current ratio
and quick ratio. The cash flow from operations to current liabilities is also similar for the
two companies. Based on these ratios, the liquidity of the two companies is similar.
CHAPTER 13 • FINANCIAL STATEMENT ANALYSIS 13-7
LO 4 EXERCISE 13-7 LIQUIDITY ANALYSES FOR MCDONALD’S AND WENDY’S
1. Calculations:
McDonald’s Wendy’s
= 1.52 = 1.65
c. Quick assets $2,077.9 + $1,214.4 $267,276 + $73,358
= 1.20 = 1.00
2. Wendy’s current ratio is slightly higher than McDonald’s, but McDonald’s has a
slightly higher quick ratio. Both companies appear to be relatively liquid, with quick
ratios of at least 1.0.
LO 5 EXERCISE 13-8 SOLVENCY ANALYSES FOR NORDSTROM, INC.
1. Calculations (all dollar amounts are in millions):
For the year ended For the year ended
January 31, 2015 February 1, 2014
a. Debt-to-equity ratio ($9,245 – $2,440)*/$2,440 ($8,574 – $2,080)*/$2,080
$6,805/$2,440 $6,494/$2,080
c. Debt service
coverage ratio ($1,220 + $152 + ($1,320 + $170 +
$391)/($152 + $7) $445)/($170 + $407)
= $1,763/$159 = $1,935/$577
= 11.09 times = 3.35 times
13-8 FINANCIAL ACCOUNTING SOLUTIONS MANUAL
EXERCISE 13-8 (Concluded)
2. All four ratios indicate that Nordstrom is highly solvent. The company’s debt-to-
equity ratio decreased during the year, and the debt service coverage ratio in-
creased significantly.
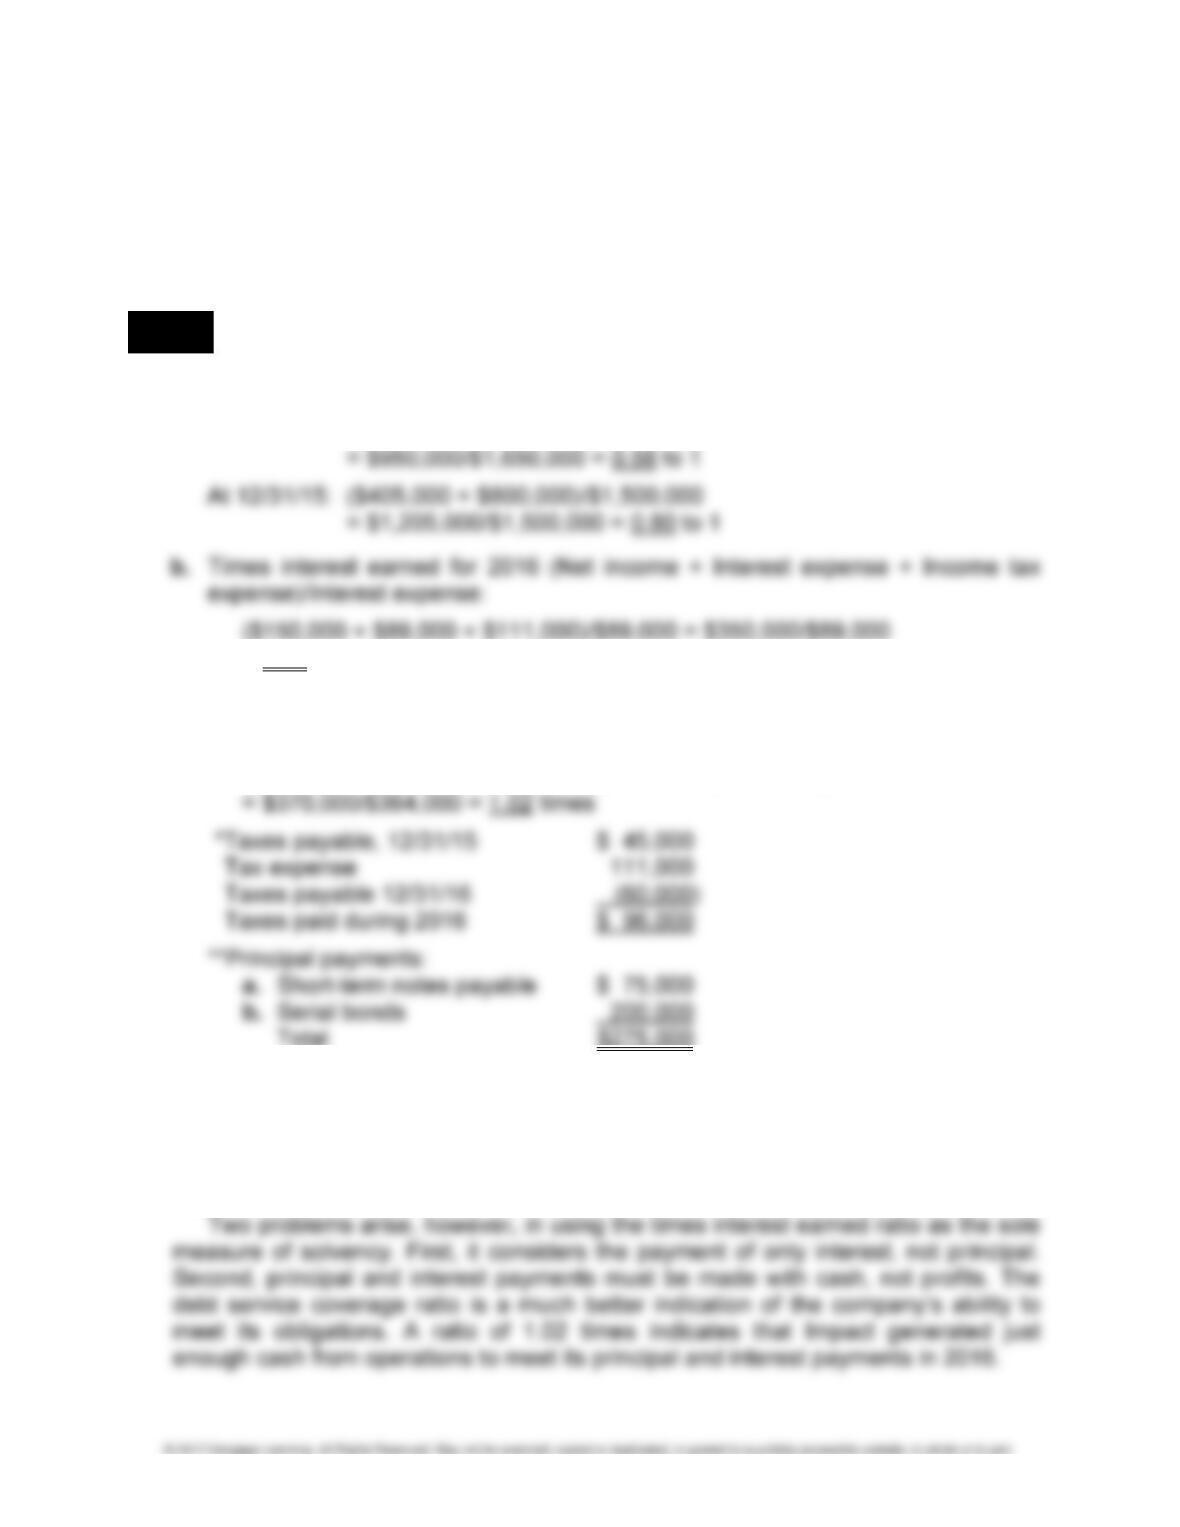
LO 5 EXERCISE 13-9 SOLVENCY ANALYSIS
1. a. Debt-to-equity ratio: Total liabilities/Total stockholders’ equity
At 12/31/16: ($350,000 + $600,000)/$1,650,000
= 3.93 to 1
c. Debt service coverage for 2016 (Cash flows from operations before interest and
tax payments)/Interest and principal payments:
($185,000 + $89,000 + $96,000*)/($89,000 + $275,000**)
2. The company’s debt-to-equity ratio has decreased because of the repayment of the
short-term notes and the installment payment on the serial bonds. The ratio at the
end of 2016 of almost 0.6 to 1 indicates a relatively conservative balance of debt to
stockholders’ equity. The times interest earned ratio indicates that Impact’s profits
before interest and taxes were almost four times the amount of interest expense.
CHAPTER 13 • FINANCIAL STATEMENT ANALYSIS 13-9
LO 5 EXERCISE 13-10 WORKING BACKWARD: DEBT SERVICE COVERAGE
Madison’s cash flow from operations can be determined by solving for X in the debt ser-
vice coverage ratio formula:
LO 6 EXERCISE 13-11 PROFITABILITY ANALYSIS FOR APPLE, INC.
1. Apple’s return on common stockholders’ equity ratio (amounts in millions):
2. Return on assets is a ratio needed to decide if Apple is successfully employing lev-
LO 6 EXERCISE 13-12 WORKING BACKWARD: PROFITABILITY ANALYSIS
1. Murphy’s profit margin was 5%, and net income was $250,000. Therefore, net sales
were $250,000/0.05 = $5,000,000.
13-10 FINANCIAL ACCOUNTING SOLUTIONS MANUAL
LO 6 EXERCISE 13-13 RETURN ON STOCKHOLDERS’ EQUITY
Rogers’ stockholders’ equity at the end of 2015 was ($2 × 500,000) + $1,800,000 =
LO 6 EXERCISE 13-14 RETURN RATIOS AND LEVERAGE
1. Ratios:
a. Return on Sales = (Net Income + Interest Expense, Net of Tax)/Net Sales
= [$60,000 + ($50,000 × 60%)]/$650,000
= $90,000/$650,000 = 13.85%
c. Return on Assets = (Net Income + Interest Expense, Net of Tax)/Average Total
Assets
= $90,000 [from part (a)]/$1,800,000 [from part (b)] = 5%
CHAPTER 13 • FINANCIAL STATEMENT ANALYSIS 13-11
EXERCISE 13-14 (Concluded)
2. Evergreen has not been successful in using outside funds because the return on
stockholders’ equity of 3.75% is less than the return to all providers of capital, as
measured by the return on assets of 5%.
LO 6 EXERCISE 13-15 RELATIONSHIPS AMONG RETURN ON ASSETS, RETURN ON
SALES, AND ASSET TURNOVER
Case 1. Return on Assets = Net Income (assuming no interest expense)/Average
Total Assets = $10,000/$60,000 = 16.67%
Case 4. Asset Turnover = Net Sales/Average Total Assets
1.25 = $50,000/X
Average Total Assets = $40,000
Return on Assets = Net Income (assuming no interest expense)/Average
Total Assets
13-12 FINANCIAL ACCOUNTING SOLUTIONS MANUAL
LO 6 EXERCISE 13-16 EPS, P/E RATIO, AND DIVIDEND RATIOS
1. Ratios:
a. Earnings per Common Share = (Net Income – Preferred Dividends)/Number of
Common Shares Outstanding
= [$1,300,000 – 8%($5,000,000)]/400,000 shares
2. An investment advisor needs to be aware of industry trends, the general economic
environment, the historical performance of the company, the investor’s attitudes
about risk, and any other relevant data needed to make an informed decision.
CHAPTER 13 • FINANCIAL STATEMENT ANALYSIS 13-13
MULTI-CONCEPT EXERCISES
LO 2,3 EXERCISE 13-17 COMMON-SIZE BALANCE SHEETS AND HORIZONTAL
ANALYSIS
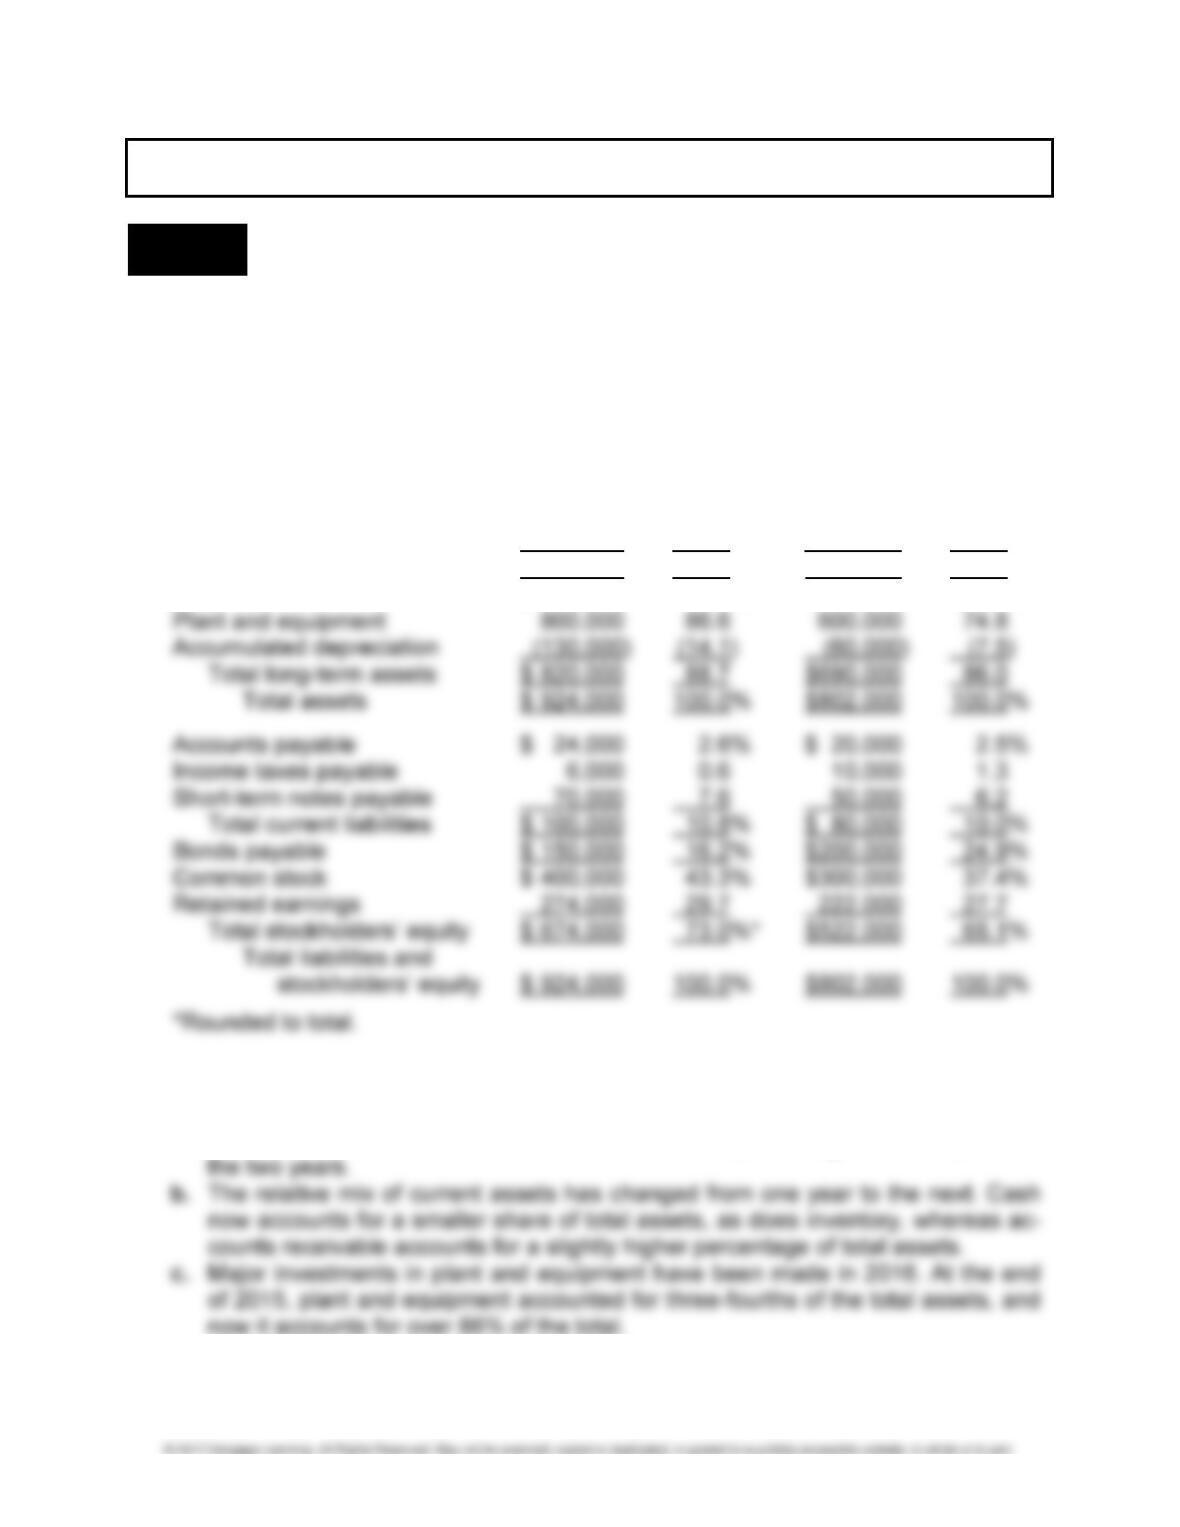
1. FARINET COMPANY
COMMON-SIZE COMPARATIVE BALANCE SHEETS
DECEMBER 31, 2016 AND 2015
12/31/16 12/31/15
Dollars Percent Dollars Percent
Cash $ 16,000 1.7%* $ 20,000 2.5%*
Accounts receivable 40,000 4.3 30,000 3.8
Inventory 30,000 3.3 50,000 6.2
Prepaid rent 18,000 2.0 12,000 1.5
Total current assets $ 104,000 11.3% $112,000 14.0%
Land $ 150,000 16.2% $150,000 18.7%
2. Observations from Farinet’s common-size balance sheets:
a. Current assets as a percentage of total assets has decreased. At the same time,
current liabilities has accounted for about the same percentage of total equities in
13-14 FINANCIAL ACCOUNTING SOLUTIONS MANUAL
EXERCISE 13-17 (Concluded)
d. Bonds payable now make up a smaller share of the capital structure with the re-
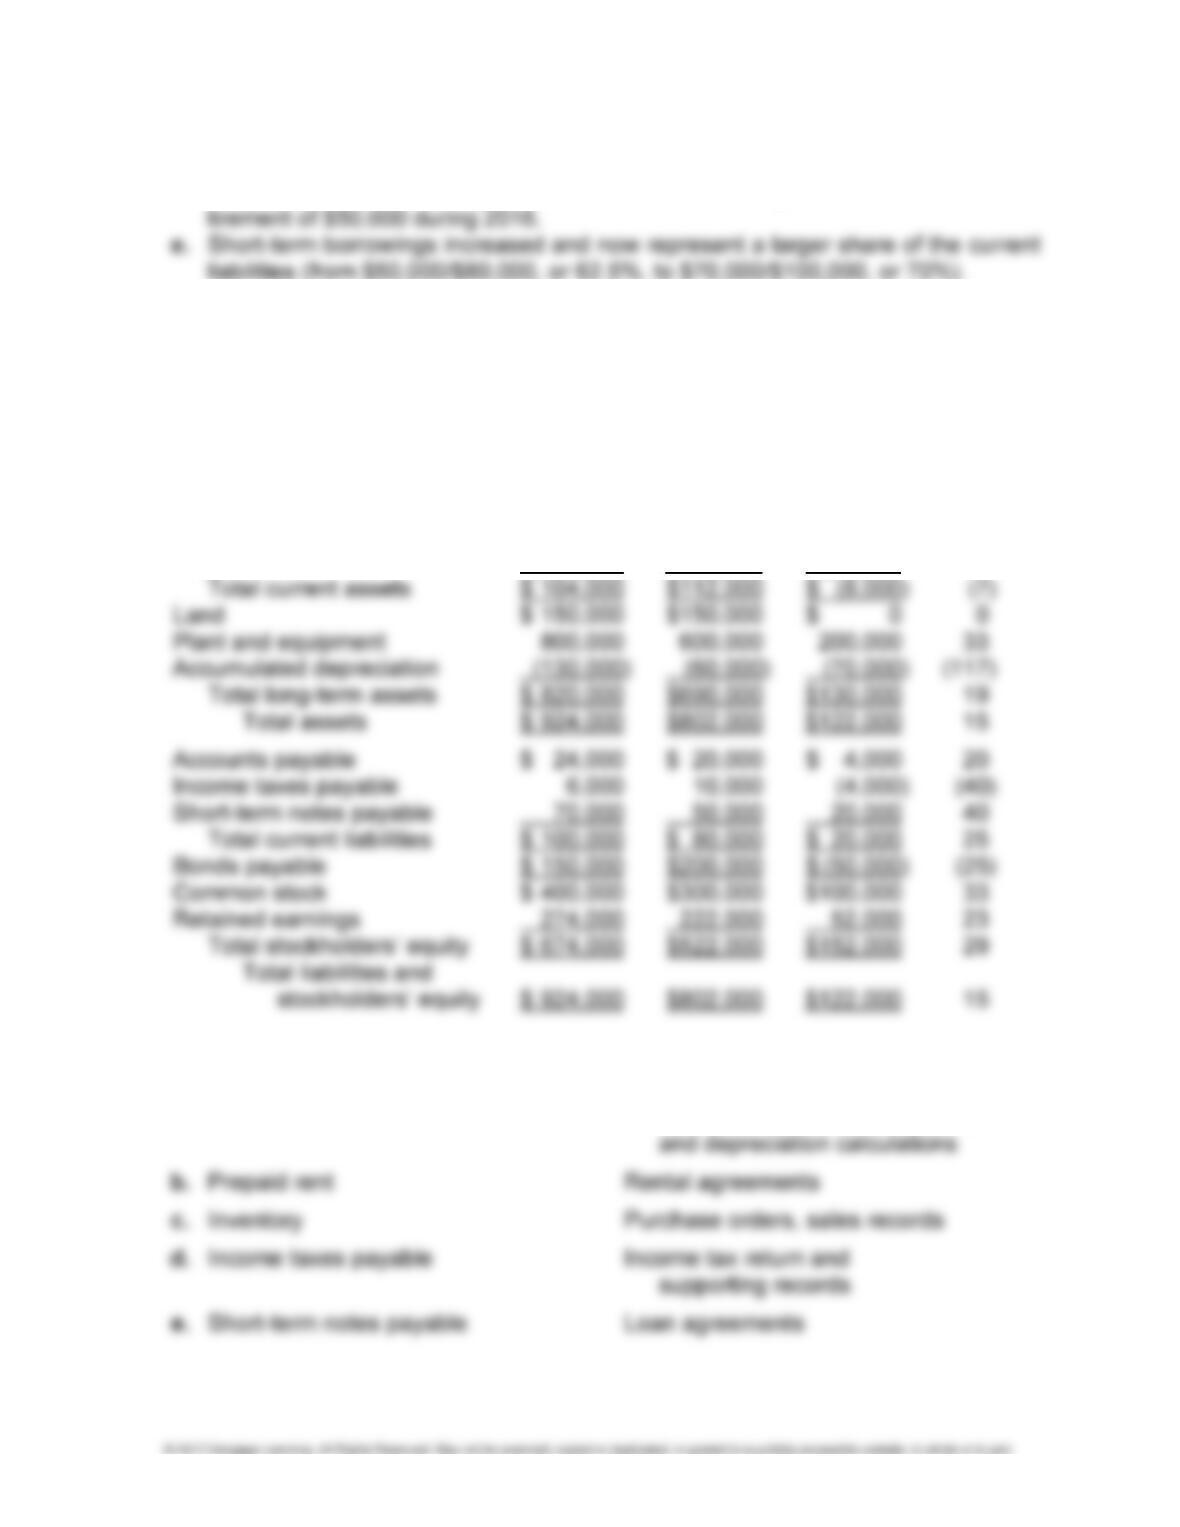
3. FARINET COMPANY
COMPARATIVE BALANCE SHEETS
DECEMBER 31, 2016 AND 2015
December 31 Increase (Decrease)
2016 2015 Dollars Percent
Cash $ 16,000 $ 20,000 $ (4,000) (20)%
Accounts receivable 40,000 30,000 10,000 33
Inventory 30,000 50,000 (20,000) (40)
Prepaid rent 18,000 12,000 6,000 50
4. Largest changes Refer to
a. Accumulated depreciation Fixed asset records, showing
additions to plant and equipment
CHAPTER 13 • FINANCIAL STATEMENT ANALYSIS 13-15
LO 2,3 EXERCISE 13-18 COMMON-SIZE INCOME STATEMENTS AND HORIZONTAL
ANALYSIS
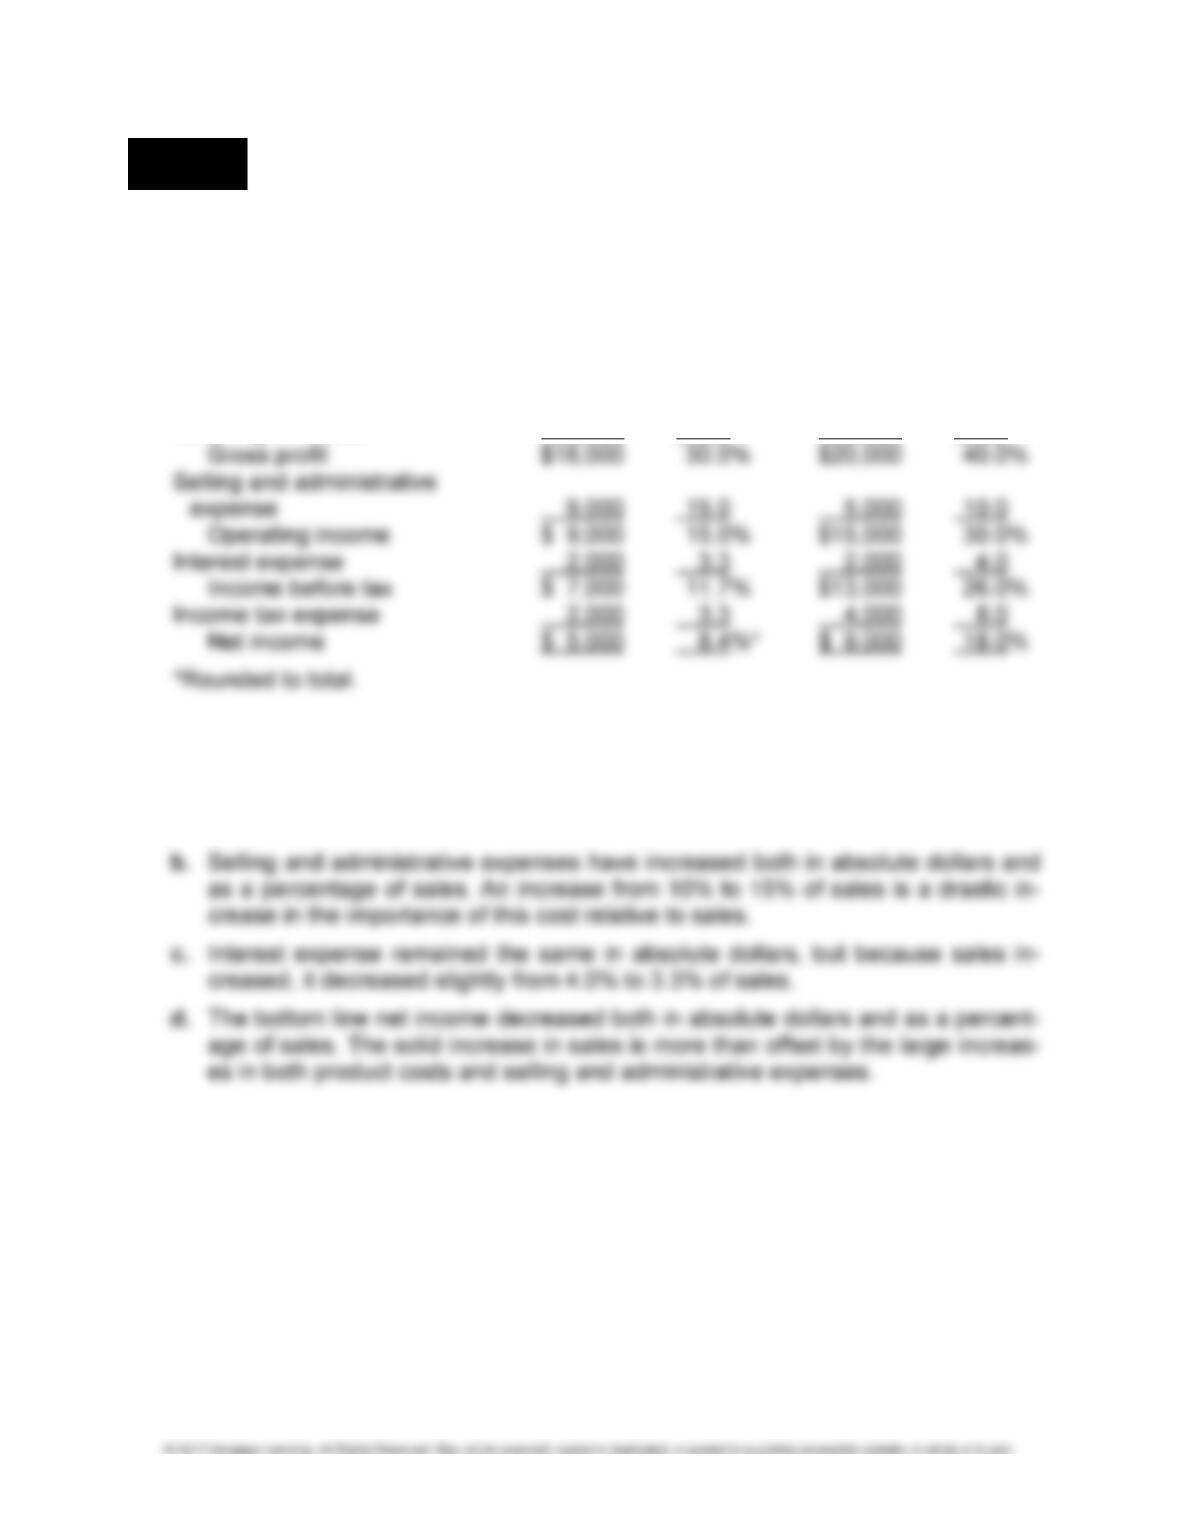
1. MARINERS CORP.
COMMON-SIZE COMPARATIVE INCOME STATEMENTS
FOR THE YEARS ENDED DECEMBER 31, 2016 AND 2015
(IN THOUSANDS OF DOLLARS)
2016 2015
Dollars Percent Dollars Percent
Sales revenue $60,000 100.0% $50,000 100.0%
Cost of goods sold 42,000 70.0 30,000 60.0
2. Observations from Mariners’ common-size statements:
a. Although sales increased in absolute dollars, the gross profit percentage has de-
creased significantly because of a higher ratio of cost of goods sold to sales:
from 60% to 70%.
EXERCISE 13-18 (Concluded)
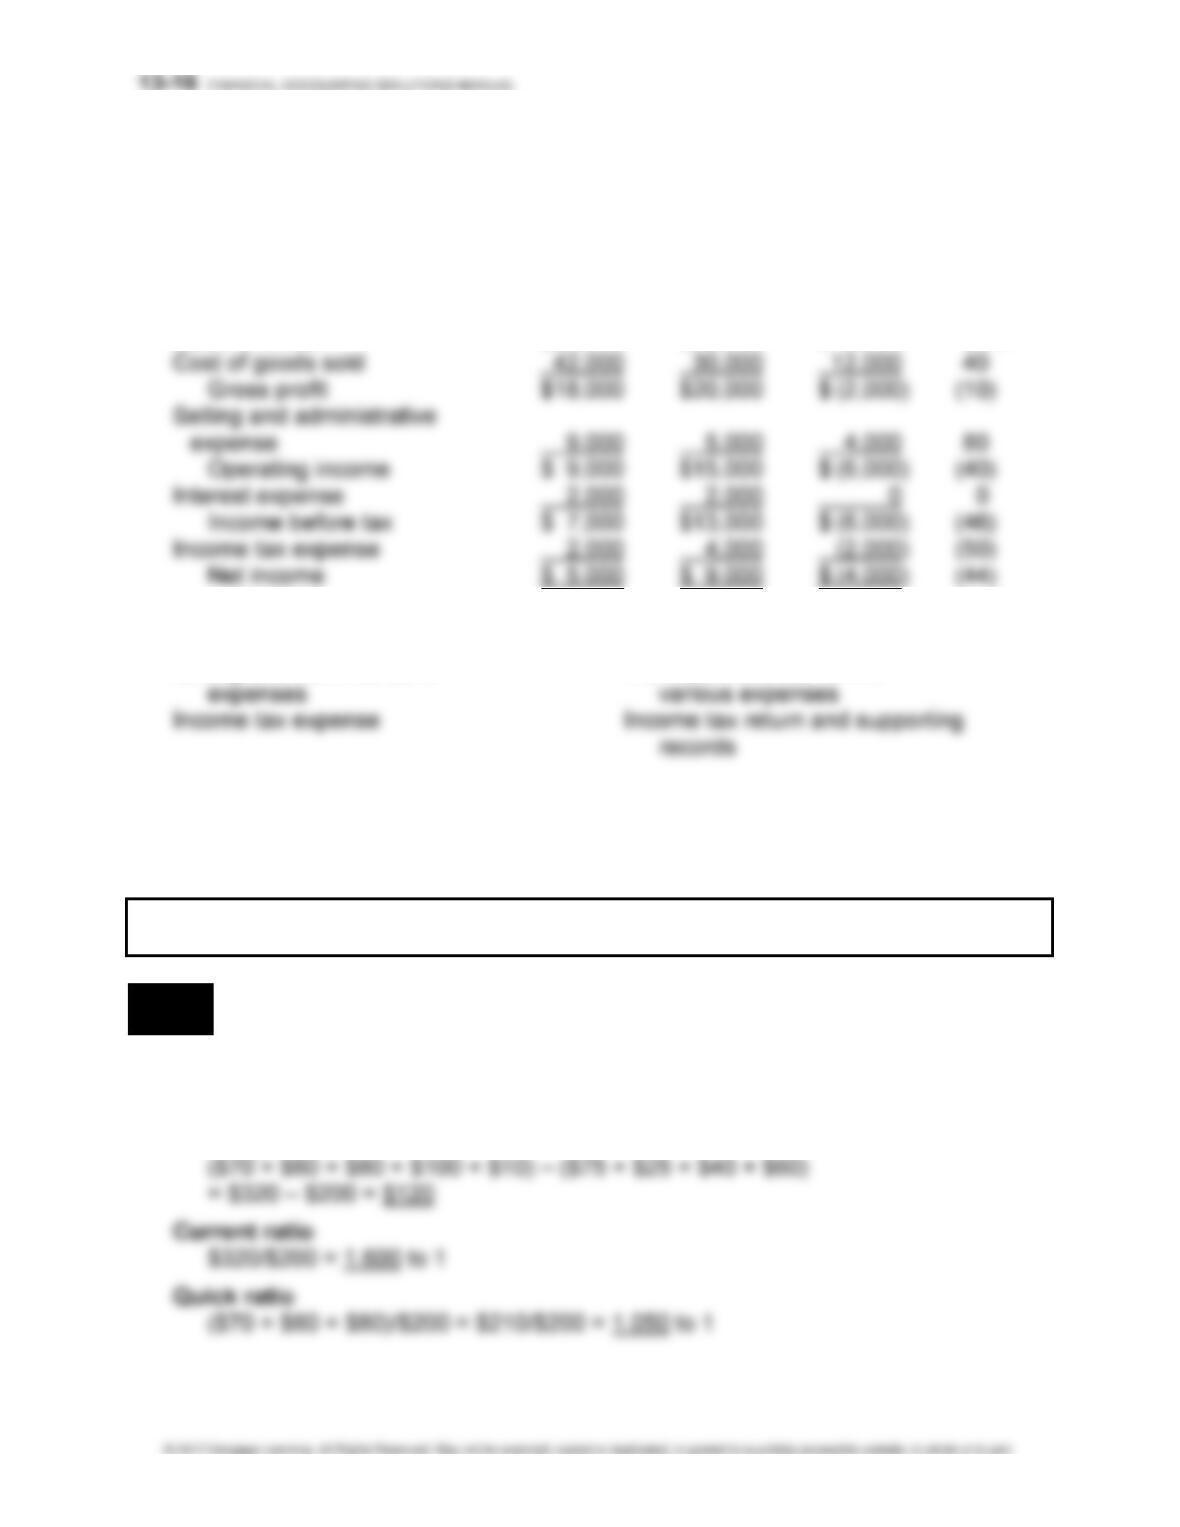
3. MARINERS CORP.
COMPARATIVE STATEMENTS OF INCOME
FOR THE YEARS ENDED DECEMBER 31, 2016 AND 2015
Increase (Decrease)
2016 2015 Dollars Percent
Sales revenue $60,000 $50,000 $10,000 20%
4. Largest changes Refer to
Selling and administrative Individual records, for the
PROBLEMS
LO 4 PROBLEM 13-1 EFFECT OF TRANSACTIONS ON WORKING CAPITAL, CURRENT
RATIO, AND QUICK RATIO
1. Calculation of working capital, current ratio, and quick ratio (dollar amounts in
thousands):
Working capital
CHAPTER 13 • FINANCIAL STATEMENT ANALYSIS 13-17
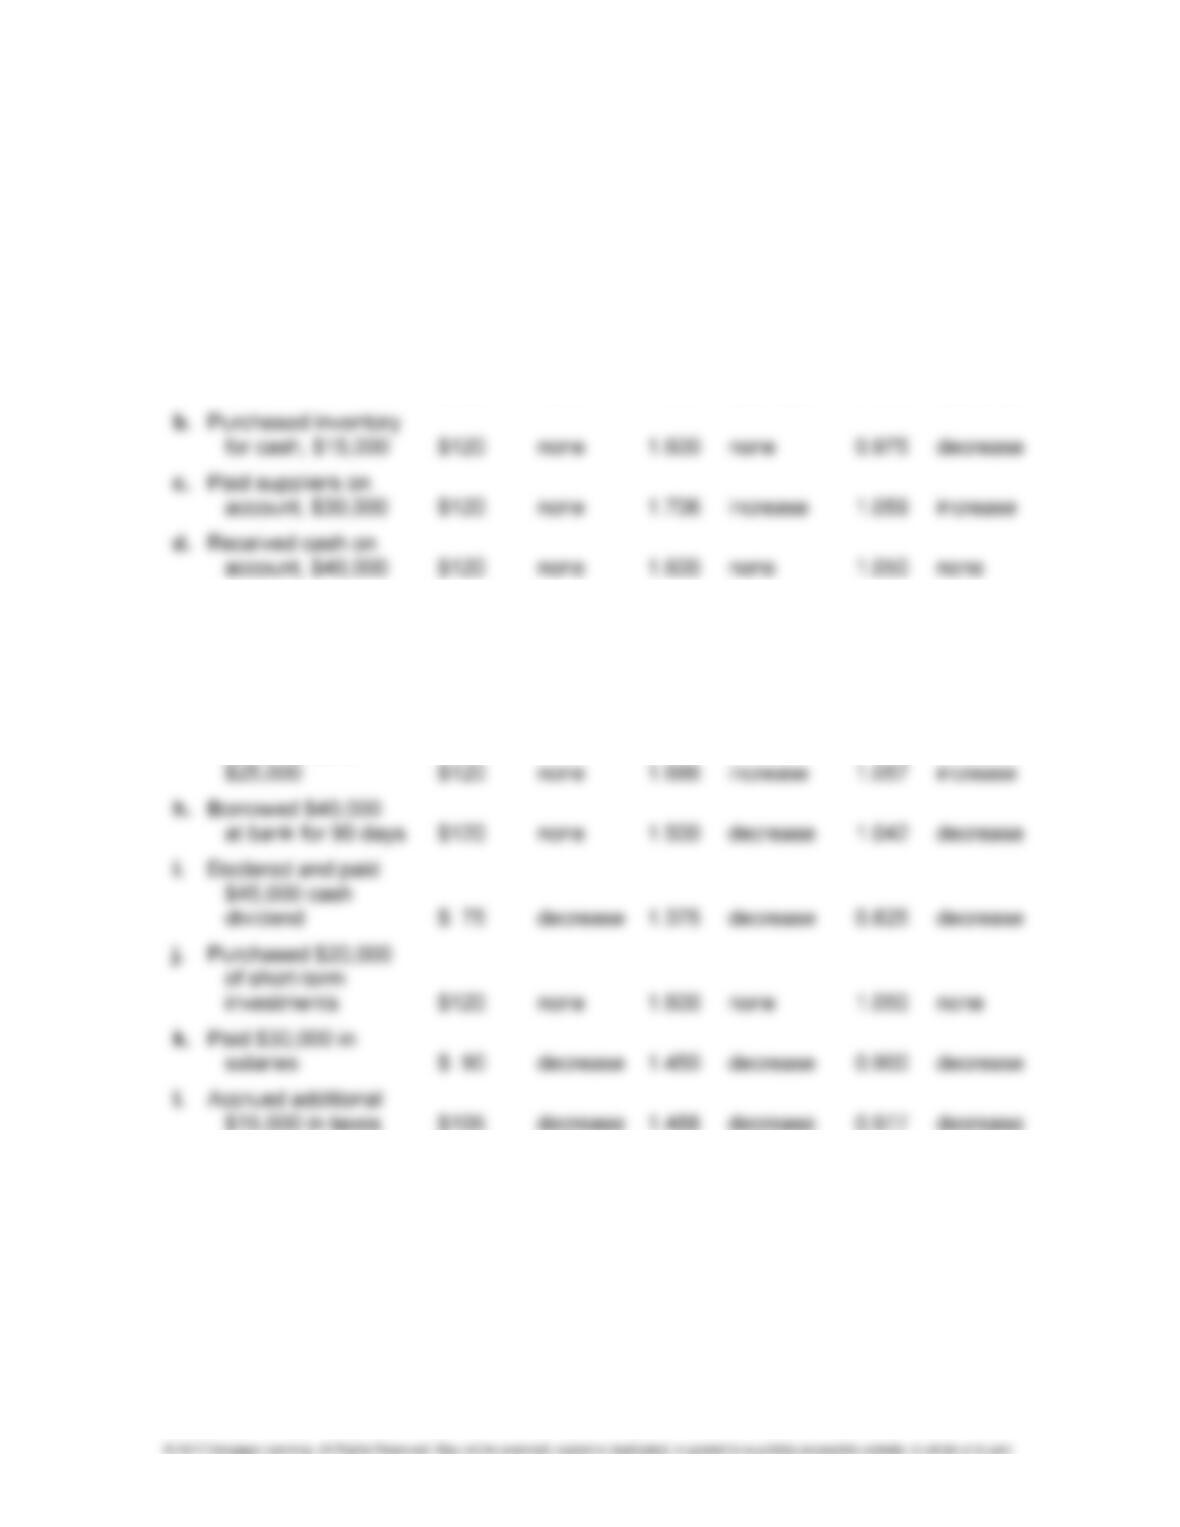
PROBLEM 13-1 (Concluded)
2. Effect of transactions on working capital, current ratio, and quick ratio:
Working Effect Effect Effect
Capital of of of
(in Thou- Trans- Current Trans- Quick Trans-
Transaction sands) action Ratio action Ratio action
a. Purchased inventory
on account,
$20,000 $120 none 1.545 decrease 0.955 decrease
e. Paid insurance for
next year, $20,000 $120 none 1.600 none 0.950 decrease
f. Made sales on
account, $60,000 $180 increase 1.900 increase 1.350 increase
g. Repaid short-term
loans at bank,
13-18 FINANCIAL ACCOUNTING SOLUTIONS MANUAL
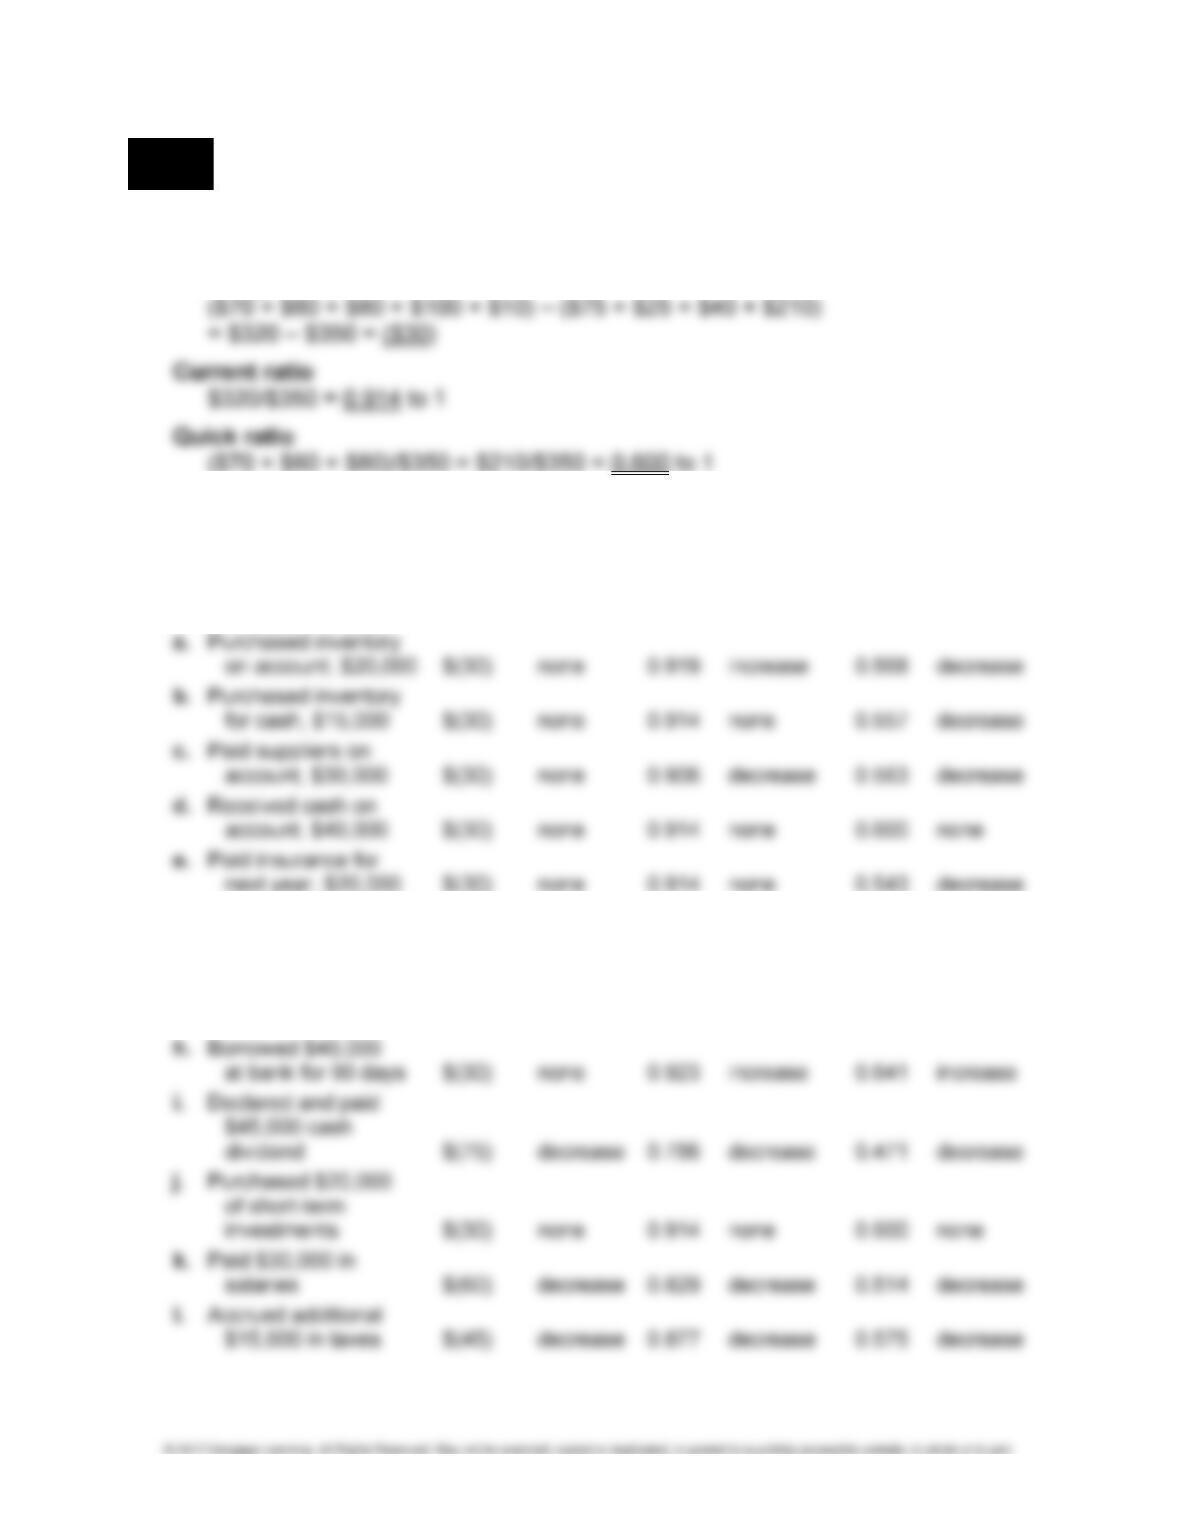
LO 4 PROBLEM 13-2 EFFECT OF TRANSACTIONS ON WORKING CAPITAL, CURRENT
RATIO, AND QUICK RATIO
1. Calculation of working capital, current ratio and quick ratio (dollar amounts in
thousands):
Working capital
2. Effect of transactions on working capital, current ratio, and quick ratio:
Working Effect Effect Effect
Capital of of of
(in Thou- Trans- Current Trans- Quick Trans-
Transaction sands) action Ratio action Ratio action
f. Made sales on
account, $60,000 $ 30 increase 1.086 increase 0.771 increase
g. Repaid short-term
loans at bank,
$25,000 $(30) none 0.908 decrease 0.569 decrease
CHAPTER 13 • FINANCIAL STATEMENT ANALYSIS 13-19
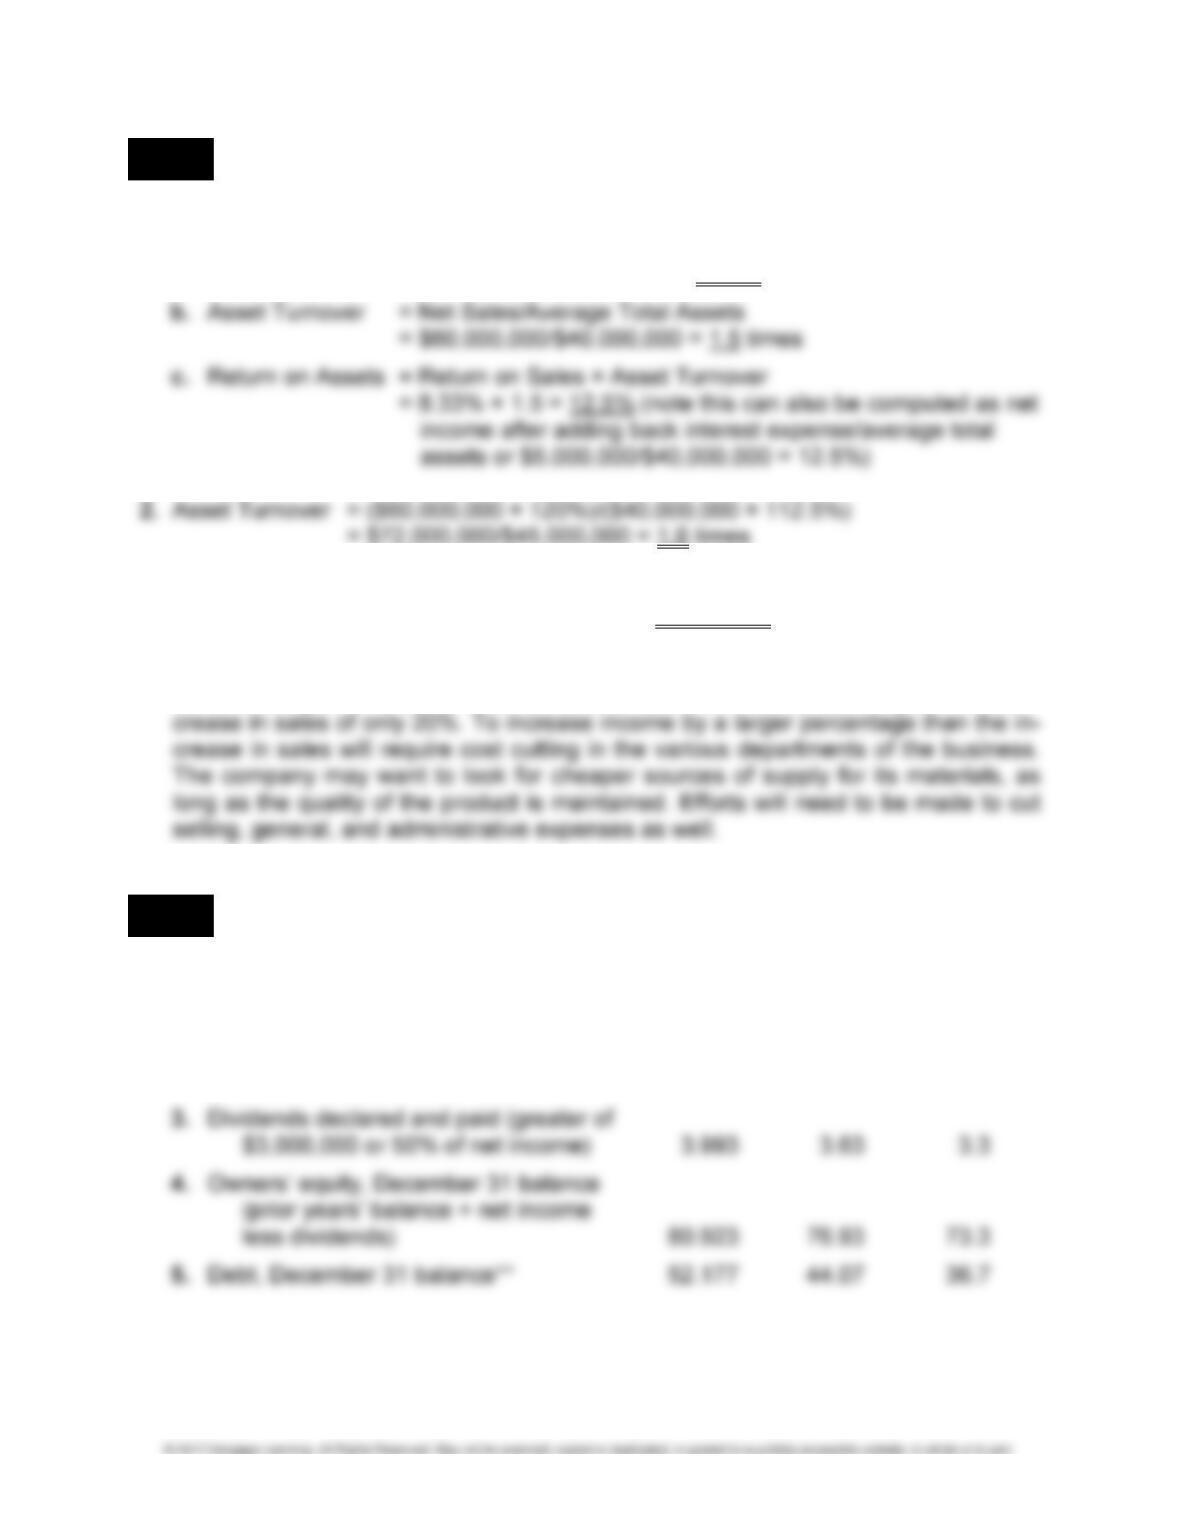
LO 6 PROBLEM 13-3 GOALS FOR SALES AND RETURN ON ASSETS
1. a. Return on Sales = Net Income (after adding back interest expense, net of tax)
/Net Sales
= $5,000,000/$60,000,000 = 8.33%
3. If average total assets are $45,000,000 and the goal is a 15% return on assets, net
income will need to be 15% of $45,000,000, or $6,750,000.
4. Income will have to increase by 35%, ($6,750,000 – $5,000,000)/$5,000,000, to
achieve the goal of a 15% return on assets. The president has set a goal for an in-
LO 6 PROBLEM 13-4 GOALS FOR SALES AND INCOME GROWTH
1. Selected financial data (in millions of dollars):
2019 2018 2017
1. Sales* 266.200 242.00 220.0
2. Net income (sales × 3%)* 7.986 7.26 6.6
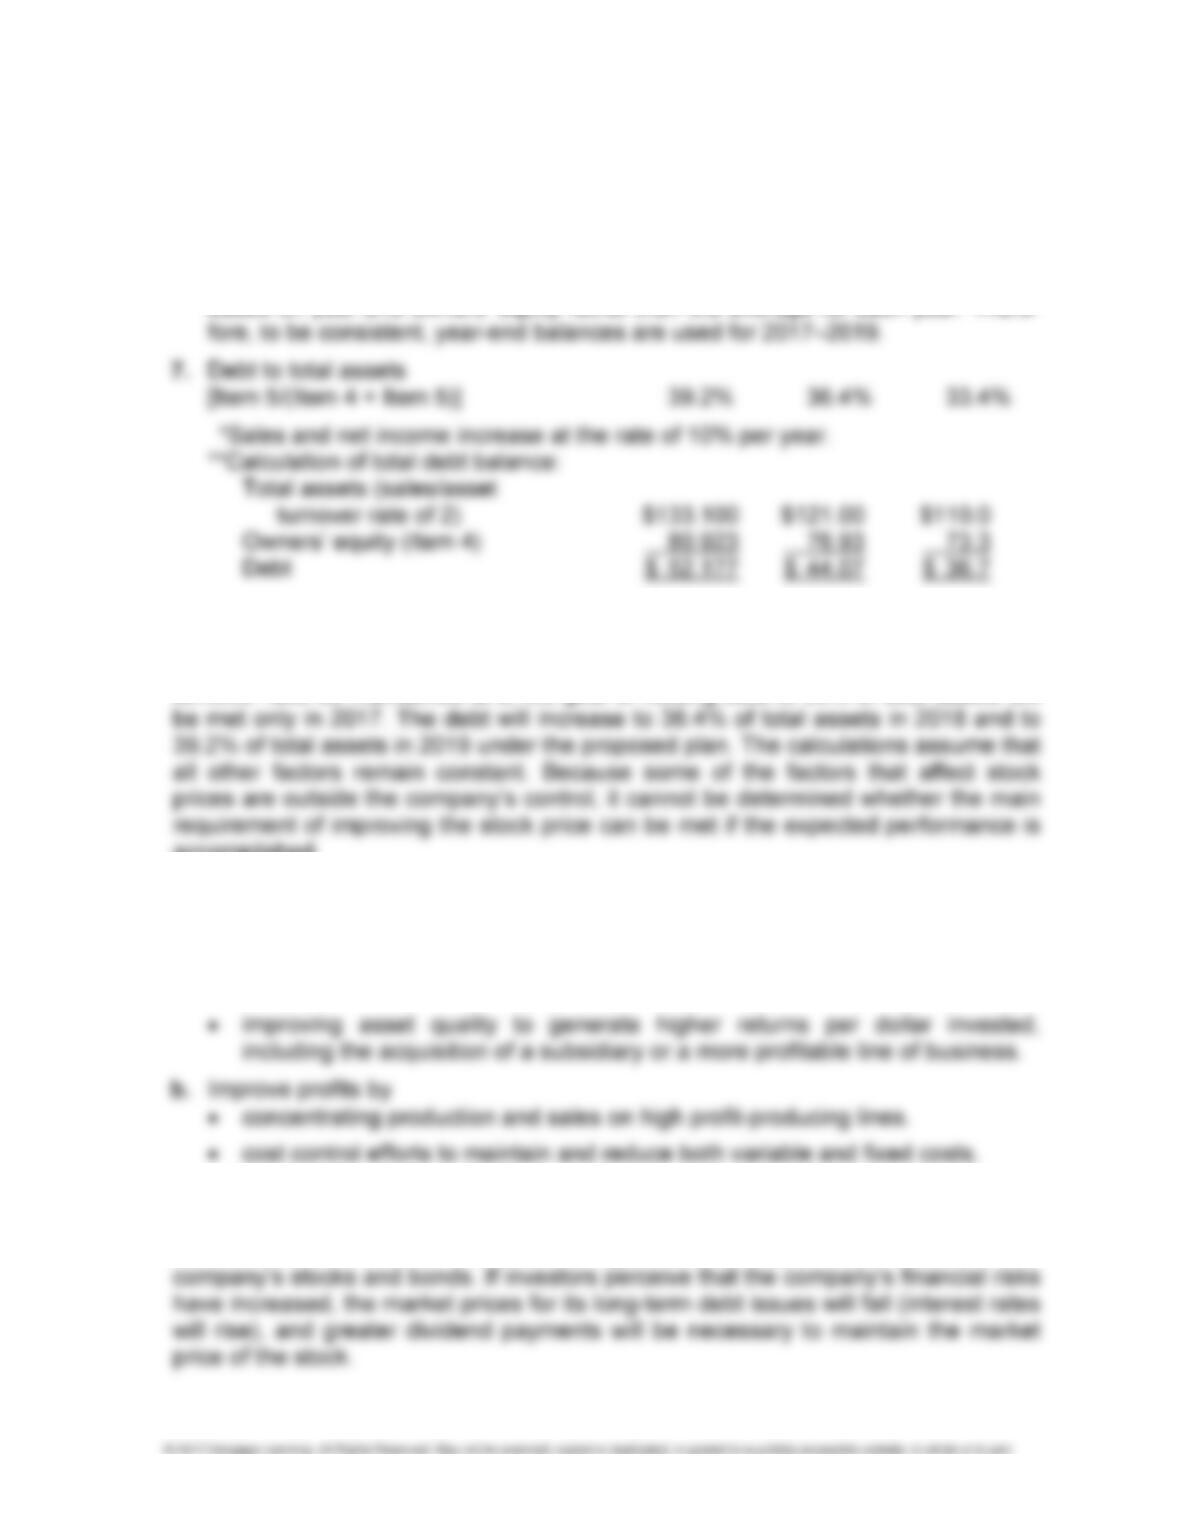
13-20 FINANCIAL ACCOUNTING SOLUTIONS MANUAL
PROBLEM 13-4 (Concluded)
Selected ratios:
2019 2018 2017
6. Return on owners’ equity (Item 2/Item 4) 9.9% 9.4% 9.0%
Note: The return on owners’ equity ratios in the problem for 2014–2016 are
based on year-end owners’ equity rather than the average for each year. There-
2. No, the CEO will not be able to meet all her requirements if a 10% per-year growth
in income and sales is achieved. Under the stated assumptions that the net income
to sales ratio be maintained at 3% with annual sales growth of 10%, and the asset
turnover ratio be maintained at 2, the goal of holding debt to 35% of total assets will
accomplished.
3. Alternative actions to be considered to improve the return on equity and support the
increased dividend payments:
a. Improve the return on assets by
• reducing the asset base through better asset management.
4. The CEO is probably concerned with the potential impact that greater debt would
have on the company’s cost of capital. Increasing debt relative to owners’ equity
creates added risk, which translates to higher returns required by investors in the