CHAPTER 13 • FINANCIAL STATEMENT ANALYSIS 13-35
DECISION CASES
READING AND INTERPRETING FINANCIAL STATEMENTS
LO 2 DECISION CASE 13-1 HORIZONTAL ANALYSIS FOR CHIPOTLE
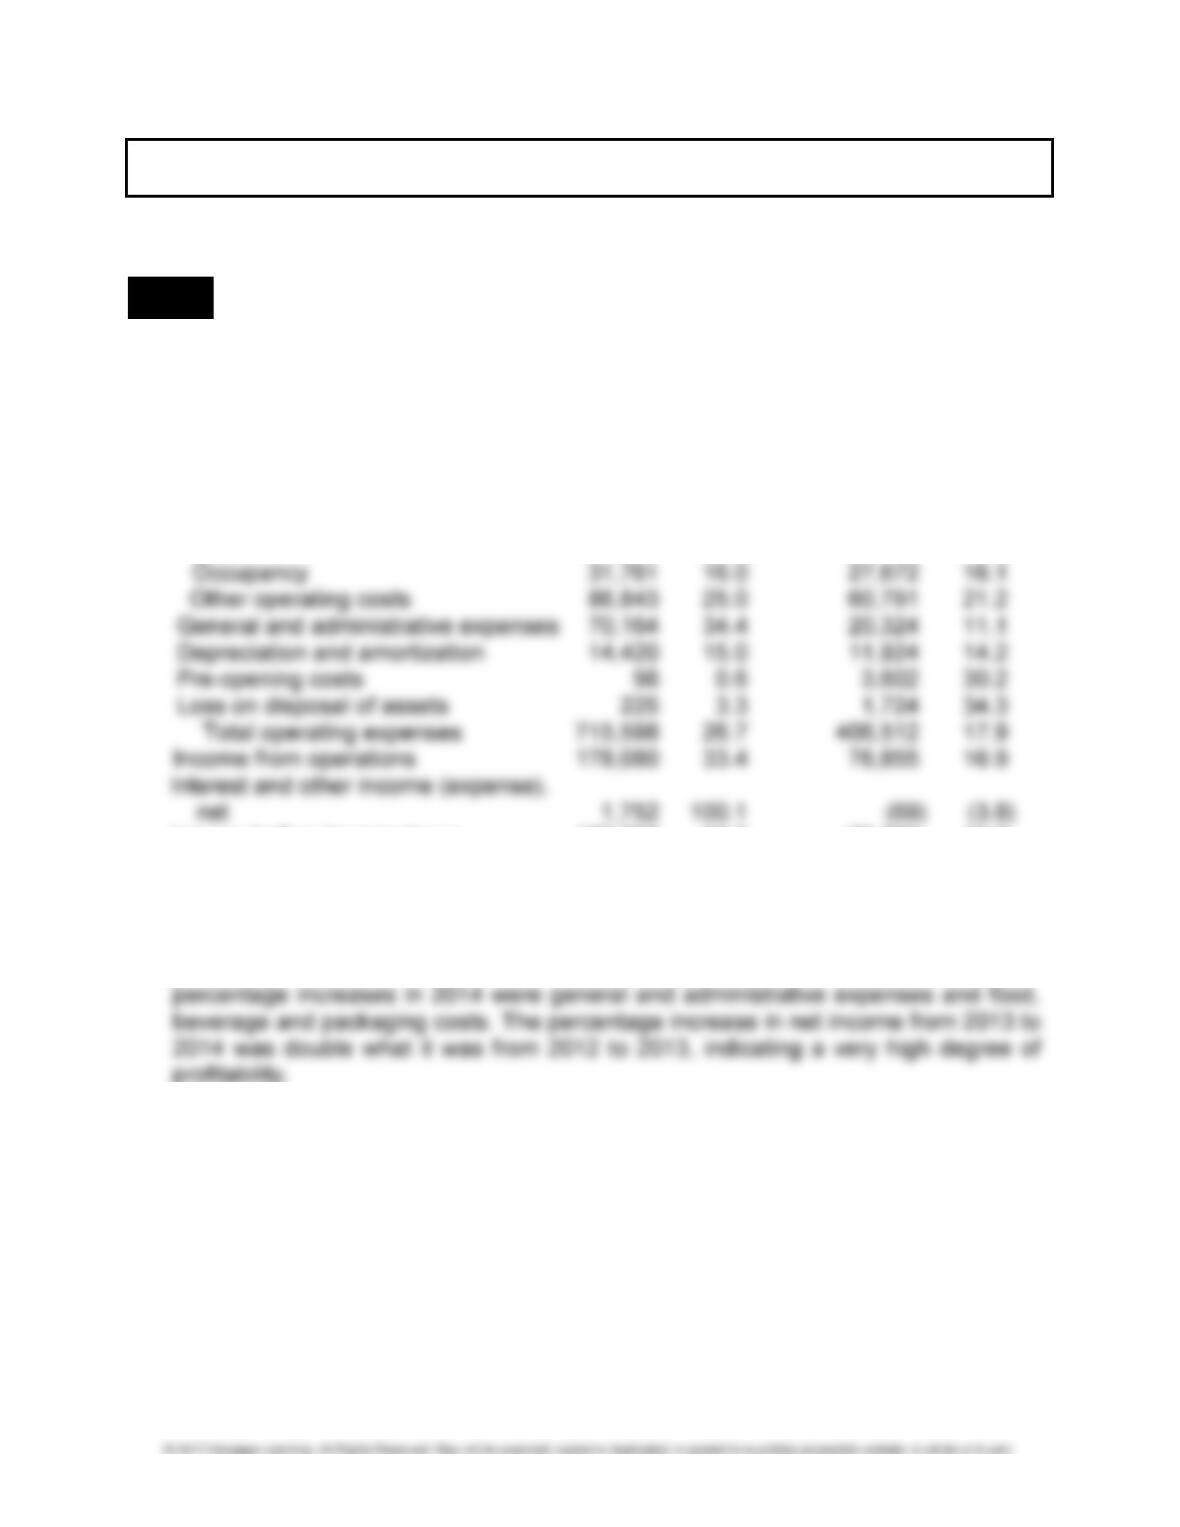
1. and 2. (In thousands of dollars)
Increase (Decrease) from
2013 to 2014 2012 to 2013
Income Statement Accounts Dollars Percent Dollars Percent
Revenue $893,678 27.8% $483,367 17.7%
Restaurant operating costs:
Food, beverage and packaging 347,480 32.4 182,511 20.5
Labor 164,607 22.3 97,964 15.3
Income before income taxes 179,832 33.6 76,786 16.8
Provision for income taxes 61,896 29.9 27,348 15.2
Net income 117,936 36.0 49,438 17.8
3. Revenue increased significantly in each of the last two years and by a much higher
percentage in the most recent year. The two operating expenses with the largest
13-36 FINANCIAL ACCOUNTING SOLUTIONS MANUAL
LO 3 DECISION CASE 13-2 VERTICAL ANALYSIS FOR CHIPOTLE
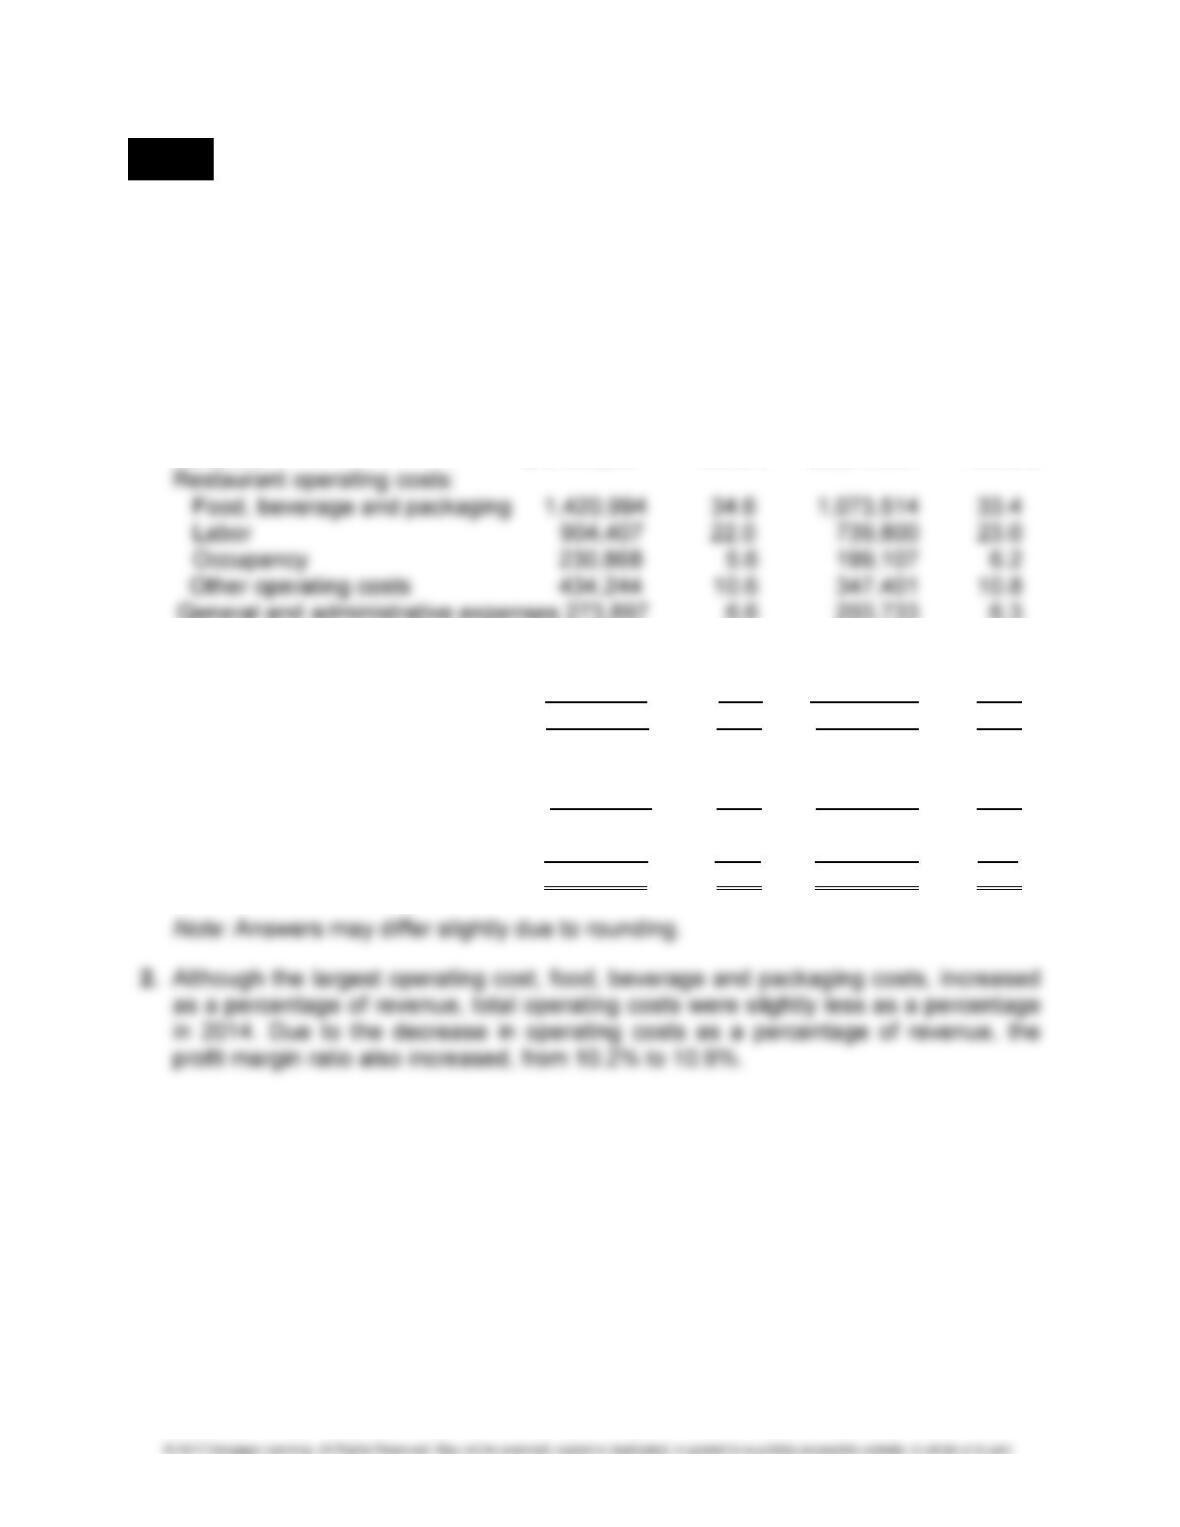
1. Common-size comparative income statements:
CHIPOTLE MEXICAN GRILL, INC.
COMMON-SIZE CONSOLIDATED STATEMENTS OF INCOME
FOR THE YEARS ENDED DECEMBER 31, 2014 AND DECEMBER 31, 2013
(IN THOUSANDS OF DOLLARS)
2014 2013
Dollars Percent Dollars Percent
Revenue $4,108,269 100.0% $3,214,591 100.0%
General and administrative expenses 273,897 6.6 203,733 6.3
Depreciation and amortization 110,474 2.7 96,054 3.0
Pre-opening costs 15,609 0.4 15,511 0.5
Loss on disposal of assets 6,976 0.2 6,751 0.2
Total operating expenses 3,397,469 82.7 2,681,871 83.4
Income from operations 710,800 17.3 532,720 16.6
Interest and other income
(expense), net 3,503 0.1 1,751 0.0
Income before income taxes 714,303 17.4 534,471 16.6
Provision for income taxes (268,929) (6.5) (207,033) (6.4)
Net income 445,374 10.9 327,438 10.2
CHAPTER 13 • FINANCIAL STATEMENT ANALYSIS 13-37
DECISION CASE 13-2 (Continued)
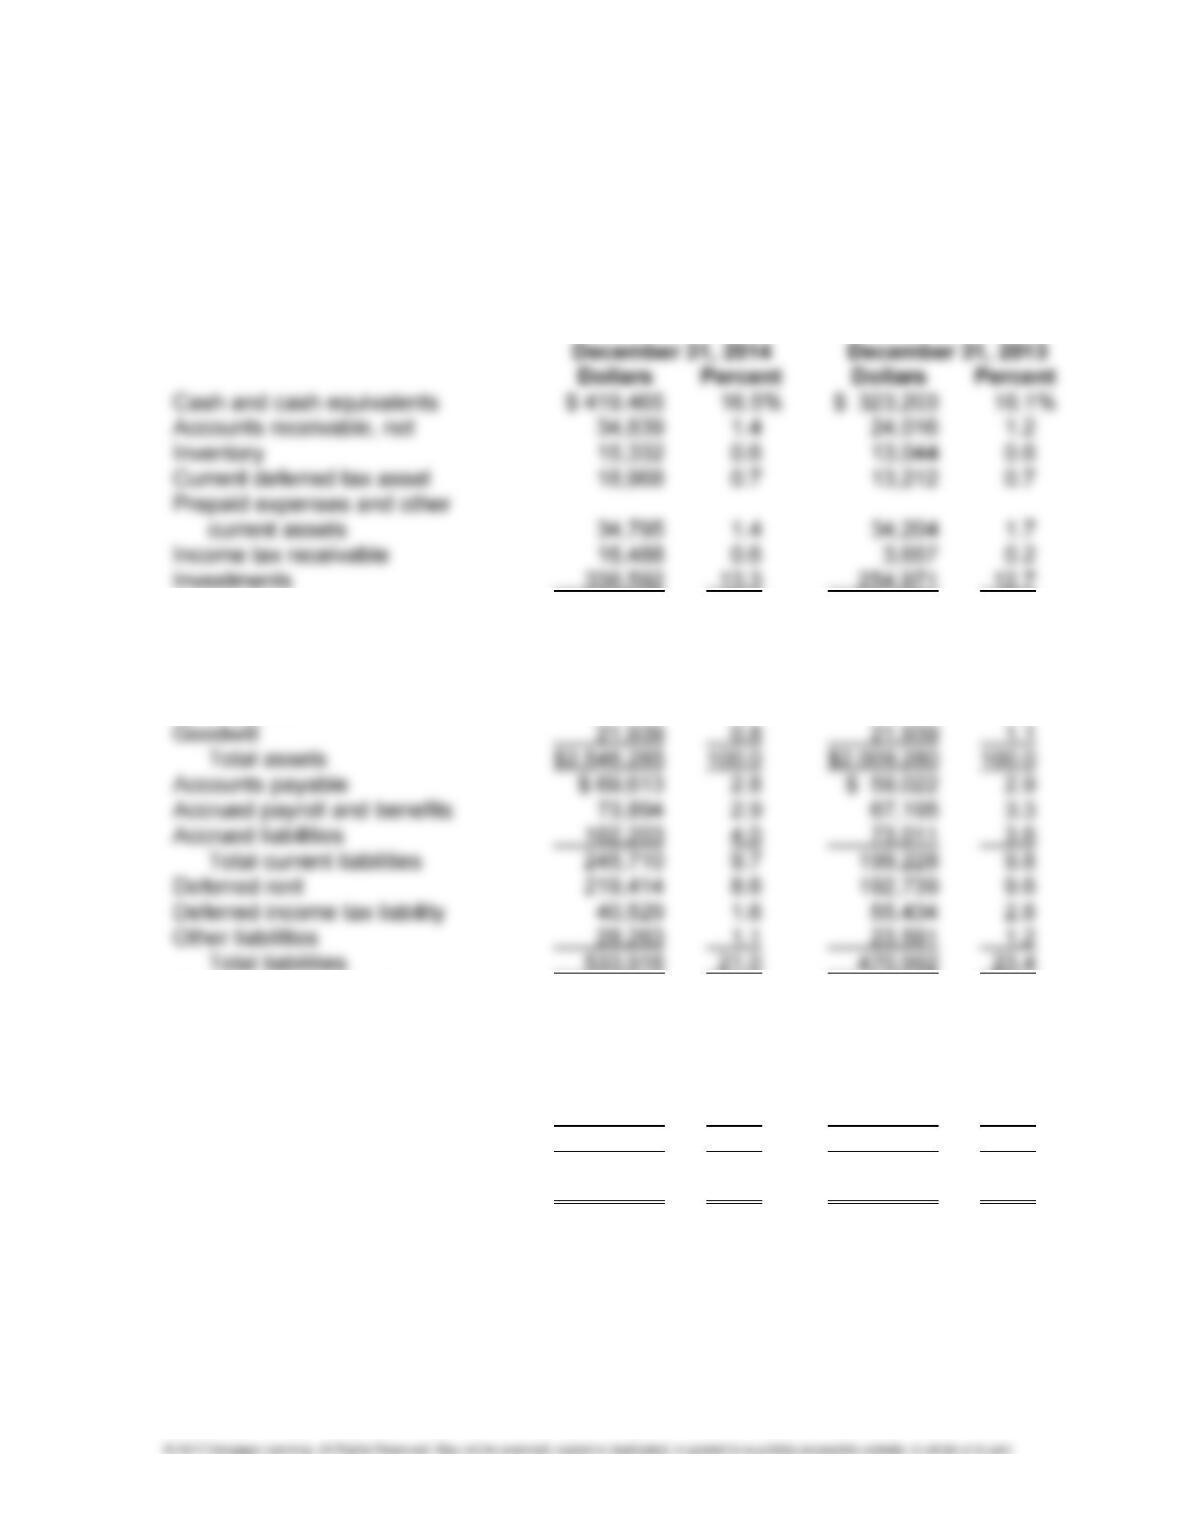
3. Common-size comparative balance sheets:
CHIPOTLE MEXICAN GRILL, INC.
COMMON-SIZE CONSOLIDATED BALANCE SHEETS
AT DECEMBER 31, 2014 AND DECEMBER 31, 2013
(IN THOUSANDS OF DOLLARS)
Total current assets 878,479 34.5 666,307 33.2
Leasehold improvements, property
and equipment, net 1,106,984 43.5 963,238 47.9
Long term investments 496,106 19.5 313,863 15.6
Other assets 42,777 1.7 43,933 2.2
Common stock, $0.01 par value 354 0.0 352 0.0
Additional paid-in capital 1,038,932 40.8 919,840 45.8
Treasury stock (748,759) (29.4) (660,421) (32.8)
Accumulated other comprehensive
income (429) (0.0) 1,620 0.0
Retained earnings 1,722,271 67.6 1,276,897 63.6
Total shareholders’ equity 2,012,369 79.0 1,538,288 76.6
Total liabilities and shareholders’
equity $2,546,285 100.0 $2,009,280 100.0
Note: Answers may differ slightly due to rounding.
13-38 FINANCIAL ACCOUNTING SOLUTIONS MANUAL
DECISION CASE 13-2 (Concluded)
4. Within the Current Assets category, cash and cash equivalents increased only slight-
ly in relative importance at the end of 2014. Leasehold improvements, property and
LO 3 DECISION CASE 13-3 COMPARING TWO COMPANIES IN THE SAME INDUSTRY:
CHIPOTLE AND PANERA BREAD
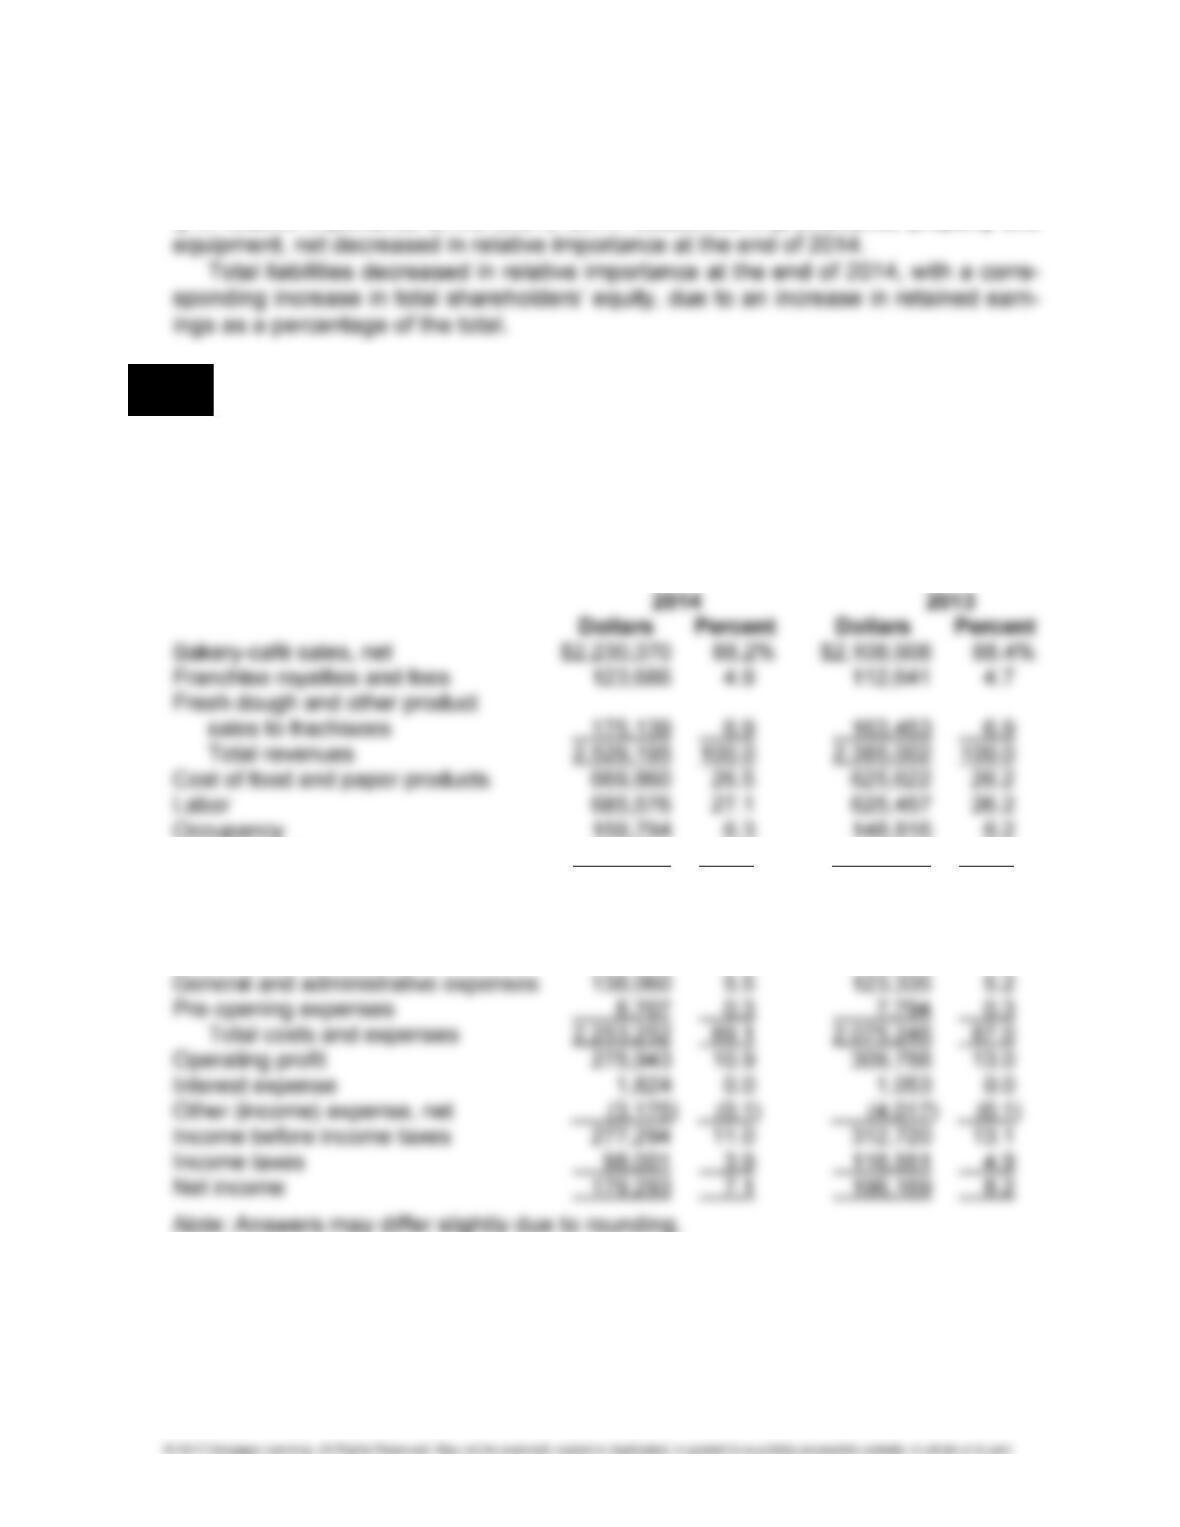
1. Common-size comparative income statements:
PANERA BREAD COMPANY
COMMON-SIZE CONSOLIDATED STATEMENTS OF INCOME
FOR THE YEARS ENDED DECEMBER 30, 2014 AND DECEMBER 31, 2013
(IN THOUSANDS OF DOLLARS)
Other operating expenses 314,879 12.5 295,539 12.4
Total bakery-café expenses 1,830,109 72.4 1,695,434 71.0
Fresh dough and other product cost
of sales to franchisees 152,267 6.0 142,160 6.0
Depreciation and amortization 124,109 4.9 106,523 4.5
2. Chipotle’s income from operations as a percentage of revenues is 17.3% in 2014,
compared to 10.9% for Panera Bread. Similarly, Chipotle’s profit margin is over 10%
for each of the two years, while Panera Bread’s profit margin averages 7.65% for the
two years.
CHAPTER 13 • FINANCIAL STATEMENT ANALYSIS 13-39
DECISION CASE 13-3 (Concluded)
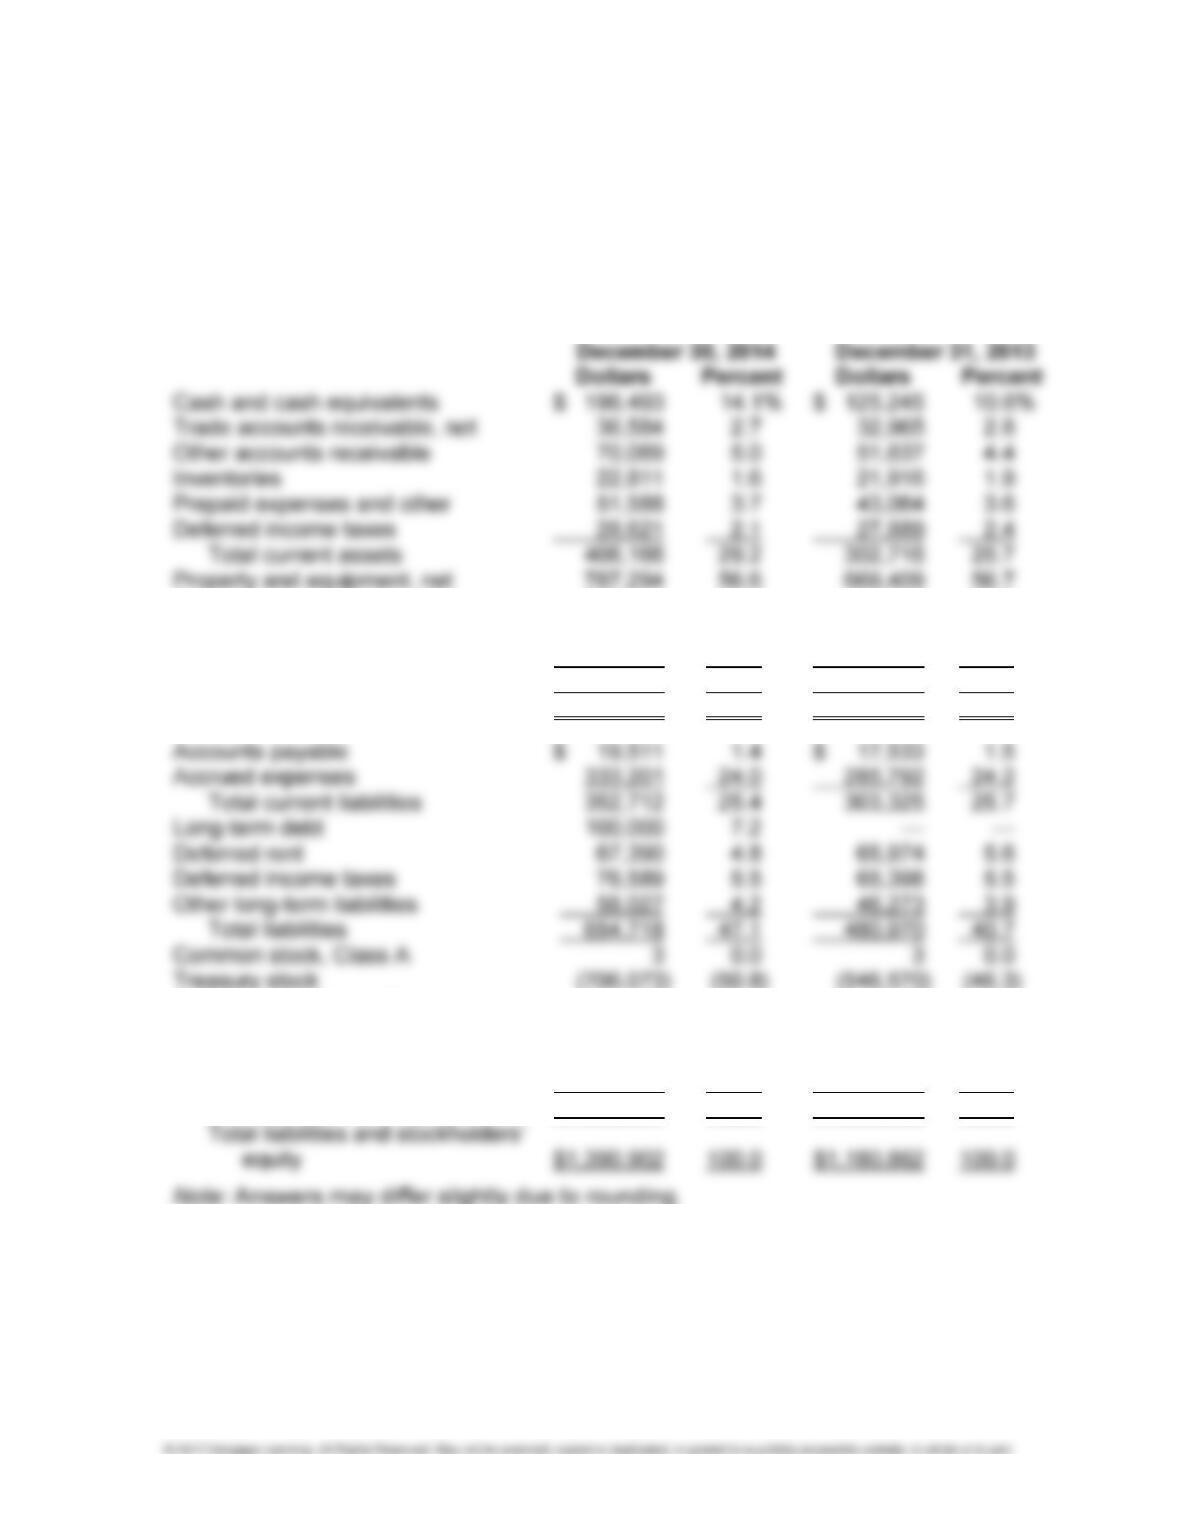
3. Common-size comparative balance sheets:
PANERA BREAD COMPANY
COMMON-SIZE CONSOLIDATED BALANCE SHEETS
AT DECEMBER 30, 2014 AND DECEMBER 31, 2013
(IN THOUSANDS OF DOLLARS)
Goodwill 120,778 8.7 123,013 10.4
Other intangible assets, net 70,940 5.1 79,768 6.7
Deposits and other 5,724 0.4 5,956 0.5
Total other assets 197,442 14.2 208,737 17.6
Total assets $1,390,902 100.0 $1,180,862 100.0
Additional paid-in capital 214,437 15.4 196,908 16.7
Accumulated other comprehensive
(loss) income (1,360) (0.1) (333) 0.0
Retained earnings 1,229,177 88.4 1,049,884 88.9
Total stockholders’ equity 736,184 52.9 699,892 59.3
4. Chipotle has a higher percentage of its total assets in current assets at the end of
2014, 34.5% compared to 29.2% for Panera Bread. Also, Chipotle’s current liabilities
are only 9.7% of total liabilities and shareholders’ equity at the end of 2014, com-
pared to 25.4% for Panera Bread. Similarly, Chipotle’s total liabilities are only 21% of
total liabilities and shareholders’ equity compared to 47.1% for Panera Bread, result-
ing in a lower debt-to-equity ratio for Chipotle.

1. Ratios and other amounts for Panera Bread (all dollar amounts in thousands):
a. Working Capital = Current Assets – Current Liabilities
2014: $406,166 – $352,712 = $53,454
2013: $302,716 – $303,325 = $(609)
d. Cash Flow from Operations to Current Liabilities = Net Cash Provided by
Operating Activities/Current Liabilities
2014: $335,079/$352,712 = 0.950 to 1
2013: $348,417/$303,325 = 1.149 to 1
CHAPTER 13 • FINANCIAL STATEMENT ANALYSIS 13-41
DECISION CASE 13-4 (Concluded)
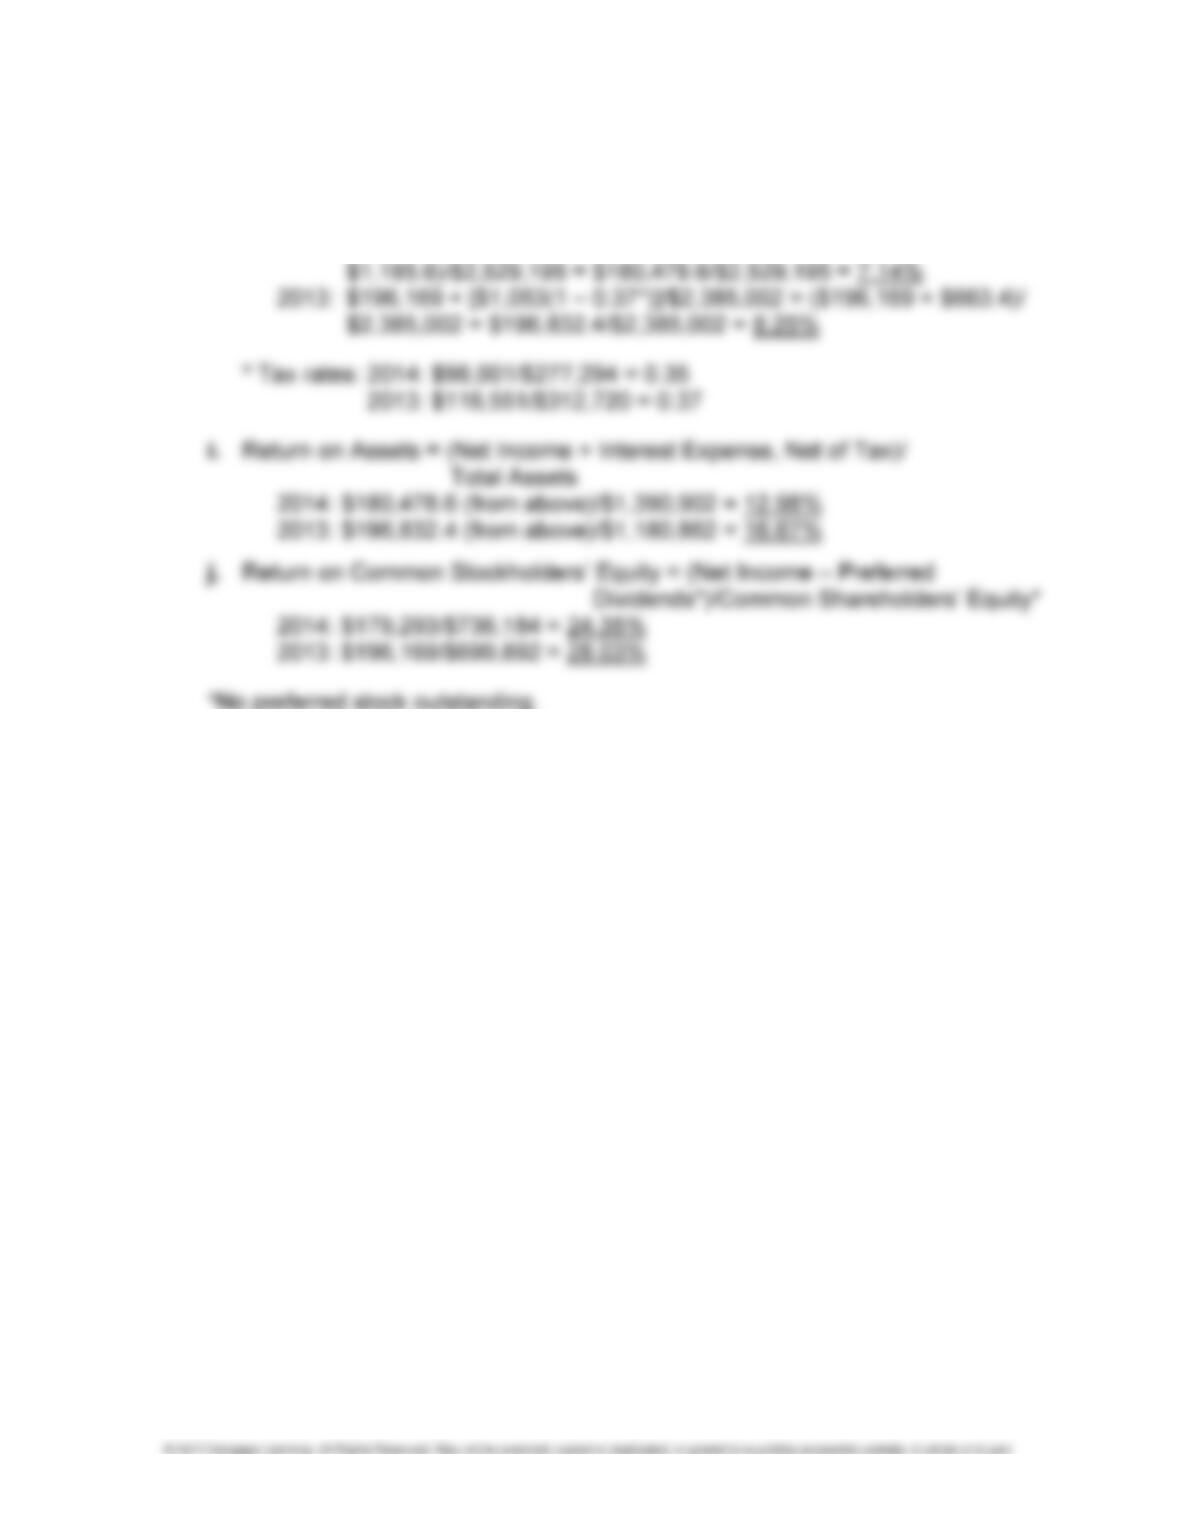
h. Return on Sales = (Net Income + Interest Expense, Net of Tax)/Total
Revenues
2014: $179,293 + [$1,824(1 – 0.35*)]/$2,529,195 = ($179,293 +
2. Panera Bread appears to be liquid at the end of 2014, with a current ratio over 1 to 1
and an acid-test ratio of about 0.86 to 1. The debt-to-equity ratio did increase at the
end of 2014, but is still under 1 to 1. Panera Bread’s return ratios are lower in 2014
than in 2013, but are still very strong, with a return on assets of 13% and a return on
equity of nearly 25%.
13-42 FINANCIAL ACCOUNTING SOLUTIONS MANUAL
MAKING FINANCIAL DECISIONS
LO 4,5,6,7 DECISION CASE 13-5 ACQUISITION DECISION
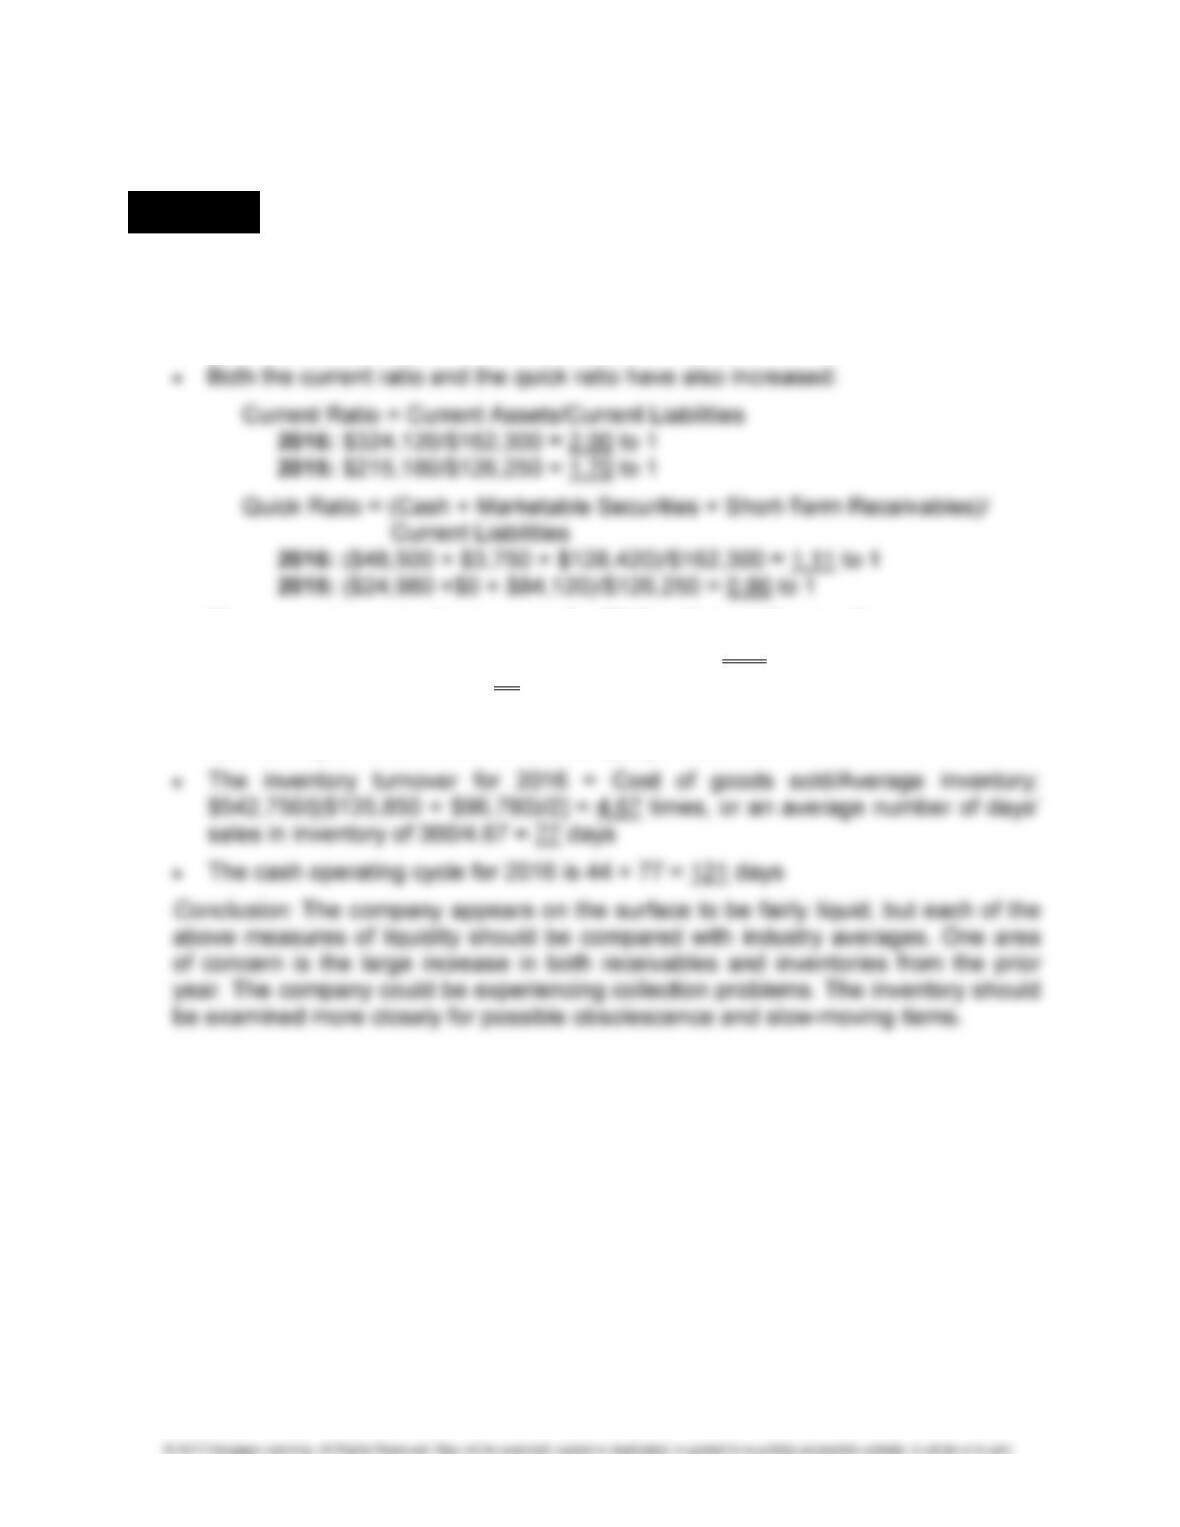
1. Several measures give an indication as to the company’s liquidity:
• Working capital has nearly doubled over the two-year period, from $88,930,000
in 2015 to $161,820,000 in 2016.
• The accounts receivable turnover for 2016 = Net credit sales/Average accounts
receivable: $875,250/[($128,420 + $84,120)/2] = 8.24 times, or an average col-
lection period of 360/8.24 = 44 days
Whether this is a reasonable number of days outstanding could be partially de-
termined by an examination of the company’s credit terms.
CHAPTER 13 • FINANCIAL STATEMENT ANALYSIS 13-43
DECISION CASE 13-5 (Continued)
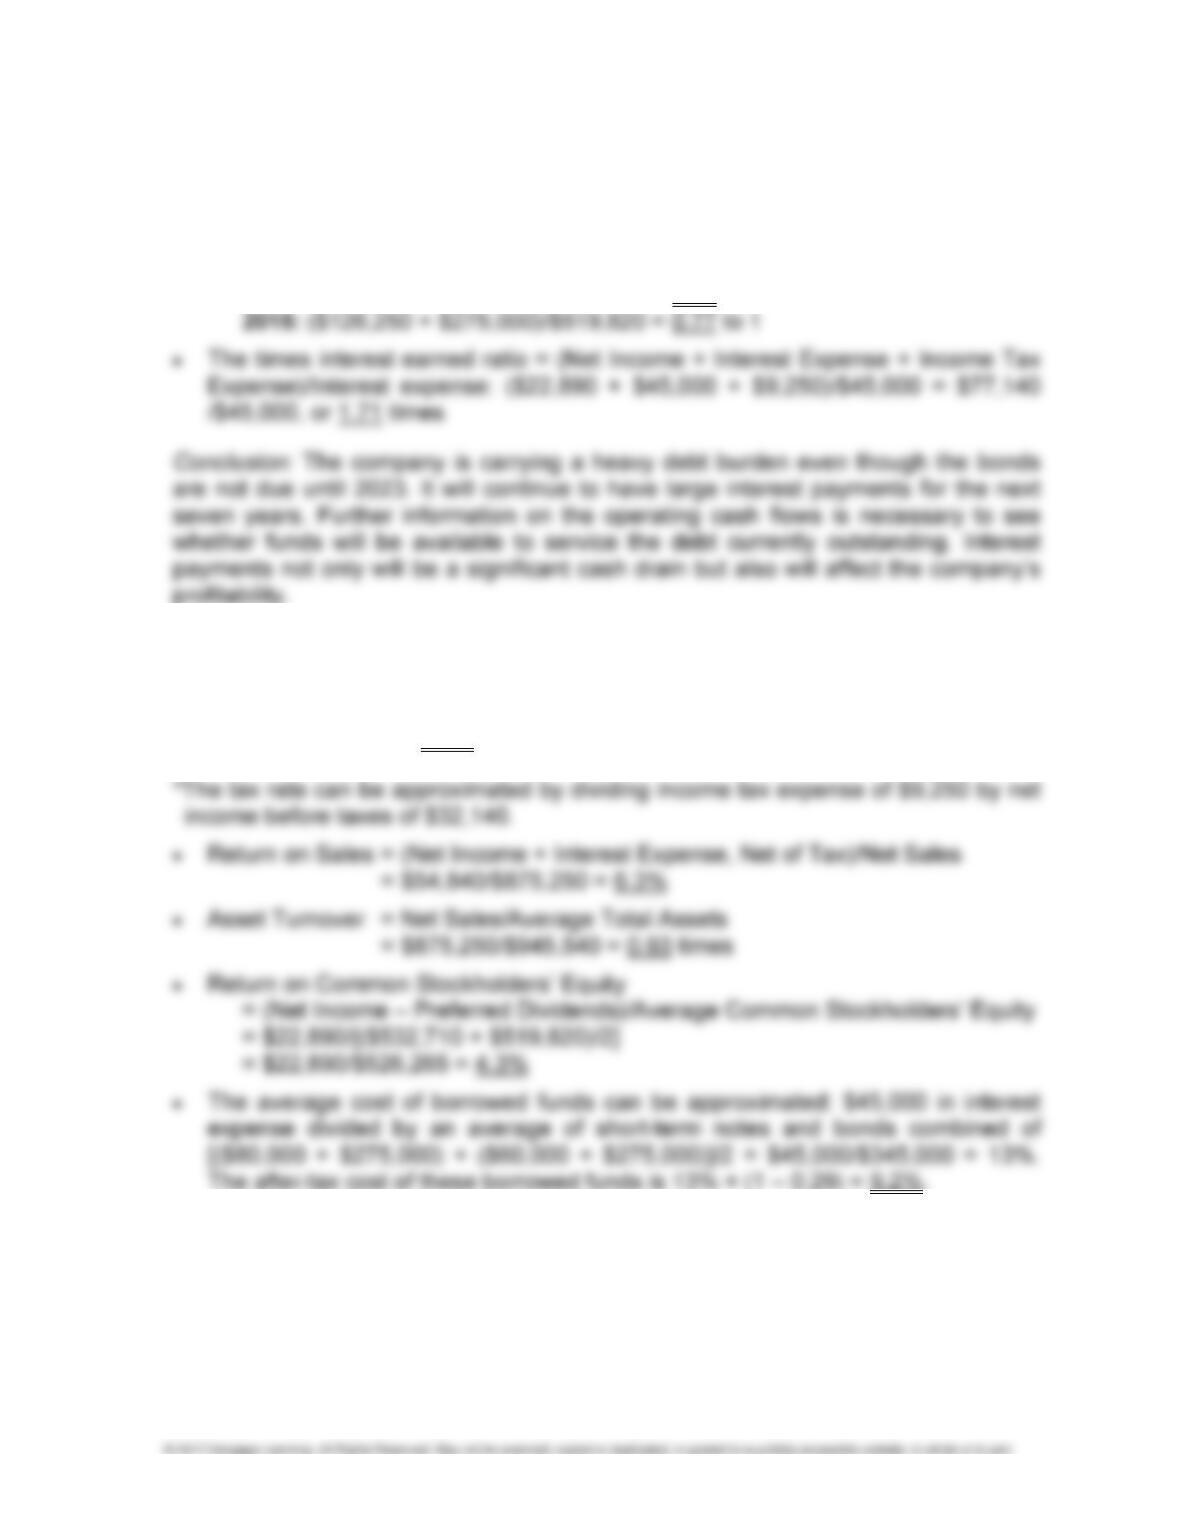
2. The company’s solvency can be examined by looking at the following factors:
• The debt-to-equity ratio has increased slightly from the prior year: Total liabilities/
Total stockholders’ equity
2016: ($162,300 + $275,000)/$532,710 = 0.82 to 1
3. Profitability can be assessed by looking at a number of ratios for 2016.
• Return on Assets = (Net Income + Interest Expense, Net of Tax)/Average Total
Assets: [$22,890 + ($45,000)(1 – 0.29*)] divided by ($970,010 + $921,070)/2 =
$54,840/$945,540 = 5.8%
13-44 FINANCIAL ACCOUNTING SOLUTIONS MANUAL
DECISION CASE 13-5 (Concluded)
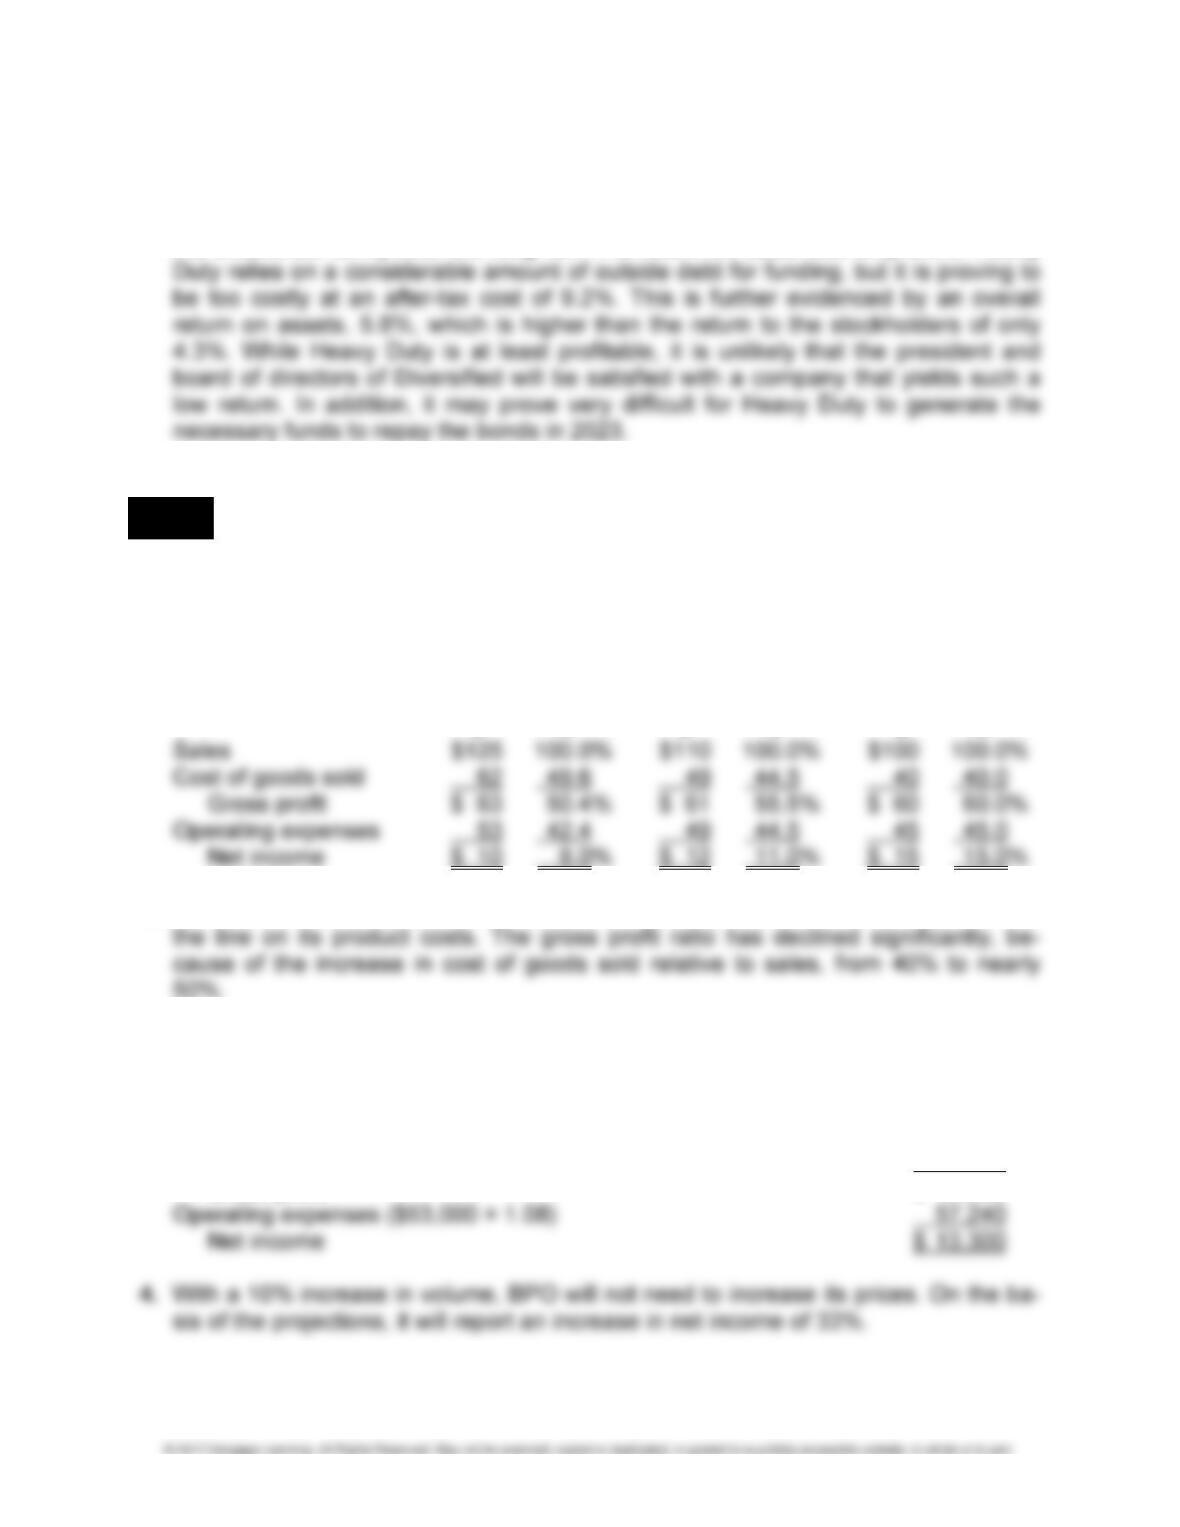
4. It would be difficult to recommend to the vice president of acquisitions that Heavy
Duty be acquired. It has not demonstrated the ability to be a profitable member of
the Diversified family over the long run. The return on sales was only 6.3%. Heavy
LO 3 DECISION CASE 13-6 PRICING DECISION
1. BPO
COMMON-SIZE COMPARATIVE INCOME STATEMENTS
FOR YEARS 1–3
(IN THOUSANDS OF DOLLARS)
Year 3 Year 2 Year 1
$ % $ % $ %
2. Net income has decreased while sales have increased because BPO has not held
3. BPO
INCOME STATEMENT
YEAR 4
Sales ($125,000 × 1.10) $137,500
Cost of goods sold ($62,000 × 1.08) 66,960
Gross profit $ 70,540
CHAPTER 13 • FINANCIAL STATEMENT ANALYSIS 13-45
ETHICAL DECISION MAKING
LO 4,5 DECISION CASE 13-7 PROVISIONS IN A LOAN AGREEMENT
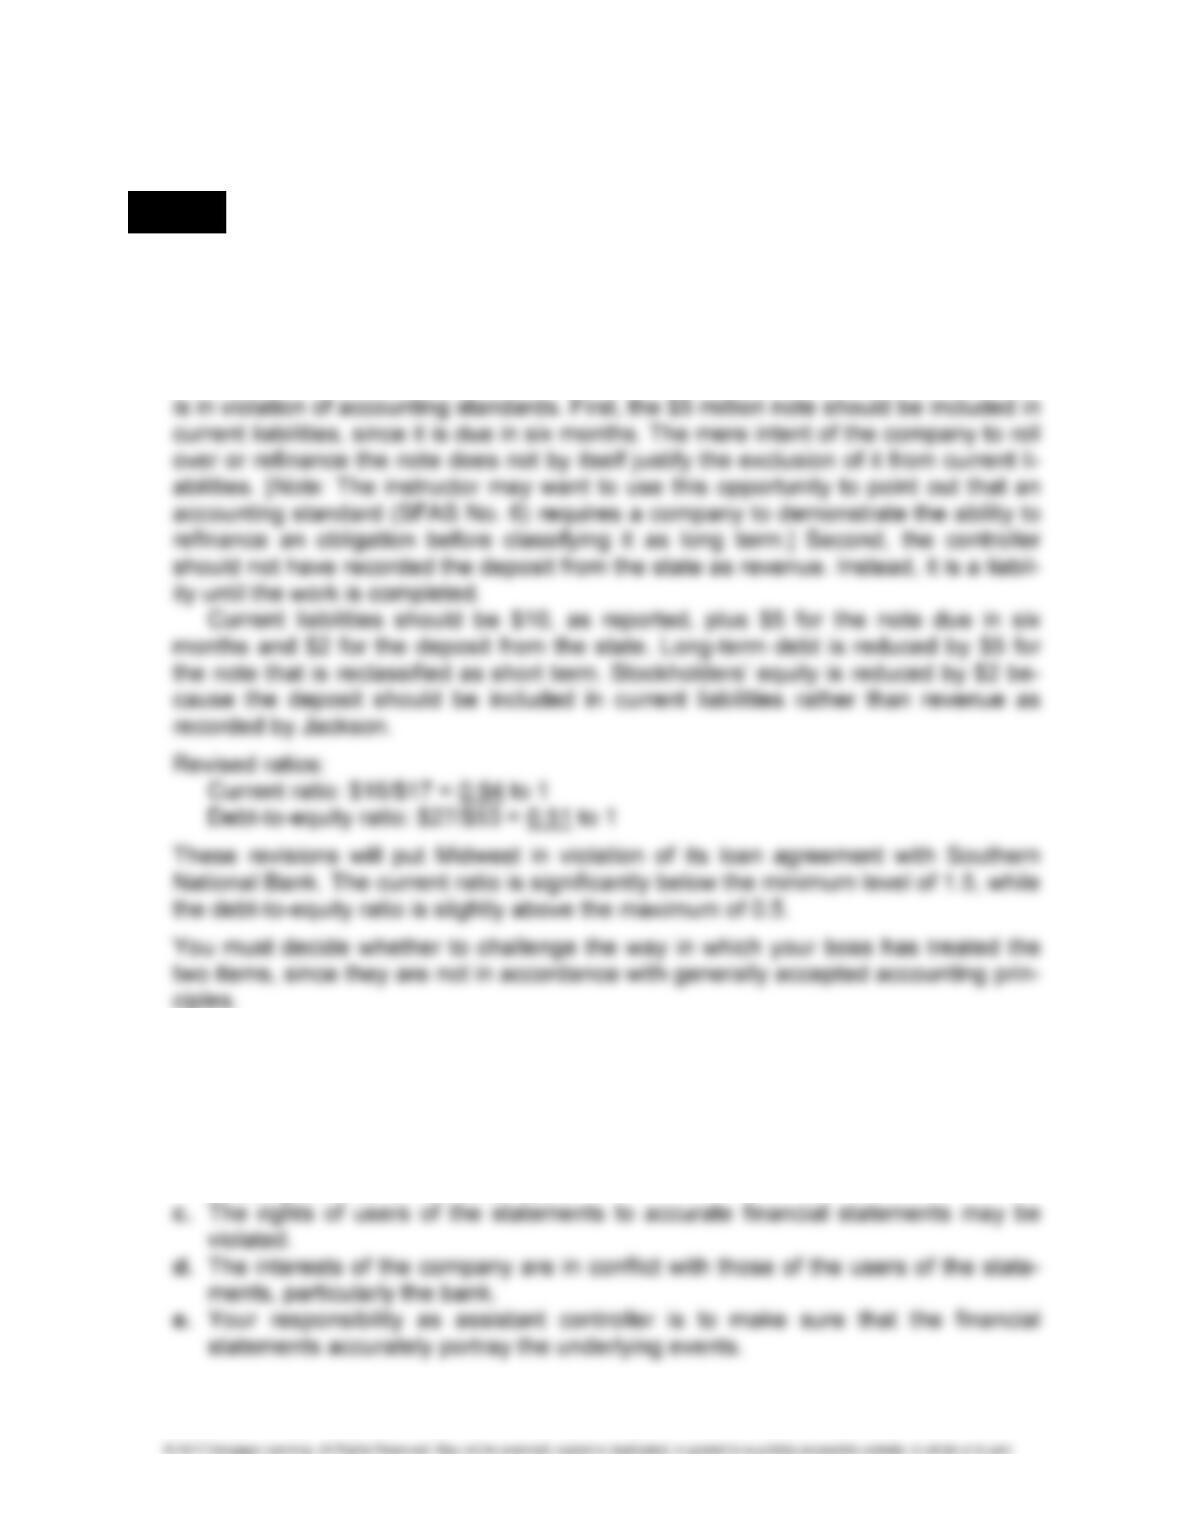
1. Recognize an ethical dilemma:
No, Midwest is not in violation of its existing loan agreement. The current ratio is
$16/$10, or 1.6 to 1, which is above the minimum requirement of 1.5. The debt-to-
equity ratio is $25/$55, or 0.45 to 1, which is below the maximum of 0.5.
Jackson has handled each of the two items incorrectly and the treatment of both
2. Analyze the key elements in the situation:
a. The company may benefit and the users of the statements, particularly the bank,
may be harmed.
b. The company would benefit if the bank makes a loan based on incorrect current
and debt-to-equity ratios. The bank could be harmed if it relies on these ratios in
deciding whether to make the loan.
13-46 FINANCIAL ACCOUNTING SOLUTIONS MANUAL
DECISION CASE 13-7 (Concluded)
3. List alternatives and evaluate the impact of each on those affected:
Your options are to go along with the controller and not question any further the
4. Select the best alternative:
The best alternative is to insist that both the note and the deposit be included in cur-
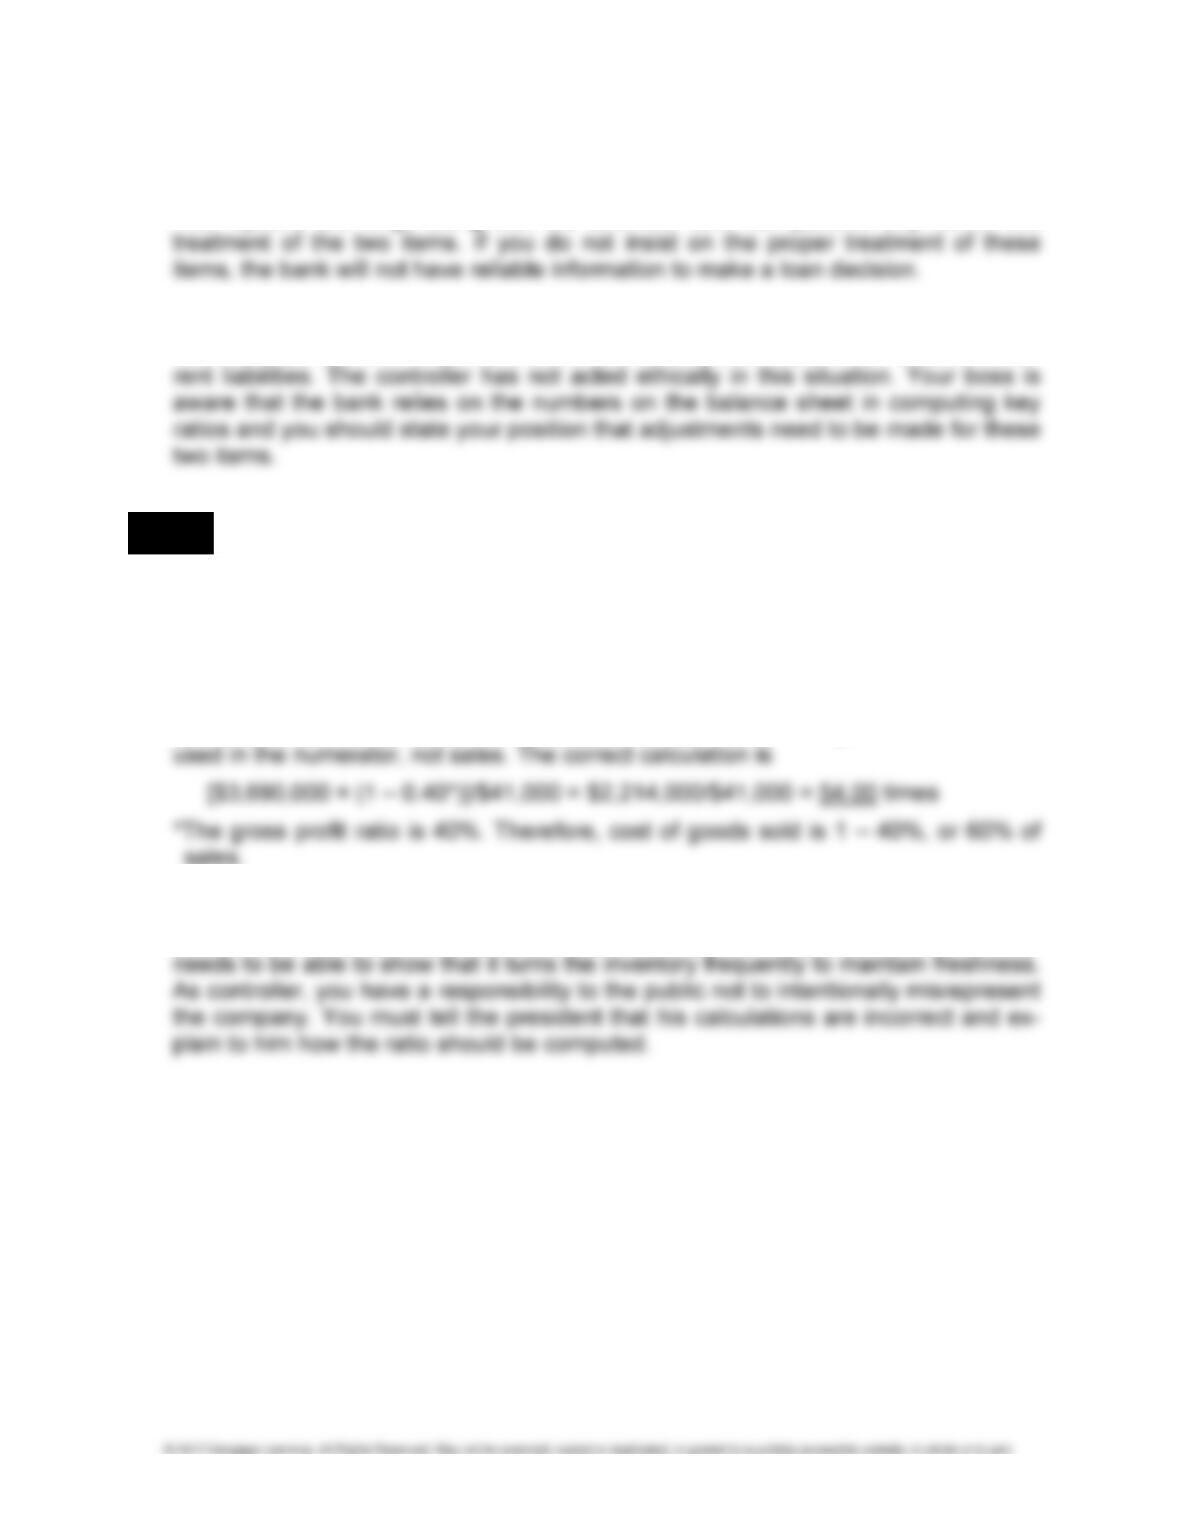
LO 4 DECISION CASE 13-8 INVENTORY TURNOVER
1. The president calculated the inventory turnover ratio of 90 times by dividing sales
revenue of $3,690,000 by the average inventory balance of $41,000 (the average of
$40,000 at the end of 2016 and $42,000 at the end of 2015).
2. The president has erroneously used sales rather than cost of goods sold to calculate
inventory turnover. Because inventory is stated at cost, cost of goods sold must be
3. It is understandable why the president would prefer to report an inventory turnover of
90 times, rather than 54 times. In the fruits and vegetables business, the company
CHAPTER 13 • FINANCIAL STATEMENT ANALYSIS 13-47
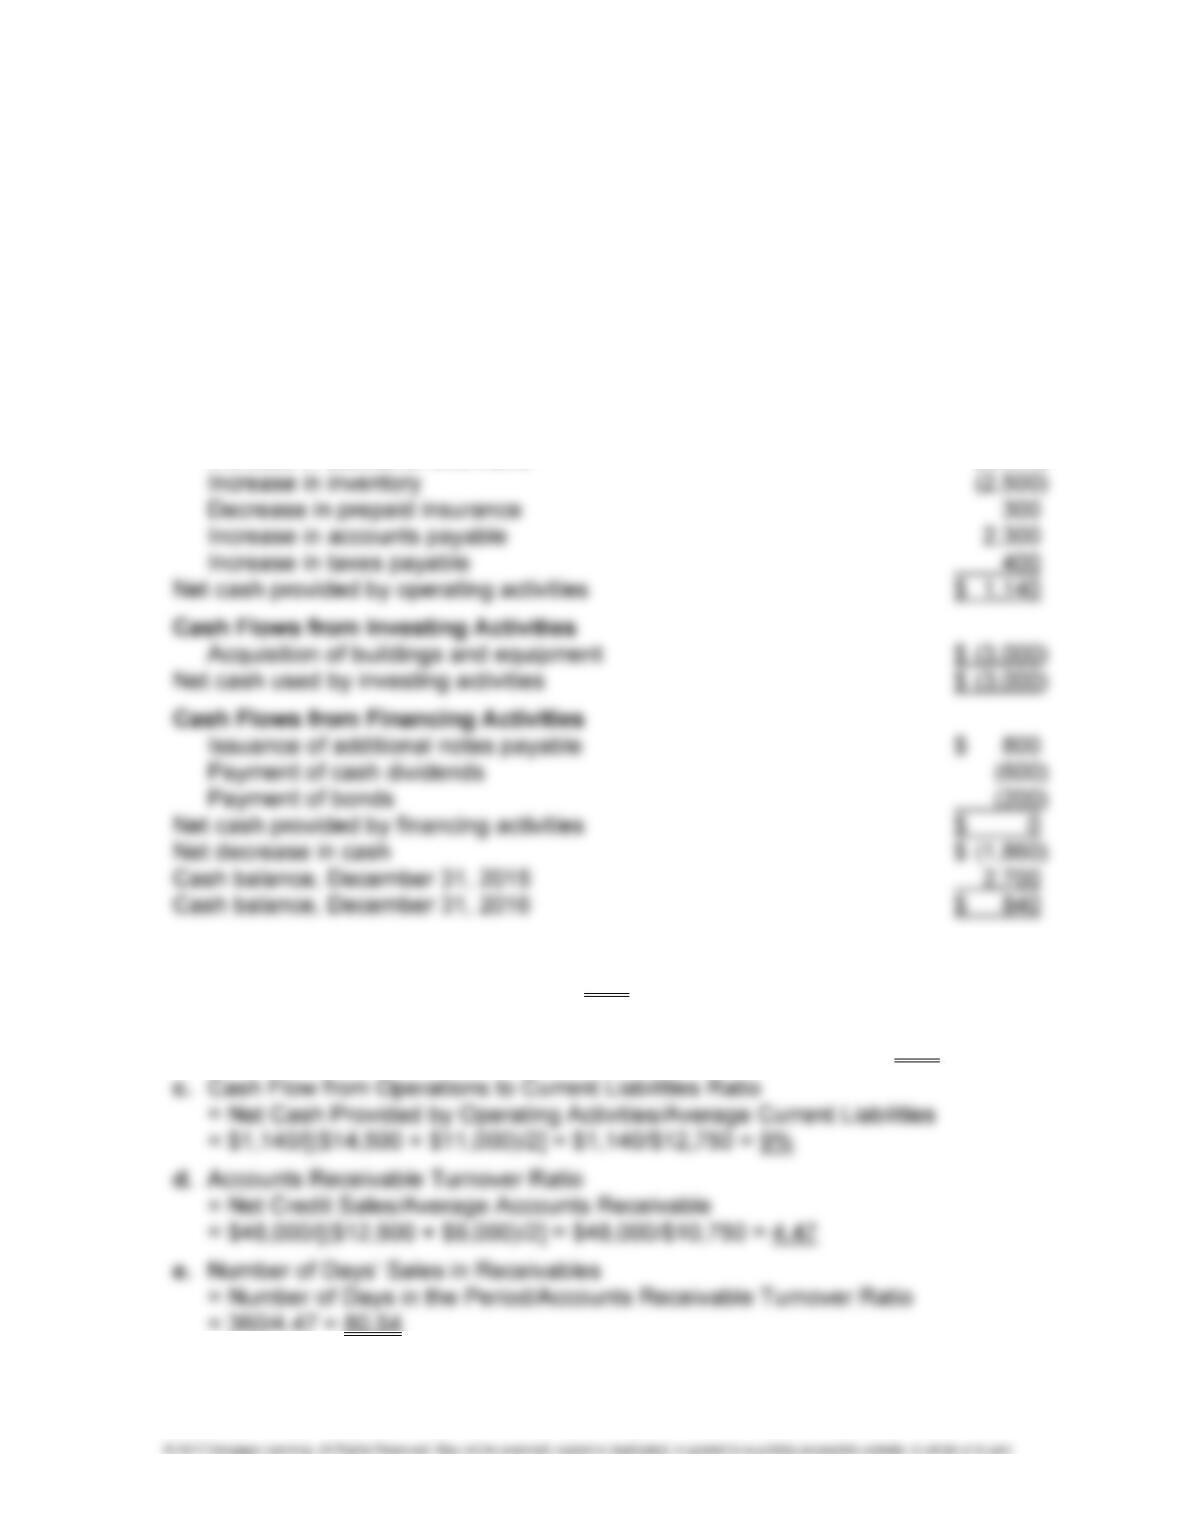
SOLUTION TO INTEGRATIVE PROBLEM
1. GALLAGHER, INC.
STATEMENT OF CASH FLOWS
FOR THE YEAR ENDED DECEMBER 31, 2016
(IN THOUSANDS OF DOLLARS)
Cash Flows from Operating Activities
Net income $ 3,440
Adjustments to reconcile net income to net
cash provided by operating activities:
Depreciation expense 700
Increase in accounts receivable (3,500)
2. a. Current Ratio = Current Assets/Current Liabilities
= $21,440/$14,500 = 1.48 to 1
b. Acid-Test Ratio = (Cash + Accounts Receivable)/Current Liabilities
= ($840 + $12,500)/$14,500 = $13,340/$14,500 = 0.92 to 1
13-48 FINANCIAL ACCOUNTING SOLUTIONS MANUAL
f. Inventory Turnover Ratio = Cost of Goods Sold/Average Inventory
= $36,000/[($8,000 + $5,500)/2]
= $36,000/$6,750 = 5.33
3. Gallagher’s current ratio decreased from 1.6 in 2015 to 1.48 in 2016, and its acid-
test ratio also decreased from 1.06 in 2015 to 0.92 in 2016. For many companies, an
acid-test ratio below 1 is not desirable because it may signal the need to liquidate
marketable securities to pay bills, regardless of the current trading price of the secu-
rities. Gallagher currently doesn’t own marketable securities; therefore, it may have