INSTRUCTOR’S MANUAL
13–12
Lecture Suggestions
Module 1
LO 1
The Review Problem at the end of the chapter, using the lululemon athletica inc. statements, can
generate a good discussion of what can be found by performing ratio analysis on key financial
statement numbers.
Module 2
LO 4
The cash-to-cash cycle and its components, the days in inventory and the days in accounts
receivable, can be explained in conjunction with the current ratio to assess the adequacy of the
company’s current ratio. Similarly, days in accounts receivable measures how “quick” accounts
receivable actually is.
the company produces, in the form of net income. In a bank account, interest is not always
withdrawn, but is left to earn more interest than that which would be earned on the initial
investment alone. Stockholders do not withdraw all net income as dividends, but leave some
invested in the company to generate greater future income.
DECISION MODELS
There are many excellent exercises and problems in this chapter that can be adapted so
the students can solve the problems using the ratio analysis model and the business
decision model.
CHAPTER 13 FINANCIAL STATEMENT ANALYSIS
13–13
Projects and Activities
Module 1
LO 2
Horizontal Analysis
Outside assignment: lululemon athletica inc. Income Statement
The income statements for 2015, 2014, and 2013 for lululemon athletica Inc., are presented in the review
problem in your textbook. Set up a worksheet with columns similar to the Henderson Company example
(Exhibit 13-1) in your textbook to do a horizontal analysis of lululemon’s income statements through
income from operations. Round numbers to tenths of a percent to minimize rounding problems.
Solution
If you require or encourage the use of personal computers by your students, either at home or in an on-
FYE
FYE
FYE
Feb. 1
Feb. 2
Feb. 3
2015-2014
2015-2014
2014-2013
2012–
2011
2015
2014
2013
$
%
$
%
Net revenue
1,797,213
1,591,188
1,370,358
206,025
12.95%
220,830
16.11%
Cost of goods sold
883,033
751,112
607,532
131,921
17.56%
143,580
23.63%
Gross profit
914,180
840,076
762,826
74,104
8.82%
77,250
10.13%
Selling, gen & admin exp
538,147
448,718
386,387
89,429
19.93
62,331
16.13%
Income from operations
376,033
391,358
376,439
(15,325)
(3.92%)
14,919
3.96%
INSTRUCTOR’S MANUAL
13–14
In the MD &A of their FYE 2015 K-1, lululemon states1:
Gross Profit
Gross profit, as a percentage of net revenue, or gross margin, decreased 190 basis points, to 50.9% in
fiscal 2014 from 52.8% in fiscal 2013. The decrease in gross margin resulted primarily from:
• a decrease of 210 basis points due to product mix, increased product costs, and increased air
freight costs
• an increase in expenses related to our product and supply chain departments, relative to the
increase in net revenue, of 70 basis points;
• an increase in fixed costs, such as occupancy costs and depreciation, relative to the increase
in net revenue, of 40 basis points; and
• an unfavorable impact of foreign exchange rates on product costs which contributed to a
decrease in gross margin of 40 basis points
The decrease in gross margin was partially offset by a decrease in provision for inventories, charged
to cost of sales, of 110 basis points related to the pull-back of black Luon pants which was recorded
in the first quarter of fiscal 2013. A decrease in markdowns of 60 basis points driven by high sell–
through of seasonal items also partially offset the decrease in gross margin.”
CHAPTER 13 FINANCIAL STATEMENT ANALYSIS
Module 1
LO 3
Vertical Analysis
Outside assignment: lululemon athletica balance sheet
Vertical analysis involves recasting a financial statement in a form that eliminates absolute size as a
variable, and instead looks at the relative size of each element of the statement. Use the lululemon athletica
Consider the following questions:
◼ Did any items change significantly? If so, can you explain the change?
◼ What does this format show that you did not see when you merely compared the two balance
sheets?
INSTRUCTOR’S MANUAL
13–16
Solution lululemon athletica
2015
%
2014
%
Current Assets
Cash and cash equivalents
664,479
51.26%
698,649
55.79%
Accounts receivable
13,746
1.06%
11,903
0.95%
Inventories
208,116
16.06%
188,790
15.07%
Prepaid expenses
64,671
4.99%
46,197
3.69%
Stockholders’ equity
Common stock
661
0.05%
577
0.05%
Additional paid-in capital
241,695
18.65%
240,351
19.19%
Retained earnings
Accumulated other comp income
Total equity
84.06%
87.57%
Total liabilities and equity
100.00%
1,020,619
78.74%
923,822
73.76%
951,012
73.37%
945,539
75.50%
Property and equipment
296,008
22.84%
255,603
20.41%
Goodwill and intangibles
2.02%
2.25%
Deferred income taxes
16,018
1.24%
18,300
1.46%
Other non-current assets
0.54%
0.38%
Current Liabilities
Accounts payable
9,339
0.72%
12,647
1.01%
Accrued inventory liabilities
1.72%
1.23%
Accrued compensation
2.31%
1.55%
Income taxes payable
20,073
1.55%
0.06%
Other accrued liabilities
31,989
2.47%
29,595
2.36%
159,881
12.33%
116,214
9.28%
Non-current liabilities
46,764
3.61%
39,492
3.15%
206,645
15.94%
155,706
12.43%
CHAPTER 13 FINANCIAL STATEMENT ANALYSIS
13–17
Each asset is expressed as a percentage of total assets; each liability or equity account is expressed as a
percentage of total liabilities plus equity.
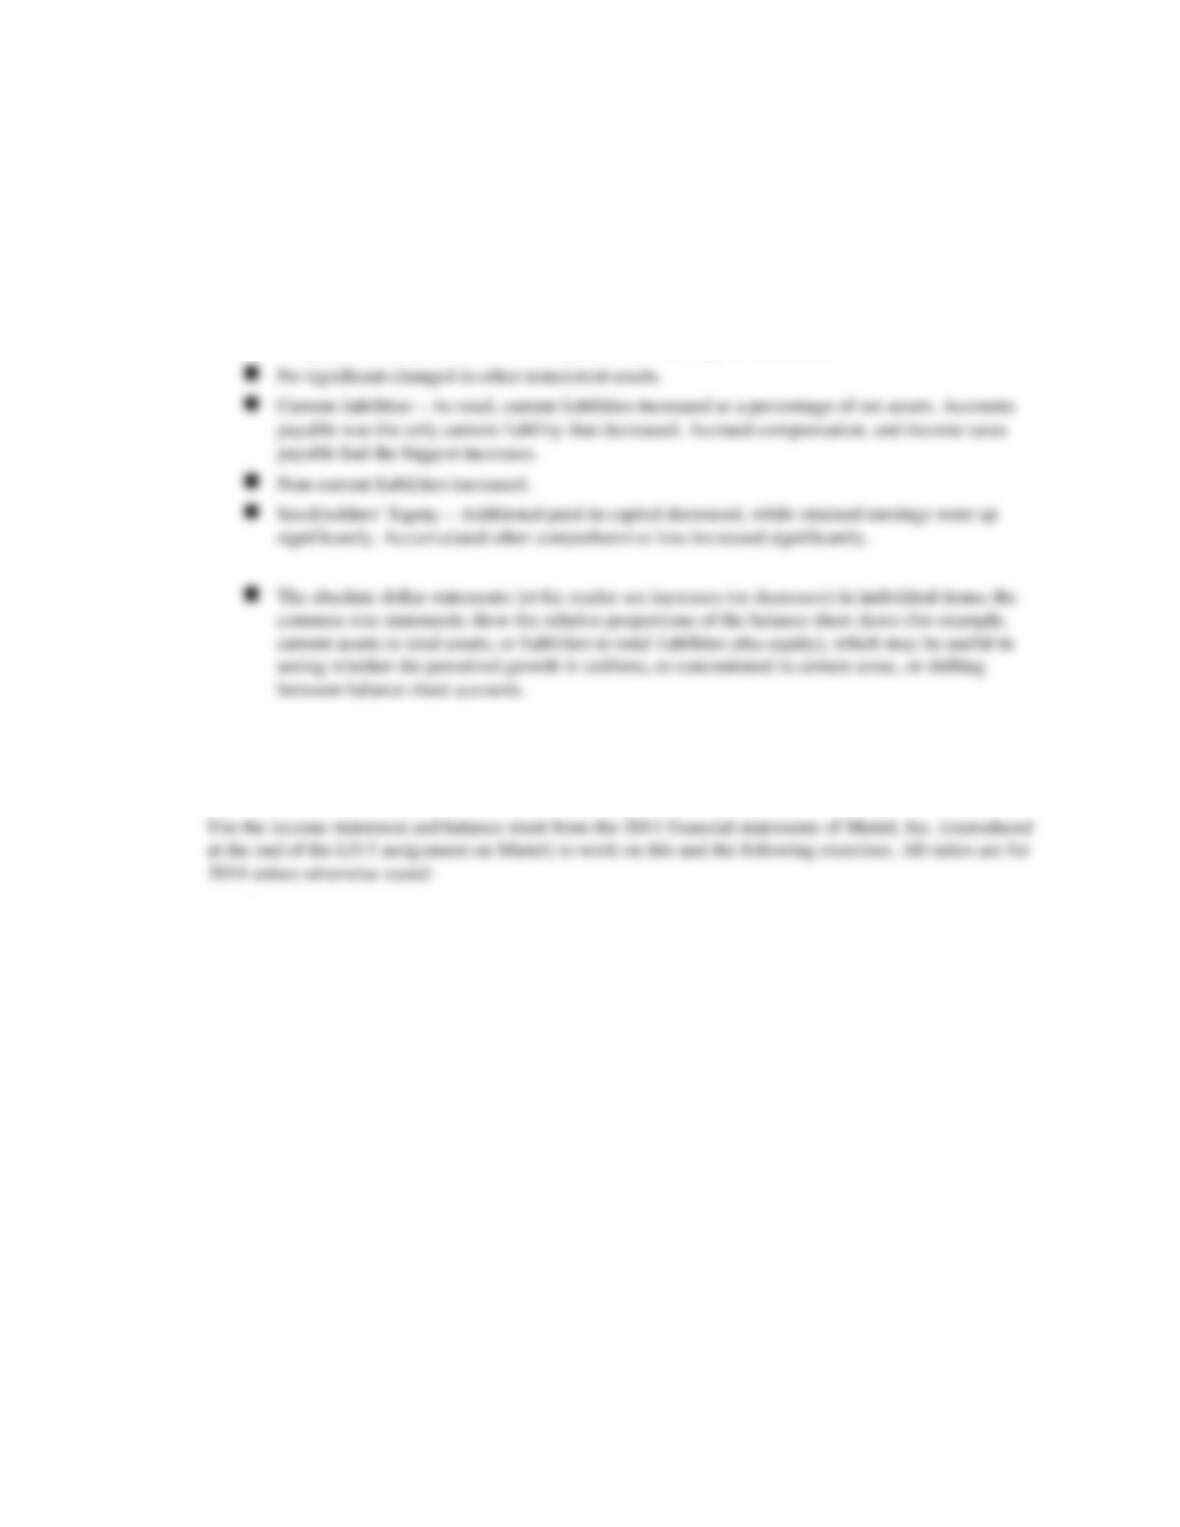
◼ Current assets: down slightly as a percentage of total assets. Biggest reason was the decrease in
cash and cash equivalents.
◼ Property and equipment increased slightly as a percentage of total assets.
Module 2
LO 4
Liquidity Analysis and the Management of Working Capital
In-class assignment: Mattel, Inc. liquidity
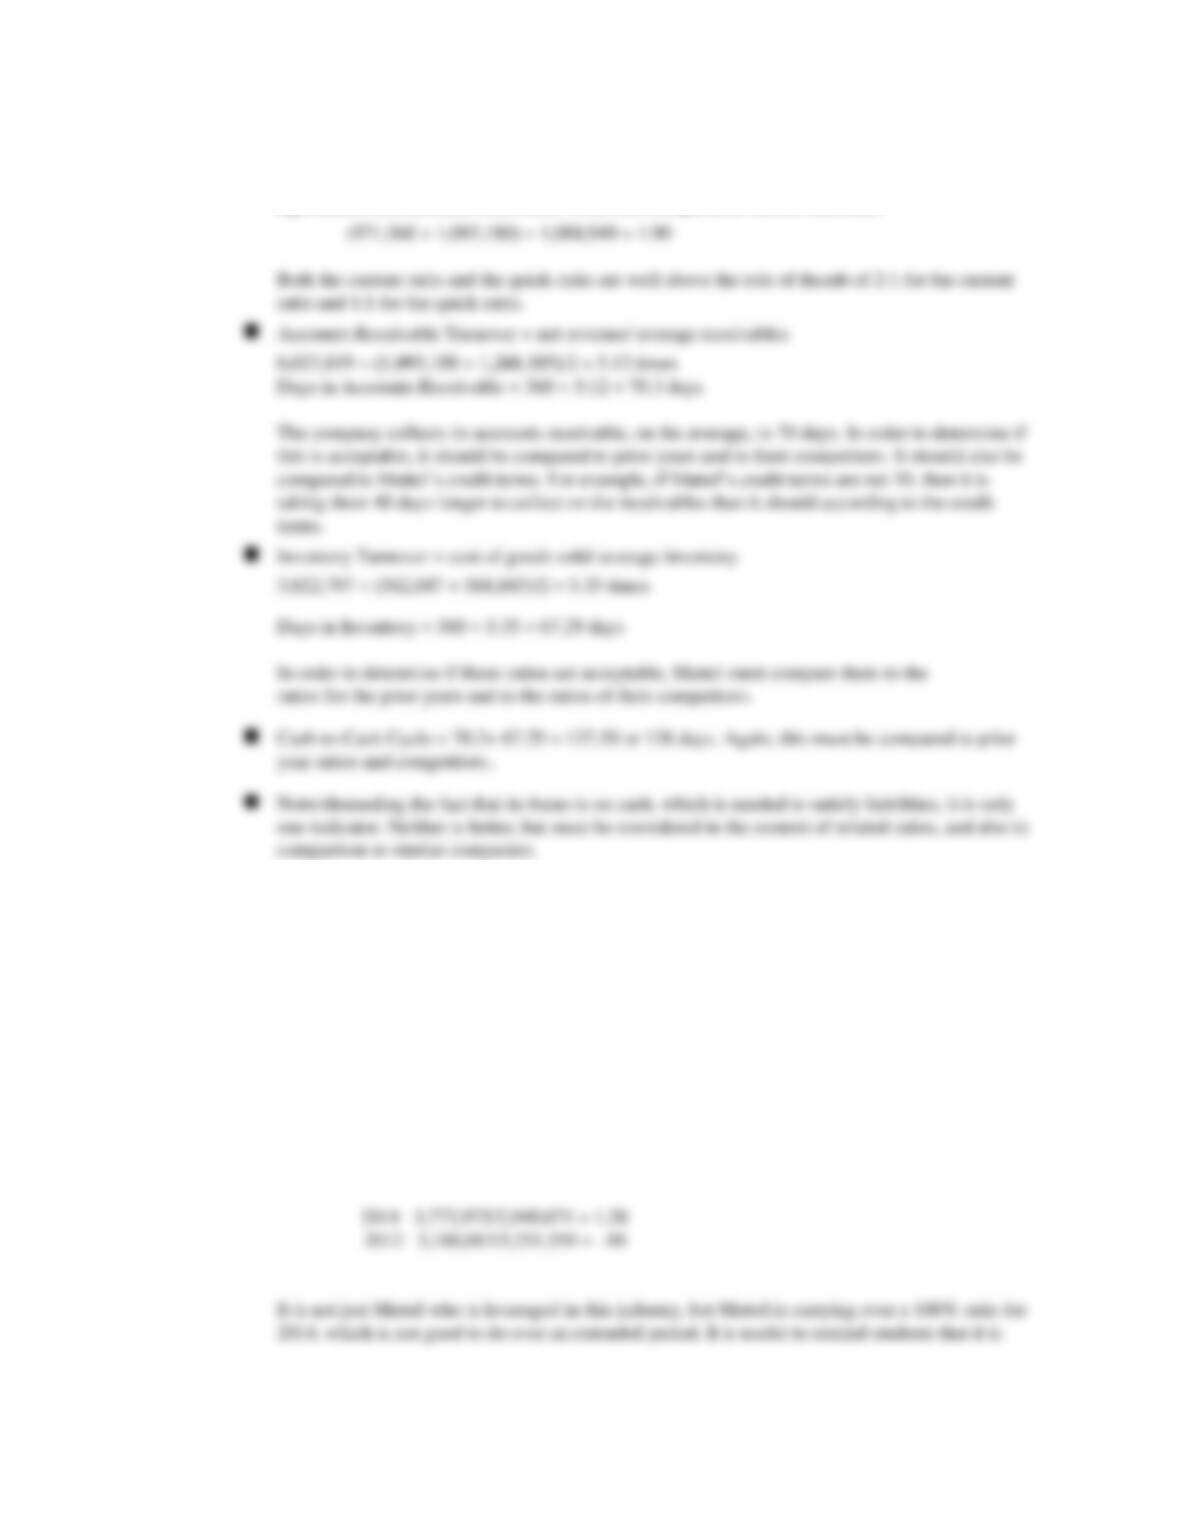
◼ Calculate Mattel’s current ratio.
◼ Calculate Mattel’s quick ratio. Is the difference significant between the current and quick ratios?
Can you explain what the difference means?
◼ Use the calculation of days in accounts receivable to evaluate Mattel’s current ratio. Based upon
the business Mattel is in, how would you expect their accounts receivable to differ from the
receivables of other companies?
◼ Calculate days in inventory for Mattel. How does the type of business Mattel is in influence the
contents of Mattel’s inventories, and how long these inventories are on hand?
◼ Calculate Mattel’s cash–to-cash cycle. What factors affect the company’s ability to generate cash?
◼ Is the cash flow from operations to current liabilities ratio a better indicator of Mattel’s ability to
generate enough cash to satisfy short-term obligations? Why or why not?
Solutions:
◼ Current Assets =3,185,951 1,088,949 = 2.93
Current Liabilities
INSTRUCTOR’S MANUAL
13–18
◼ The quick ratio is somewhat smaller. Students will probably use for quick assets: cash and
equivalents, and accounts receivable, which are compared to current liabilities
Module 3
LO 5
Solvency Analysis
In-class assignment: Mattel Computer Corp.
People within Mattel, as well as outside analysts, pay attention to key measures of the company’s ability to
use the resources available to it, especially in these tough economic times.
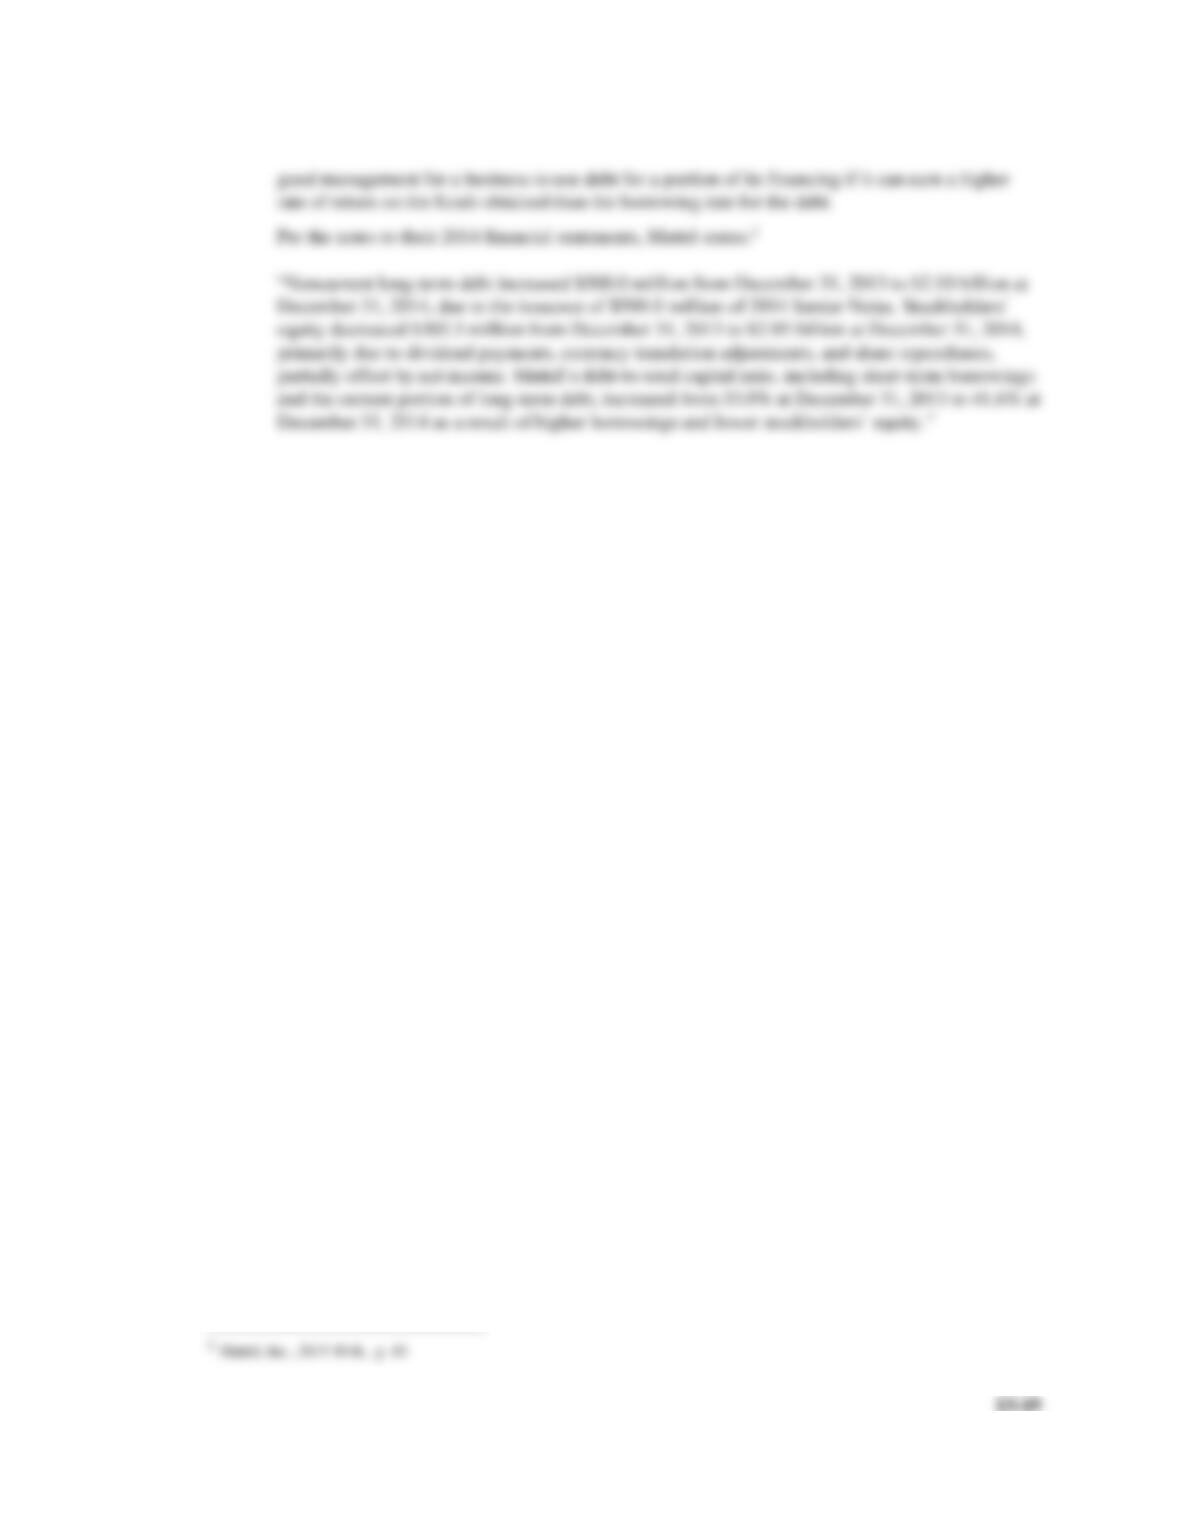
◼ Calculate Mattel’s debt–to-equity ratio for 2014 and 2013. How has it changed? Does Mattel
appear to depend heavily on debt financing?
NOTE: Other solvency ratios can be discussed using Mattel’s financial statements
Solution
Debt-to-Equity Ratio = Total Liabilities/Total Equity
CHAPTER 13 FINANCIAL STATEMENT ANALYSIS
INSTRUCTOR’S MANUAL
13–20
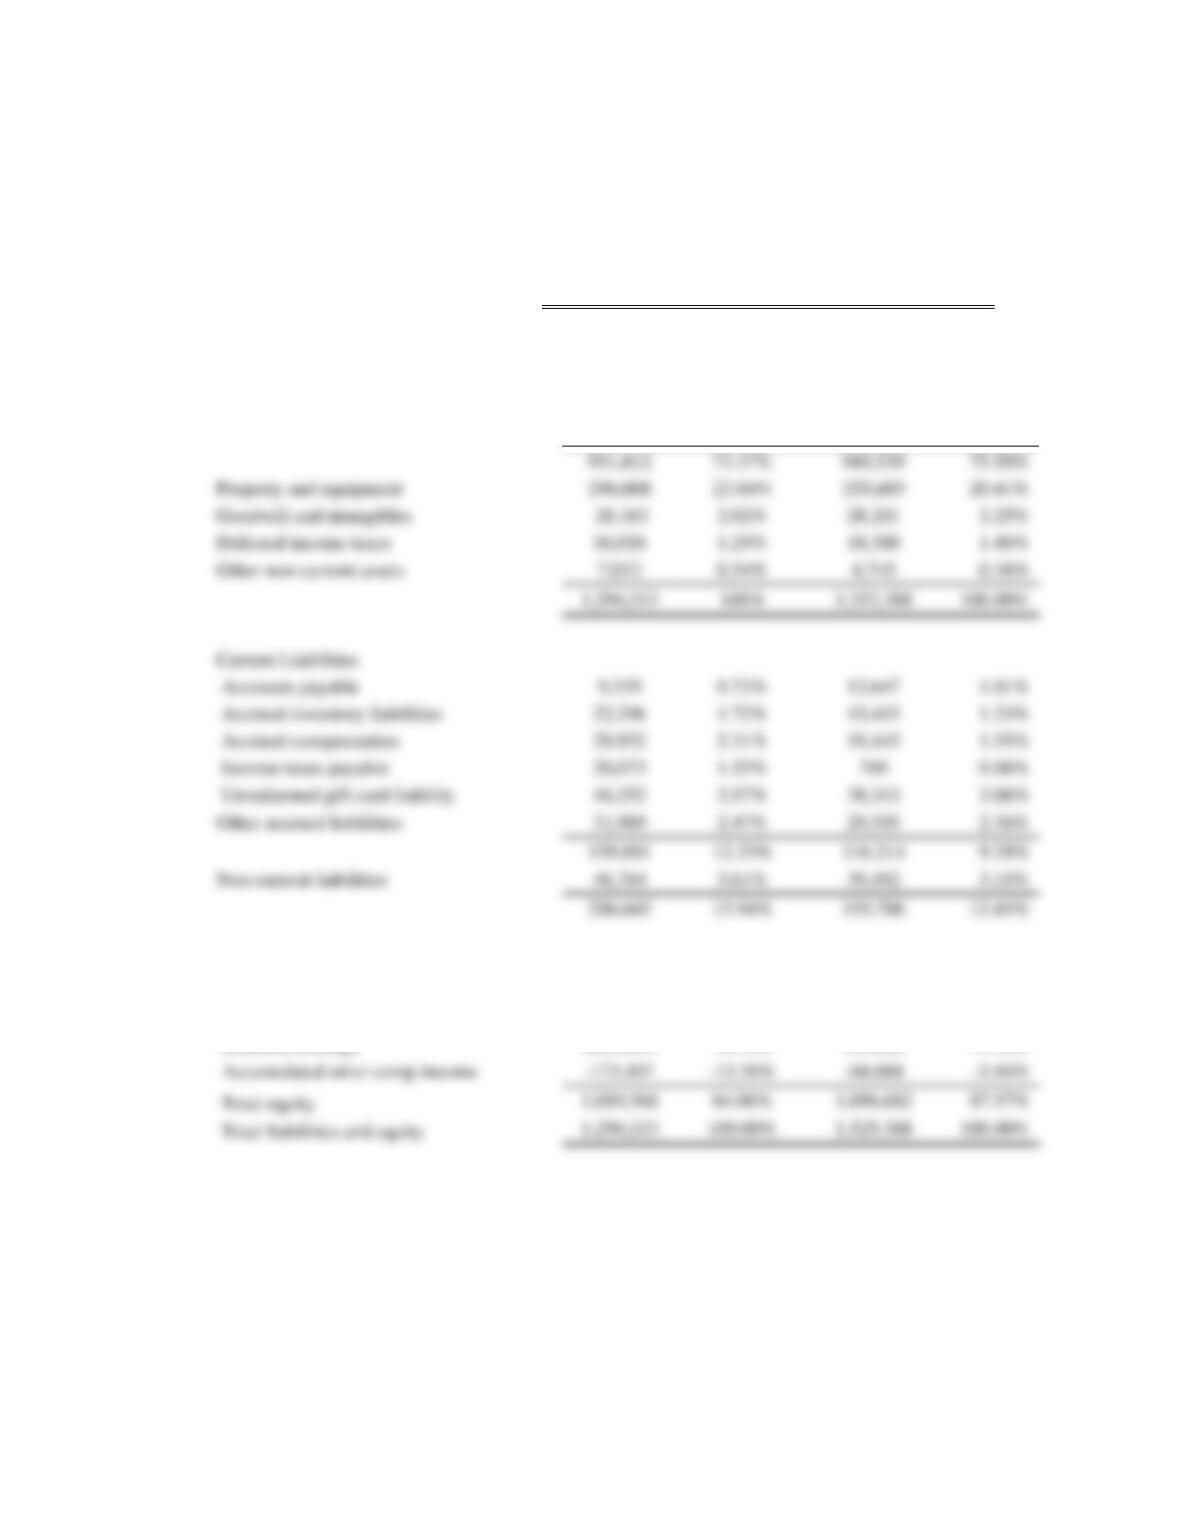
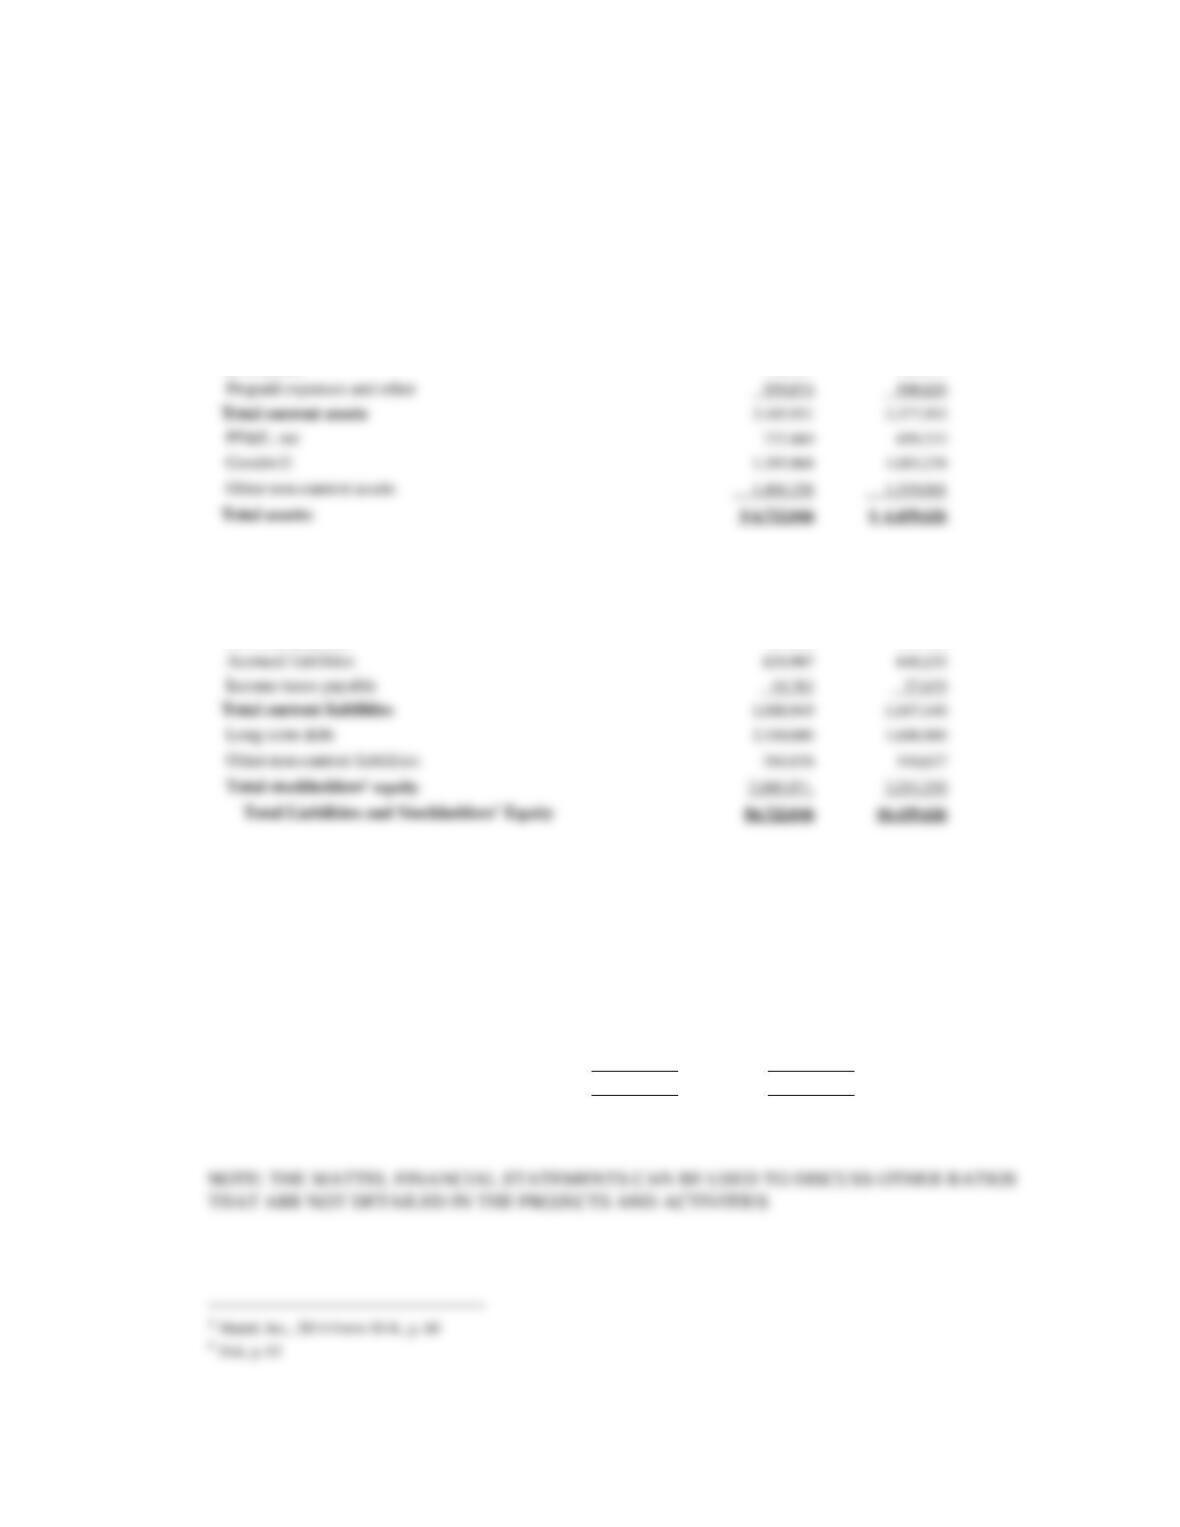
Mattel, Inc.
Consolidated Balance Sheet3
(Note – stockholders’ equity has been consolidated from the report for purposes of these exercises)
Assets: 2014 2013
Cash & cash equivalents
$ 971,650
$1,039,216
Accounts receivable, net
1,093,180
1,260,105
Inventories
562,047
568,843
Liabilities & Stockholders Equity:
Short-term borrowings
$ 0
$ 4,278
Accounts payable
430,259
375,328
Accrued liabilities
639,907
640,155
Income taxes payable
18,783
1,088,949
Long-term debt
Other non-current liabilities
584,026
2,949,071,
Consolidated Statement of Operations4
Mattel Computer Corporation
(Note- for purposes of these exercises, the income statement is shown only through gross profit)
2014 2013
Net sales
$ 6,023,819
$ 6,484,892
Cost of sales
3,022,797
3,006,009
Gross Profit
3,001,022
3,478,883
Prepaid expenses and other
559,074
509,829
Total current assets
3,377,993
PP&E, net
737,869
659,333
Goodwill
1,393,968
1,083,239
Other non-current assets
1,319,061
Total assets:
CHAPTER 13 FINANCIAL STATEMENT ANALYSIS
13–21
LO 6
Profitability Analysis
In-class assignment: Return on assets
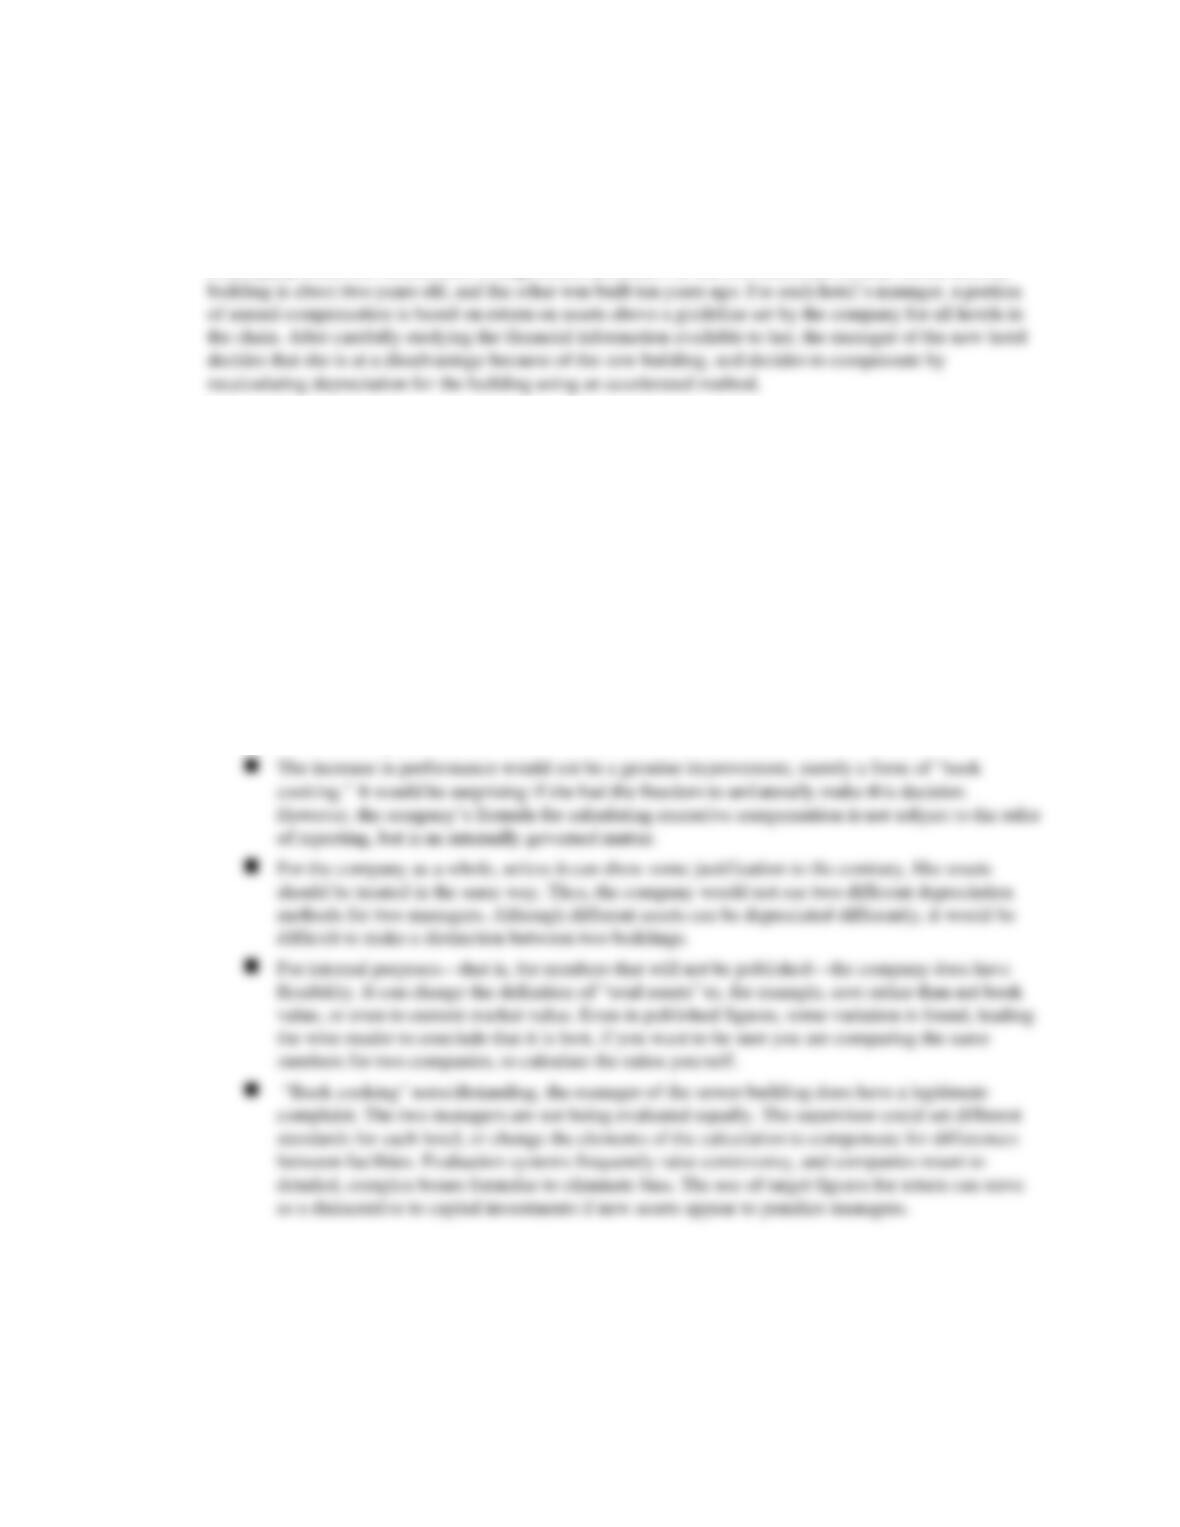
A company owns two hotels, both in large cities. Revenues for the two hotels are similar. However, one
◼ Why does the new building put this manager at a disadvantage relative to her compensation?
◼ Can depreciation be calculated differently for reporting and managerial evaluation? Why or why
not?
◼ What problem would this decision present for the company as a whole?
◼ Do you think that a company has any flexibility in how it calculates return on assets (or any ratio,
for that matter) for internal use?
◼ What would you, as the company officer who supervises both managers, suggest as a solution to
this problem?
Solution
◼ The manager of the new hotel is at a disadvantage because the net book value of her assets, which
will include the new building and fixtures, will be much higher than that of the older building.
Thus, for comparable net income, she will show a lower return on assets.