General Instructions
1. The following worksheet may be used to complete the exercise/problem.
You may need to refer to your textbook for additional information.
3. The completed exercise/problem may be printed or e-mailed per direction from your instructor.
E13-6
Kellogg’s General Mills
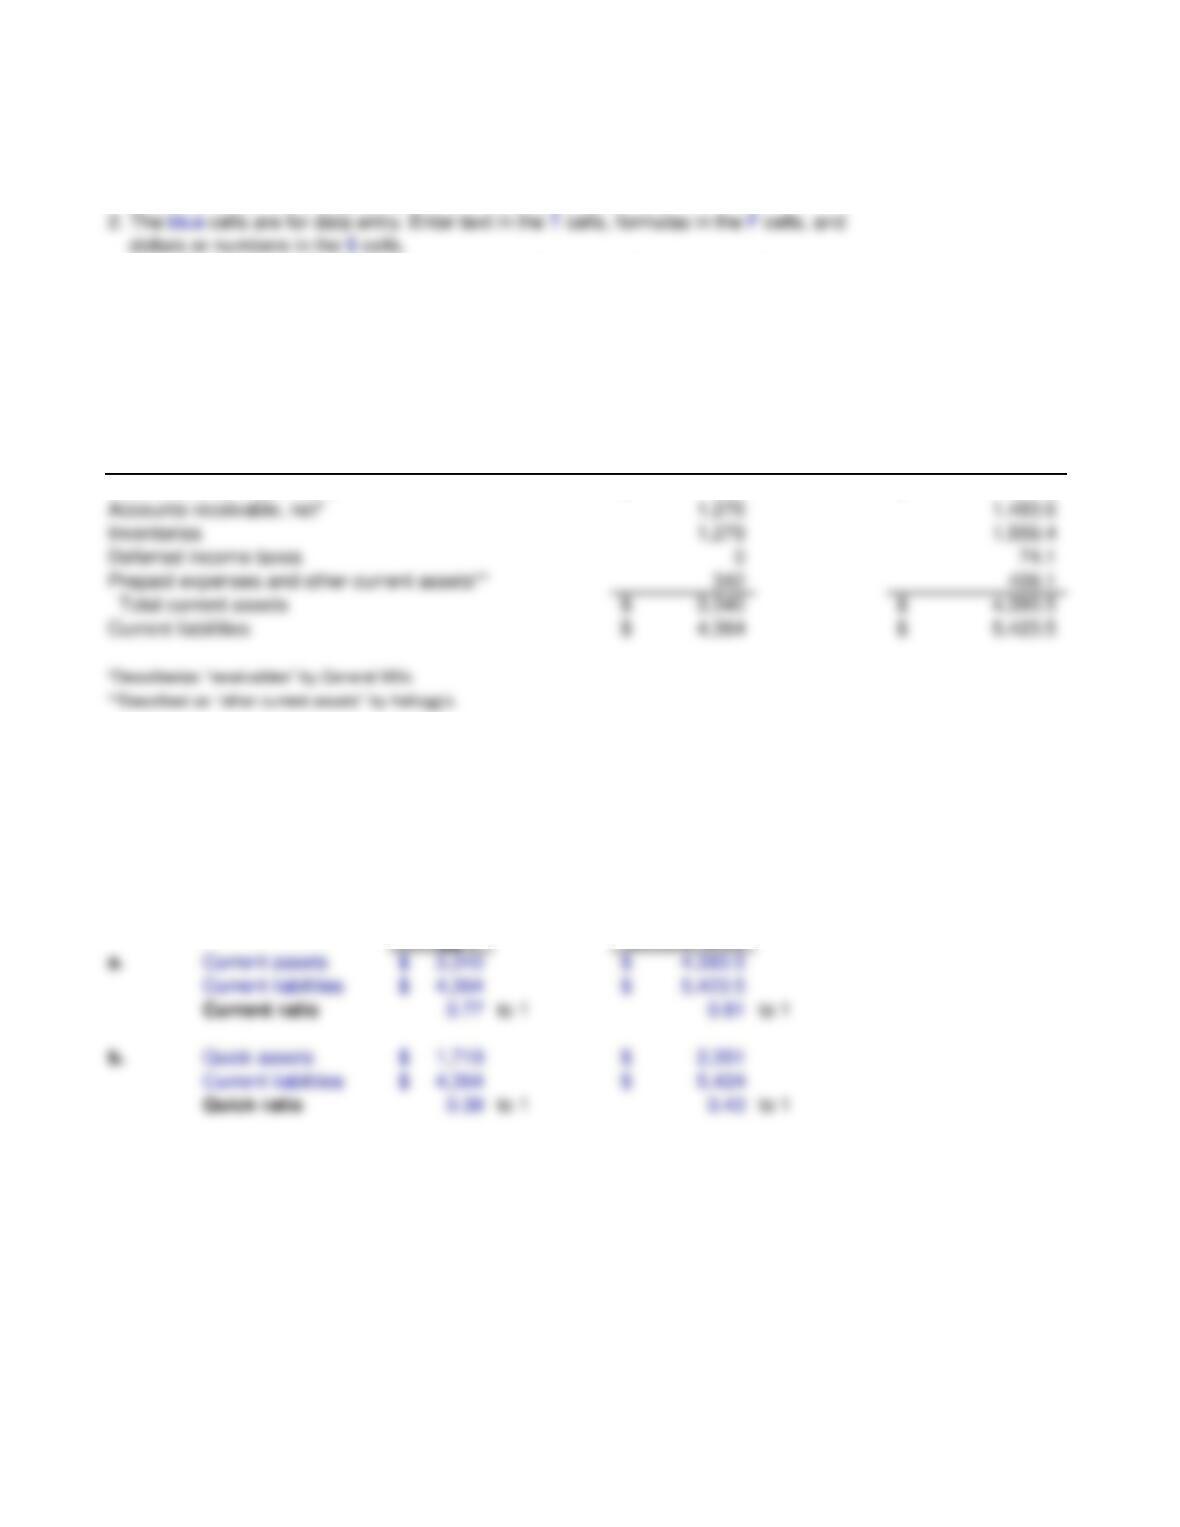
Accounts receivable, net*
Current liabilities
Deferred income taxes
Prepaid expenses and other current assets**
Total current assets
443$ 867.3$
Required
a. Current ratio
b. Quick ratio
Calculations (all dollar amounts in millions):
Kellogg’s General Mills
Current ratio
Quick ratio
The following information was summarized from the balance sheets included in the 2014 Form 10-K of
Kellogg Company and Subsidiaries at January 3, 2015, and General Mills, Inc., and Subsidiaries
at May 25, 2014:
(in millions)
1. Using the information provided, compute the following for each company at the
Cash and cash equivalents
end of 2014:
were $3,835 million and $5,293.9 million, respectively. Compute the cash flow from operations
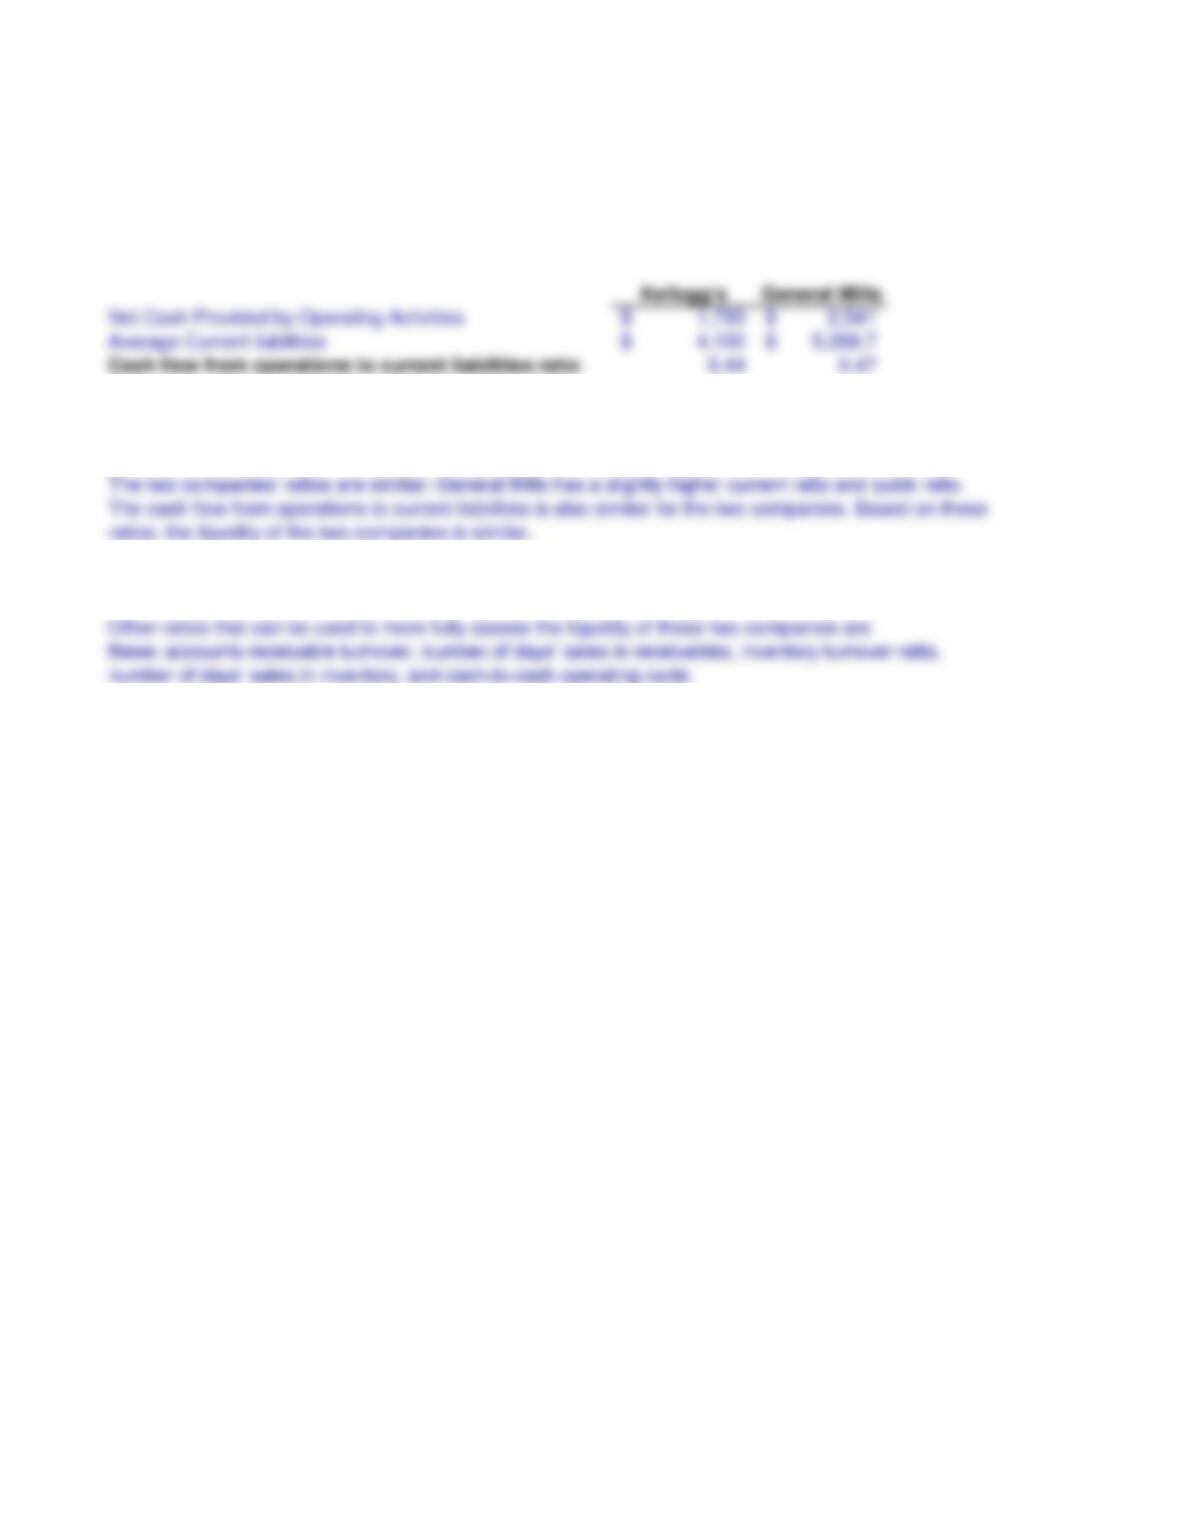
2. Kellogg’s reported net cash provided by operating activities of $1,793 million during 2014.
General Mills reported net cash provided by operating activities of $2,541.0 million. Current
to current liabilities ratio for each company for 2014.
liabilities reported by Kellogg’s at December 28, 2013, and General Mills at May 26, 2013,
4. What other ratios would help you more fully assess the liquidity of these companies?
3. Comment briefly on the liquidity of each of these two companies. Which appears
to be more liquid?
Cash flow from operations to current liabilities ratio
General Instructions
2. The blue cells are for data entry. Enter text in T cells, formulas in F cells, percentages in % cells,
and dollars or numbers in the $ cells.
P13-4A
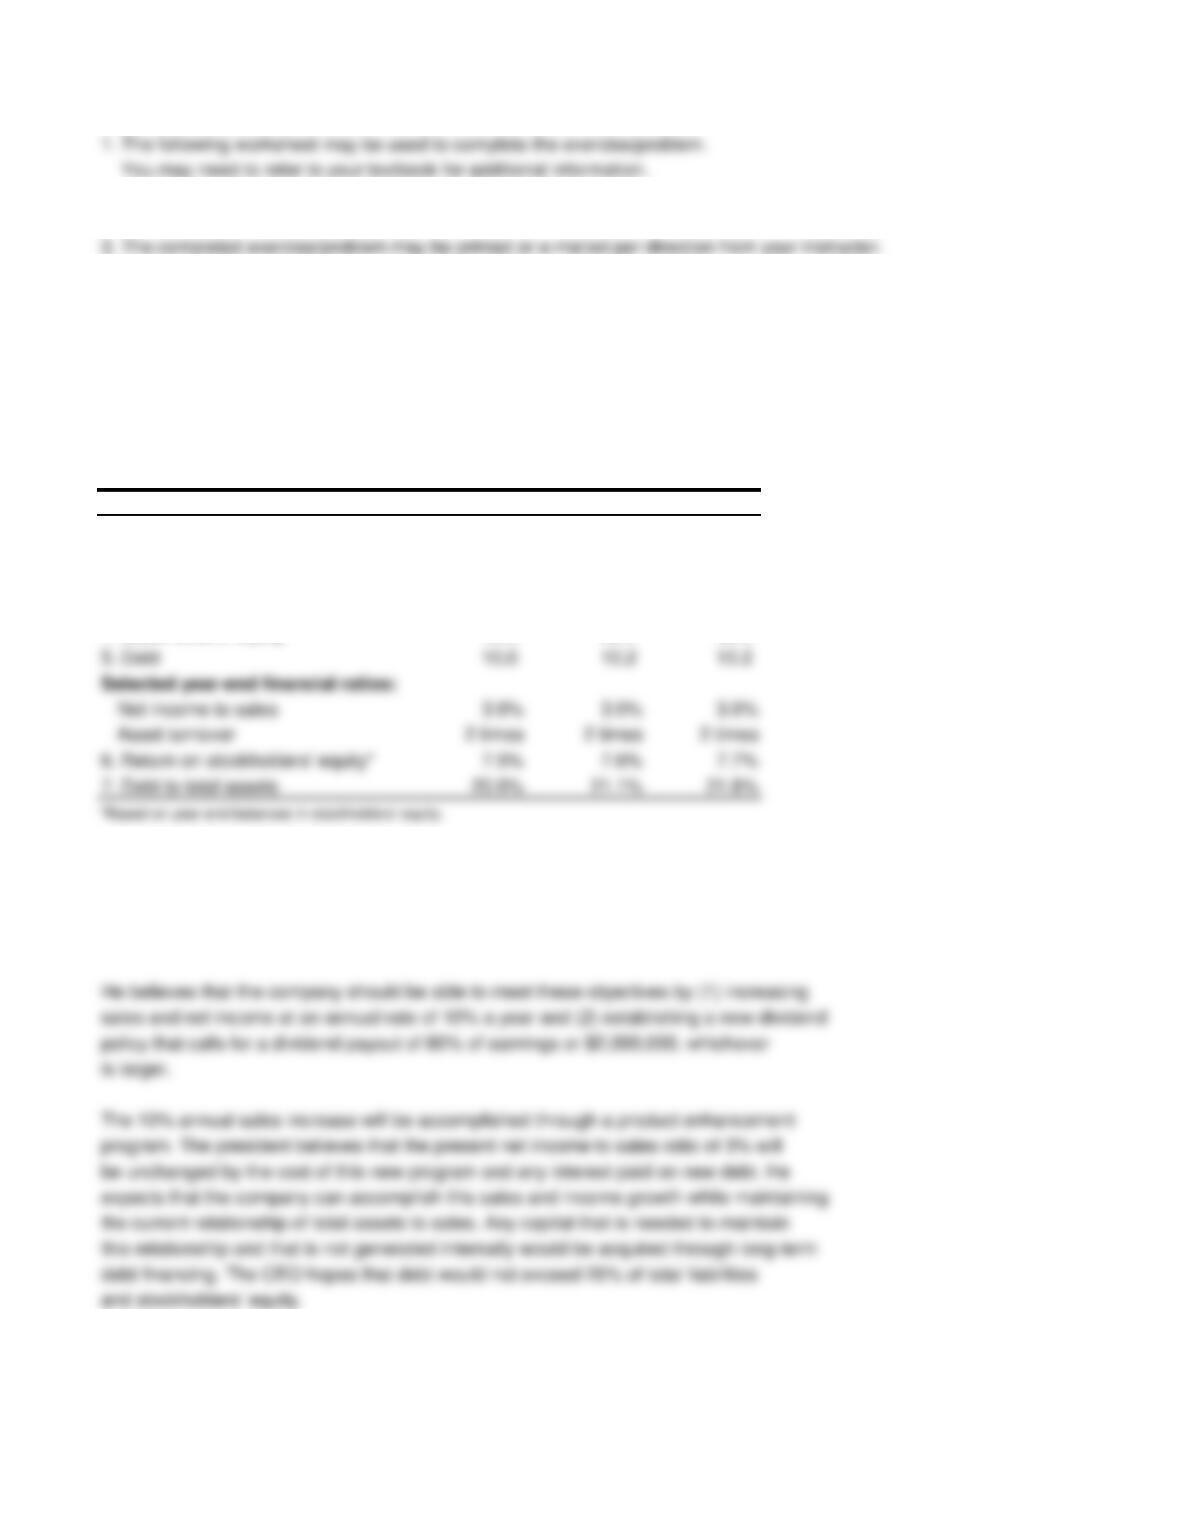
2016 2015 2014
1. Sales 100.0$ 96.7$ 93.3$
2. Net income 3.0 2.9 2.8
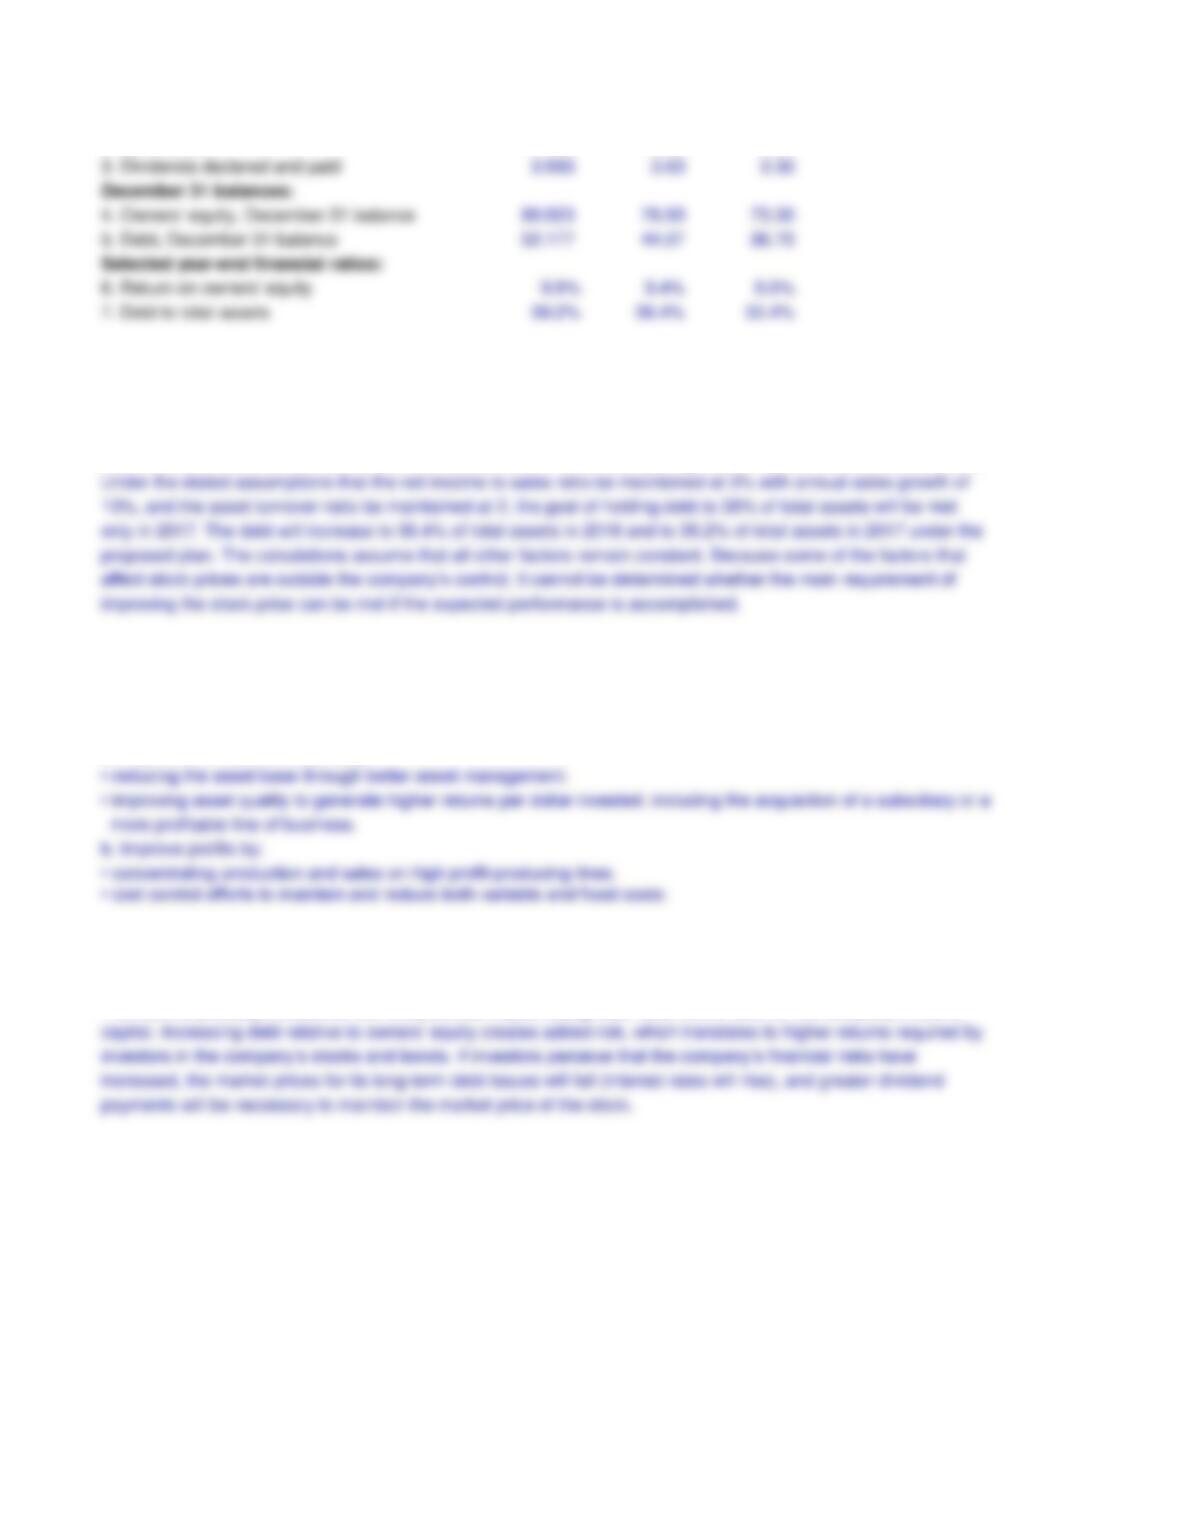
3. Dividends declared and paid 1.2 1.2 1.2
December 31 balances:
4. Stockholders‘ equity 40.0 38.2 36.5
Required
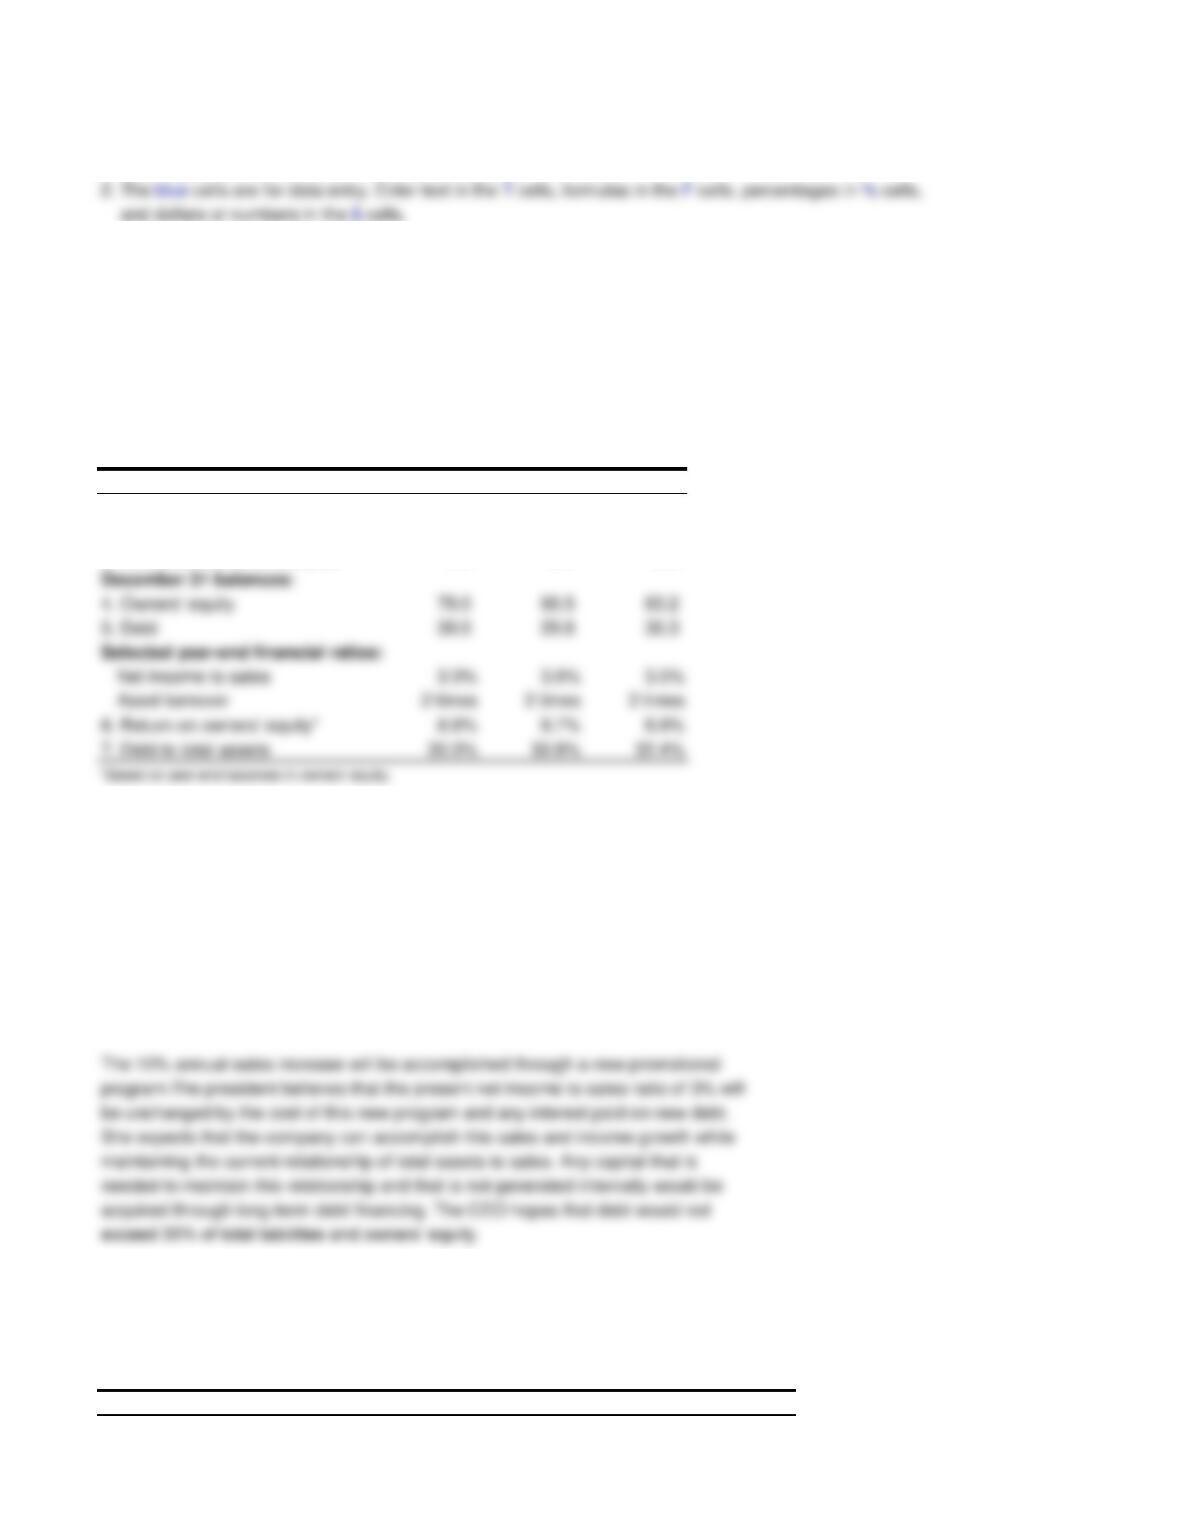
the current relationship of total assets to sales. Any capital that is needed to maintain
this relationship and that is not generated internally would be acquired through long-term
debt financing. The CEO hopes that debt would not exceed 25% of total liabilities
policy that calls for a dividend payout of 60% of earnings or $2,000,000, whichever
is larger.
program. The president believes that the present net income to sales ratio of 3% will
be unchanged by the cost of this new program and any interest paid on new debt. He
expects that the company can accomplish this sales and income growth while maintaining
He believes that the company should be able to meet these objectives by (1) increasing
sales and net income at an annual rate of 10% a year and (2) establishing a new dividend
1. Using the CEO’s program, prepare a schedule that shows the appropriate data
for the years 2017, 2018, and 2019 for the items numbered 1 through 7 on the
The CEO believes that the price of the stock has been adversely affected by the
downward trend of the return on equity, the relatively low dividend payout ratio, and
the lack of dividend increases. To improve the price of the stock, he wants to improve
the return on equity and dividends.
Sunset Corp. is a major regional retailer. The chief executive officer (CEO) is concerned
with the slow growth both of sales and of net income and the subsequent effect on
the trading price of the common stock. Selected financial data for the past three years
follow.
Sunset Corp. (in millions)
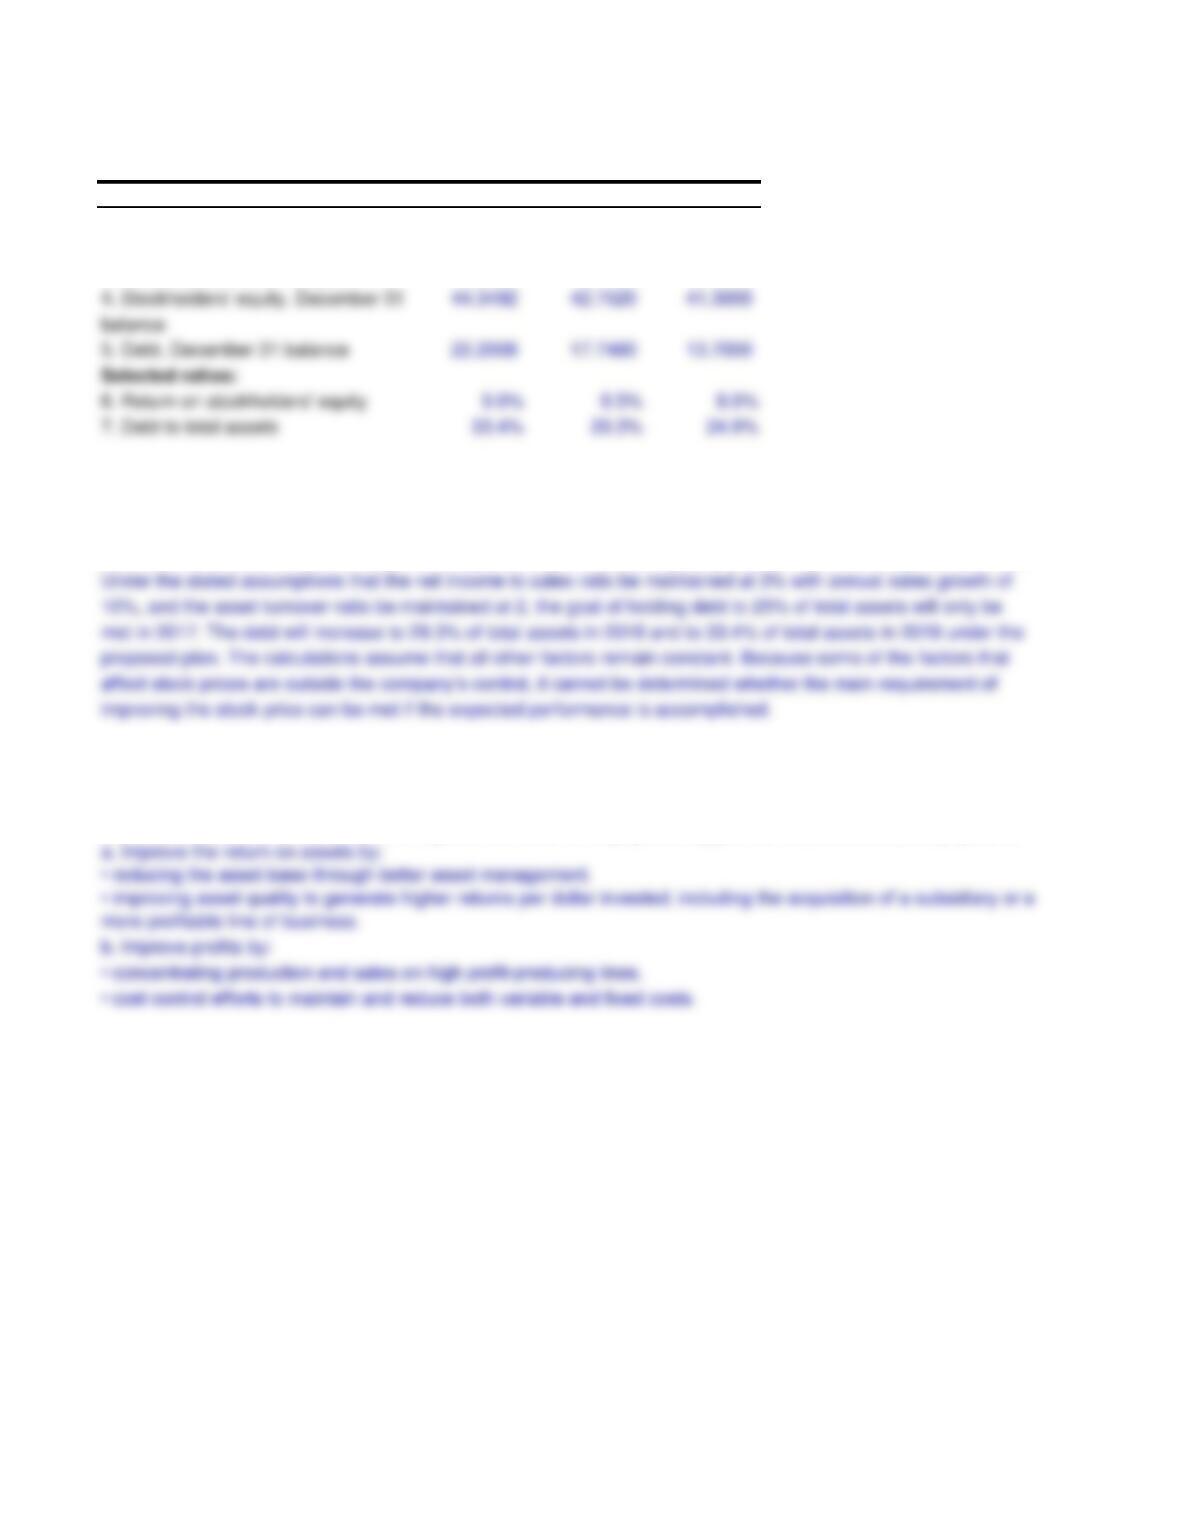
a. Improve the return on assets by:
more profitable line of business.
2019 2018 2017
1. Sales 133.1000$ 121.0000$ 110.0000$
2. Net income 3.9930 3.6300 3.3000
3. Dividends declared and paid 2.3958 2.1780 2.0000
to support increased dividend payments?
Alternative actions to be considered to improve the return on equity and support the increased dividend payments:
10%, and the asset turnover ratio be maintained at 2, the goal of holding debt to 25% of total assets will only be
met in 2017. The debt will increase to 29.3% of total assets in 2018 and to 33.4% of total assets in 2019 under the
proposed plan. The calculations assume that all other factors remain constant. Because some of the factors that
improving the stock price can be met if the expected performance is accomplished.
Under the stated assumptions that the net income to sales ratio be maintained at 3% with annual sales growth of
3. What alternative actions should the CEO consider to improve the return on equity and
preceding schedule.
Sunset Corp. (in millions)
2. Can the CEO meet all of his requirements if a 10% per-year growth in income and
sales is achieved? Explain your answers.
No, the CEO will not be able to meet all his requirements if a 10% per-year growth in income and sales is achieved.
General Instructions
1. The following worksheet may be used to complete the exercise/problem.
You may need to refer to your textbook for additional information.
3. The completed exercise/problem may be printed or e-mailed per direction from your instructor.
P13-4
2019 2018 2017
1. Sales 200.0$ 192.5$ 187.0$
2. Net income 6.0 5.8 5.6
3. Dividends declared and paid 2.5 2.5 2.5
Required
2019 2018 2017
Sunrise Corp. (in millions)
maintaining the current relationship of total assets to sales. Any capital that is
needed to maintain this relationship and that is not generated internally would be
The 10% annual sales increase will be accomplished through a new promotional
program.The president believes that the present net income to sales ratio of 3% will
be unchanged by the cost of this new program and any interest paid on new debt.
She expects that the company can accomplish this sales and income growth while
1. Using the CEO’s program, prepare a schedule that shows the appropriate data for the years 2017, 2018,
and 2019 for the items numbered 1 through 7 on the preceding schedule.
(2) establishing a new dividend policy that calls for a dividend payout of 50% of
earnings or $3,000,000, whichever is larger.
The CEO believes that the price of the stock has been adversely affected by the
downward trend of the return on equity, the relatively low dividend payout ratio, and
the lack of dividend increases. To improve the price of the stock, she wants to
improve the return on equity and dividends.
She believes that the company should be able to meet these objectives by
(1) increasing sales and net income at an annual rate of 10% a year and
Sunrise Corp. is a major regional retailer. The chief executive officer (CEO) is
concerned with the slow growth both of sales and of net income and the subsequent
effect on the trading price of the common stock. Selected financial data for the past
three years follow.
Sunrise Corp. (in millions)
1. Sales 266.200$ 242.00$ 220.00$
2. Net income 7.986 7.26 6.60
investors in the company’s stocks and bonds. If investors perceive that the company’s financial risks have
increased, the market prices for its long-term debt issues will fall (interest rates will rise), and greater dividend
payments will be necessary to maintain the market price of the stock.
capital. Increasing debt relative to owners’ equity creates added risk, which translates to higher returns required by
• concentrating production and sales on high profit-producing lines.
• cost control efforts to maintain and reduce both variable and fixed costs:
more profitable line of business.
b. Improve profits by:
4. Explain the reasons that the CEO might have for wanting to limit debt to 35% of total liabilities and
owners’ equity.
The CEO is probably concerned with the potential impact that greater debt would have on the company’s cost of
Alternative actions to be considered to improve the return on equity and support the increased dividend payments:
a. Improve the return on assets by:
only in 2017. The debt will increase to 36.4% of total assets in 2018 and to 39.2% of total assets in 2017 under the
proposed plan. The calculations assume that all other factors remain constant. Because some of the factors that
affect stock prices are outside the company’s control, it cannot be determined whether the main requirement of
improving the stock price can be met if the expected performance is accomplished.
Under the stated assumptions that the net income to sales ratio be maintained at 3% with annual sales growth of
10%, and the asset turnover ratio be maintained at 2, the goal of holding debt to 35% of total assets will be met
3. What alternative actions should the CEO consider to improve the return on equity and to support
increased dividend payments?
2. Can the CEO meet all of her requirements if a 10% per-year growth in income and sales is achieved?
Explain your answer.
No, the CEO will not be able to meet all her requirements if a 10% per-year growth in income and sales is achieved
General Instructions
1. The following worksheet may be used to complete the exercise/problem.
You may need to refer to your textbook for additional information.
3. The completed exercise/problem may be printed or e-mailed per direction from your instructor.
P13-5A
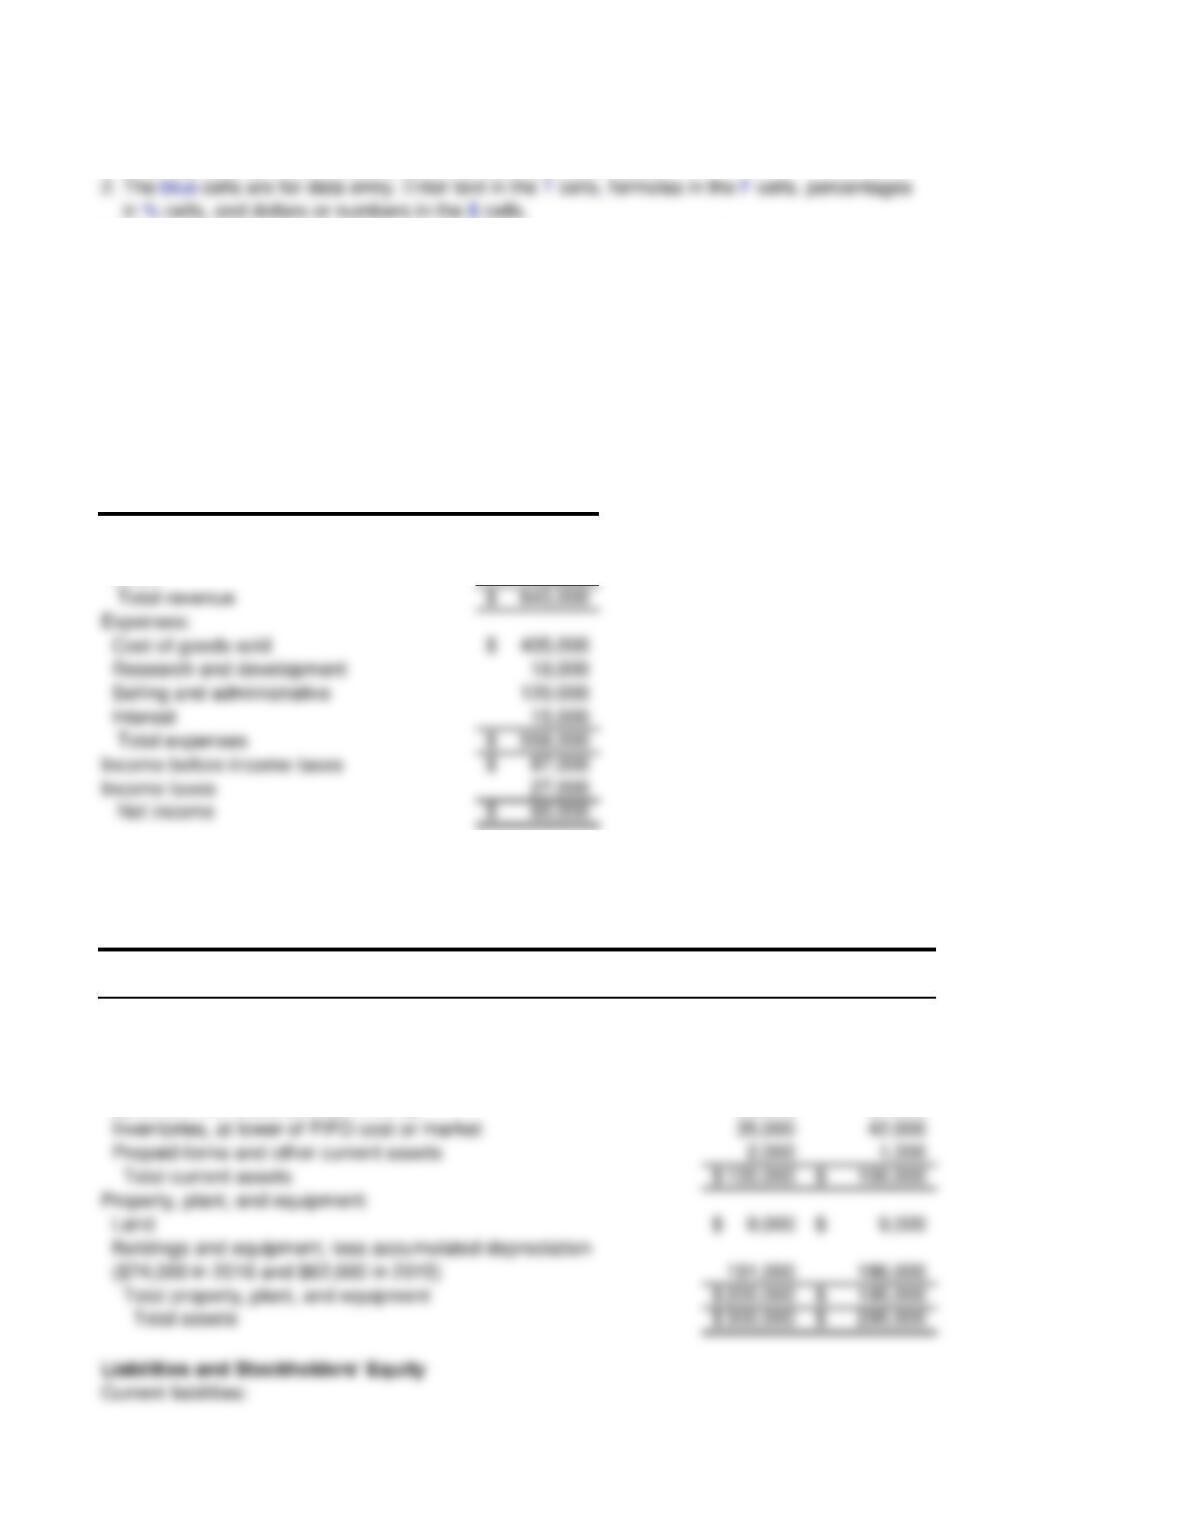
Income taxes
Cost of goods sold
Research and development
Selling and administrative
Interest
Total expenses
Income before income taxes
Total revenue
Expenses:
600,000$
45,000
2016 2015
Total property, plant, and equipment
Current liabilities:
Prepaid items and other current assets
Total current assets
Property, plant, and equipment:
Buildings and equipment, less accumulated depreciation
($74,000 in 2016 and $62,000 in 2015)
Inventories, at lower of FIFO cost or market
27,000$ 20,000$
36,000 37,000
Assets
Current assets:
Cash and short-term investments
Receivables, less allowance for doubtful accounts
($1,100 in 2016 and $1,400 in 2015)
SST Enterprises
Comparative Statements of Financial Position
December 31, 2016 and 2015
(thousands omitted)
(thousands omitted)
Revenue:
Net sales
Other
The accounting staff of SST Enterprises has completed the financial statements for the
2016 calendar year. The statement of income for the current year and the comparative
statements of financial position for 2016 and 2015 follow.
SST Enterprises
Statement of Income
Year Ended December 31, 2016
20,000$ 15,000$
80,000 68,000
5,000 7,000
105,000$ 90,000$
Required
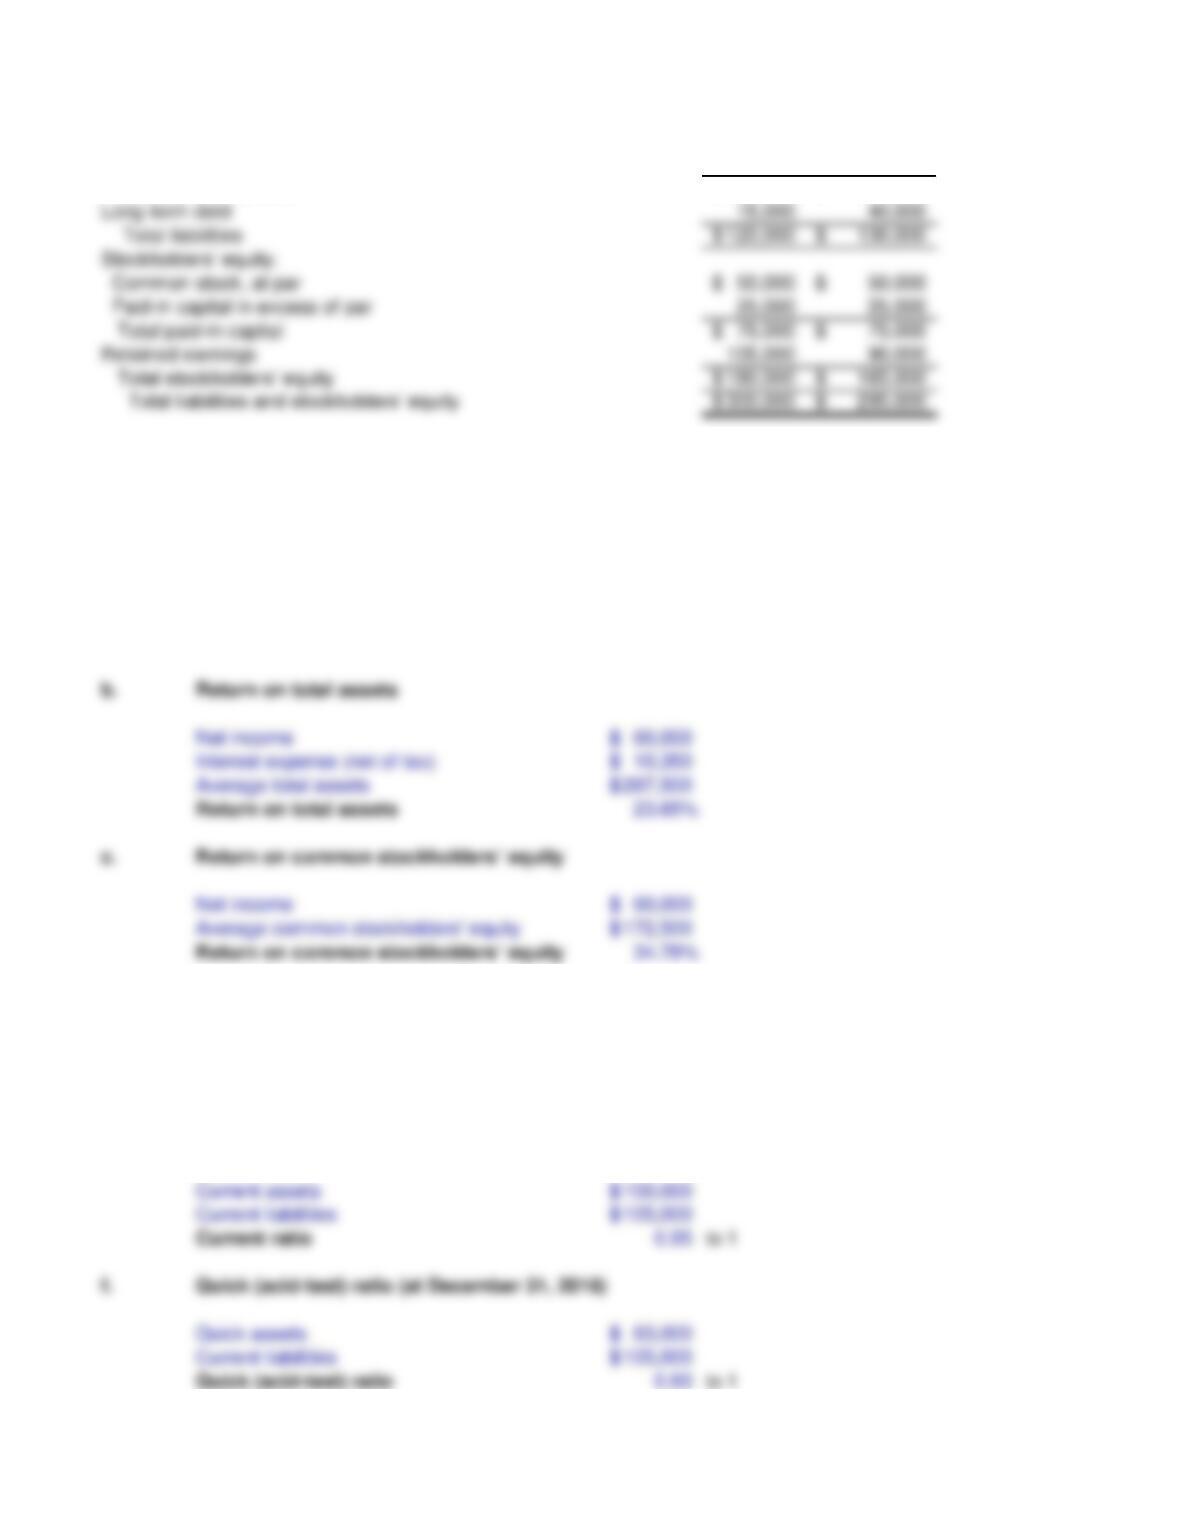
a.
60,000$
15,000$
27,000$
6.80 times
b.
60,000$
23.65%
c.
60,000$
34.78%
Average common stockholders’ equity
Net income
Interest expense (net of tax)
Average total assets
Return on total assets
Net income
Return on total assets
d.
120,000$
180,000$
0.67 to 1
e.
100,000$
0.95 to 1
63,000$
0.60 to 1
Current liabilities
Quick (acid-test) ratio
Current assets
Current liabilities
Current ratio
Quick (acid-test) ratio (at December 31, 2016)
Quick assets
Current ratio (at December 31, 2016)
Debt-to-equity ratio (at December 31, 2016)
Total liabilities
Total stockholders’ equity
Debt-to-equity ratio
Times interest earned
Net income
Interest expense
Income tax expense
Times interest earned
1. Calculate the following financial ratios for 2016 for SST Enterprises:
Salaries, wages, and other
Total current liabilities
Short-term loans
Accounts payable
Paid-in capital in excess of par
Total paid-in capital
Retained earnings
Long-term debt
Total liabilities
Common stock, at par
16.44 times
h.
16.44
22 days
i
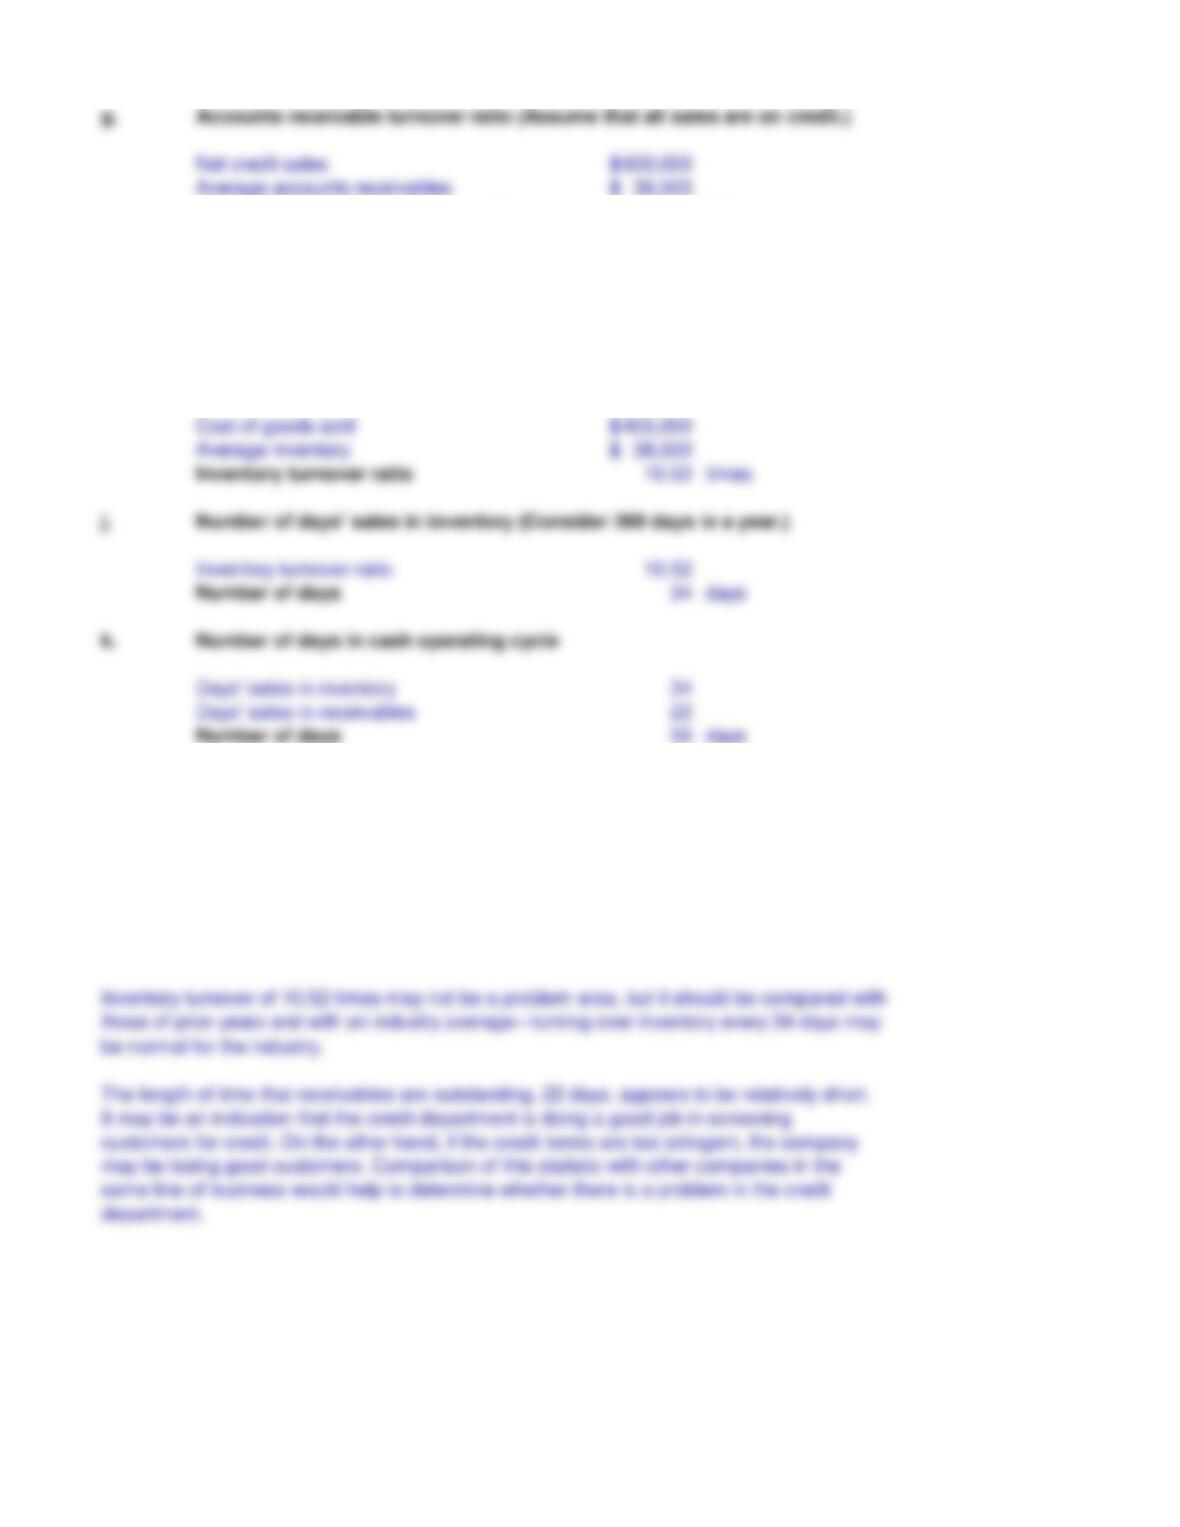
10.52
34 days
34
56 days
Days‘ sales in receivables
Number of days
Number of days’ sales in inventory (Consider 360 days in a year.)
Inventory turnover ratio
Number of days
Number of days in cash operating cycle
Days‘ sales in inventory
Cost of goods sold
Average inventory
The company appears to be successfully using outside capital, as is evidenced by a
return on assets of 23.65% but a much higher return on stockholders’ equity of 34.78%.
Further evidence of the company’s use of leverage could be found by examining the exact
cost of each individual source of capital. For example, what are the terms of the
instruments that make up long-term debt and what is the effective interest cost of each?
The times interest earned ratio indicates that earnings are nearly seven times the amount
The length of time that receivables are outstanding, 22 days, appears to be relatively short.
customers for credit. On the other hand, if the credit terms are too stringent, the company
may be losing good customers. Comparison of this statistic with other companies in the
same line of business would help to determine whether there is a problem in the credit
Inventory turnover of 10.52 times may not be a problem area, but it should be compared with
be normal for the industry.
signal a problem with excess inventory. Whether or not the quick ratio is indicative of a
liquidity problem could be determined more accurately by comparing this ratio with
those of prior years, as well as with an industry average
2. Prepare a few brief comments on the overall financial health of SST Enterprises.
For each comment, indicate any information that is not provided in the problem
that you would need to fully evaluate the company’s financial health.
The current ratio is slightly less than 1 to 1, and the significantly smaller quick ratio may
Number of days’ sales in receivables (Consider 360 days in a year.)
Accounts receivable turnover ratio
Number of days
Inventory turnover ratio (Assume that all purchases are on credit.)
Accounts receivable turnover ratio
g.
Accounts receivable turnover ratio (Assume that all sales are on credit.)
Net credit sales
Average accounts receivables