13-1
Chapter 13
________
Financial Statement
Analysis
After studying this chapter, students should be able to:
◼ Explain the various limitations and considerations in financial statement analysis
(Module 1–LO1).
INSTRUCTOR’S MANUAL
13-2
Chapter Outline
MODULE 1 HORIZONTAL AND VERTICAL ANALYSIS
Module 1
LO 1
Horizontal and Vertical Analysis
◼ Various groups have different purposes for analyzing a company’s financial statements. Certain
ratios are helpful to each group.
• Banker interested in the likelihood that a loan will be repaid.
• Stockholder is concerned with a fair return on amount invested.
Watch for Alternative Accounting Principles
◼ Every set of financial statements is based on various assumptions.
• Different cost flow assumptions for inventory and cost of goods sold.
• Users can find this information in the financial statement notes.
Take Care When Making Comparisons
◼ No single ratio can tell a reader everything they need to know about the company.
◼ Compare ratios for different periods of time.
CHAPTER 13 FINANCIAL STATEMENT ANALYSIS
• Comparison with industry standards.
• Few companies today operate in a single industry. This can present challenges to the analyst.
Understand the Possible Effects of Inflation
Inflation, or an increase in the level of prices, is another important consideration in analyzing financial
statements.
Module 1
LO 2
Analysis of Comparative Statements: Horizontal Analysis
◼ Horizontal analysis is a comparison of financial statement items over a period of time (Examples
13-1, 13-2, and 13-3).
◼ Vertical analysis is a comparison of various financial statement items within a single period with
the use of common size statement.
◼ When performing horizontal analysis:
• The increase or decrease in each of the major accounts on the balance sheet are shown in
absolute dollars and as percentages of the base year.
• Horizontal analysis can be extended to include more than two year of results.
Publicly held companies are required to include income statements and statements of
cash flows for the three most recent years and balance sheets as of the end of the two
most recent years.
INSTRUCTOR’S MANUAL
13-4
Module 1
LO 3
Analysis of Common-Size Statements: Vertical Analysis
Common-size statements recast all items on the statement as a percentage of a selected item on the
statement. This excludes size as a relevant variable in the analysis.
◼ On the balance sheet, all assets are a percent of total assets; liability and equity accounts are each a
percent of total liabilities plus equity (Example 13–4).
◼ Allows comparison of multiple companies that are very different in size.
MODULE 2 LIQUIDITY ANALYSIS
Module 2
LO 4
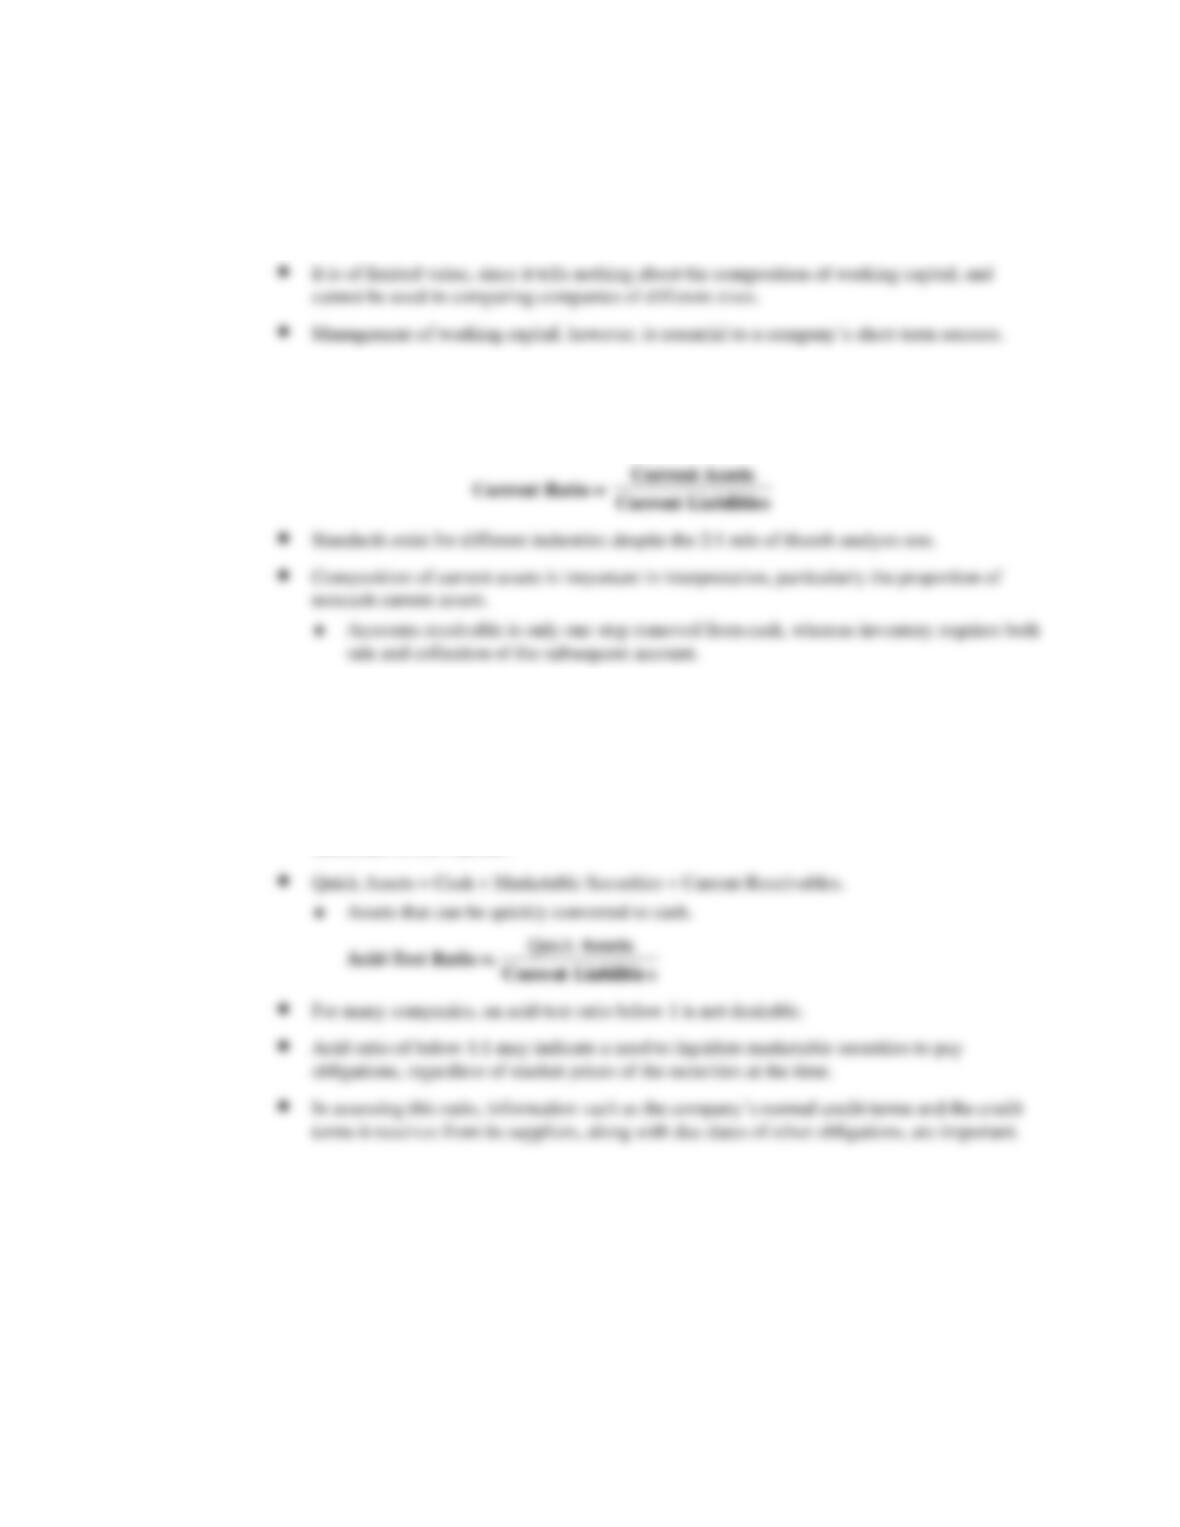
Liquidity Analysis
Ratios are classified in three main categories according to their use in performing (1) liquidity analysis,
(2) solvency analysis, and (3) profitability analysis.
◼ Liquidity is a measure of the nearness to cash of the various assets and liabilities of a company,
that is, the length of time before cash will be realized.
◼ Liquidity ratios are concerned with the company’s ability to pay its short-term debts as they come
due.
• Current assets are assets that will be converted into cash or consumed within one year or
within the operating cycle if the cycle is longer than one year.
CHAPTER 13 FINANCIAL STATEMENT ANALYSIS
13-5
Working Capital (Example 13-6)
◼ Working Capital = Current Assets less Current Liabilities at a point in time.
Current Ratio (Example 13-7)
◼ Current ratio is widely used to compare companies of different sizes:
Acid-Test Ratio (Example 13-8)
◼ Acid-test ratio, also known as quick ratio, is a stricter test of the ability to pay current debts as
they become due.
• Deals with the composition problem since it excludes inventory and prepaid assets from the
numerator of the fraction.
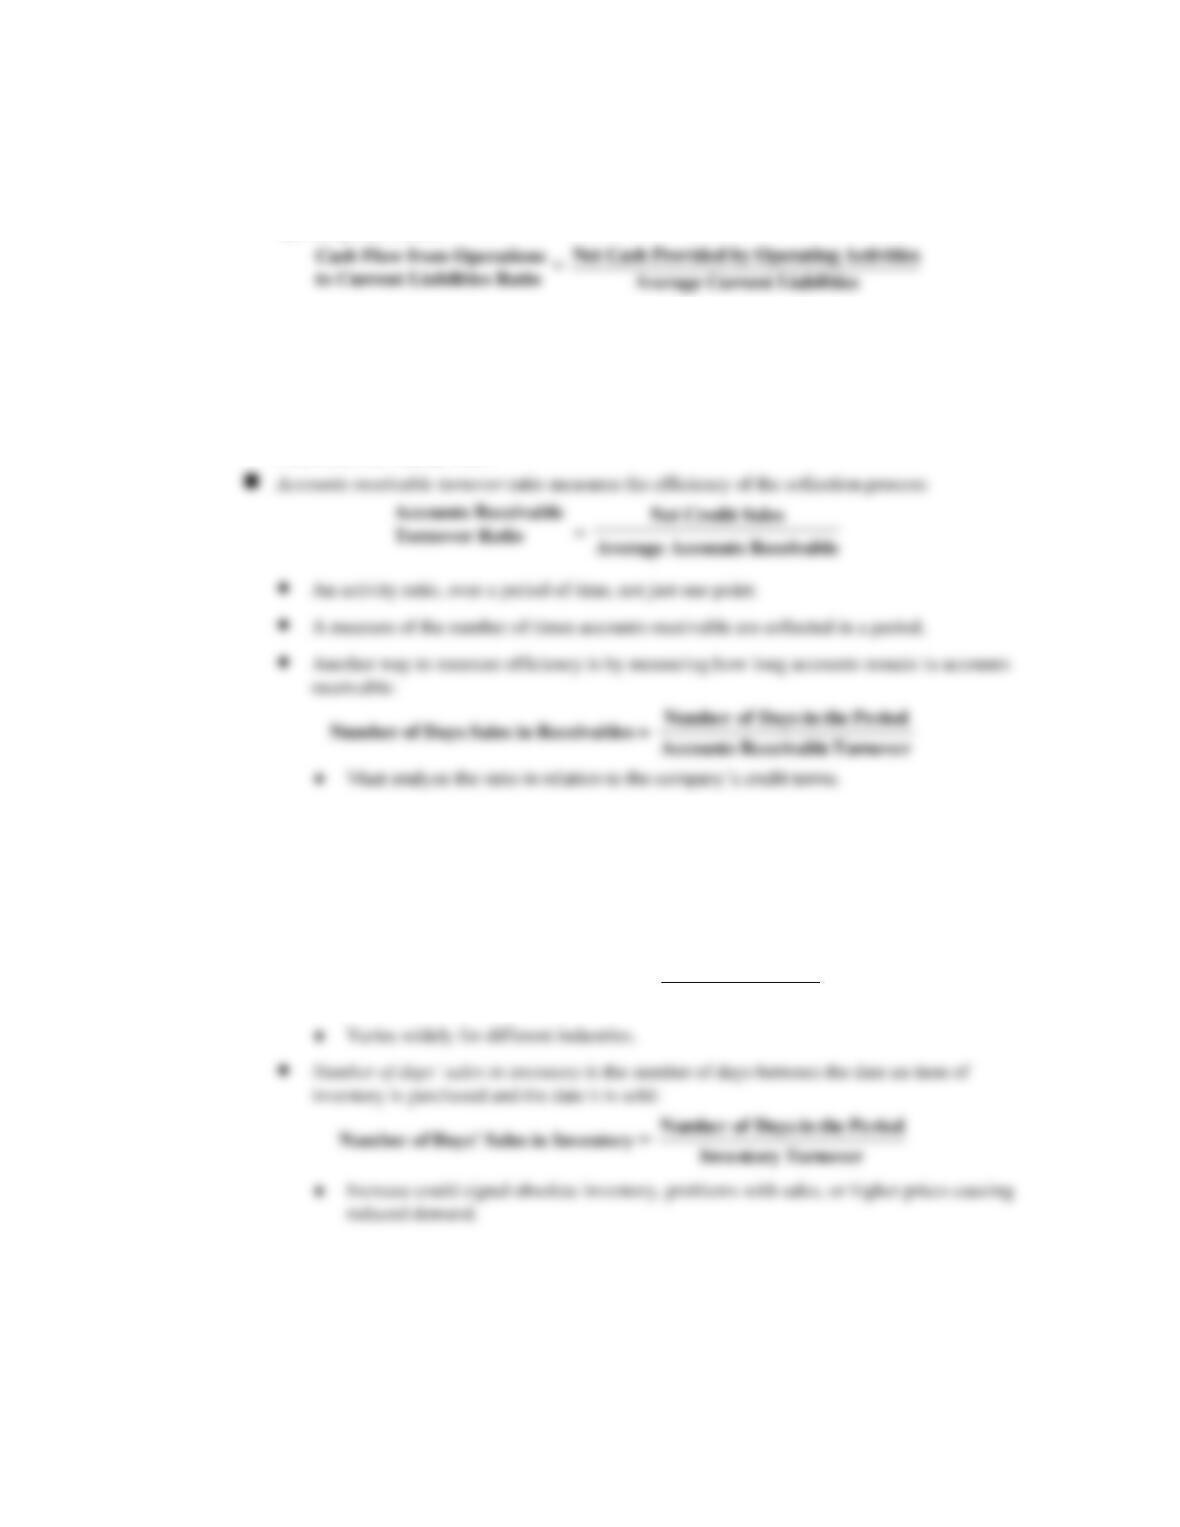
Cash Flow from Operations to Current Liabilities (Example 13-9)
◼ There are limitations of the current ratio and the quick ratio as a measure of liquidity:
• Almost all debts require payment in cash, thus a ratio that focuses on cash is more useful.
• Both ratios focus on liquid assets at a point in time.
INSTRUCTOR’S MANUAL
13-6
◼ Cash flow from operations to current liabilities ratio: since cash flow from operating activities
looks at cash flow over time, it can be used to measure the ability to pay current debts from
operating cash flows:
Accounts Receivable Analysis (Example 13-10)
◼ Company must be willing to extend credit terms that are liberal enough to attract and maintain
customers, but at the same time, management must continually monitor the accounts to ensure
collection on a timely basis.
Inventory Analysis (Example 13-11)
◼ Inventory can also be measured for efficiency of management.
• Inventory turnover measures number of times inventory is sold during a period:
Inventory Turnover Ratio =
Cost of Goods Sold
Average Inventory
CHAPTER 13 FINANCIAL STATEMENT ANALYSIS
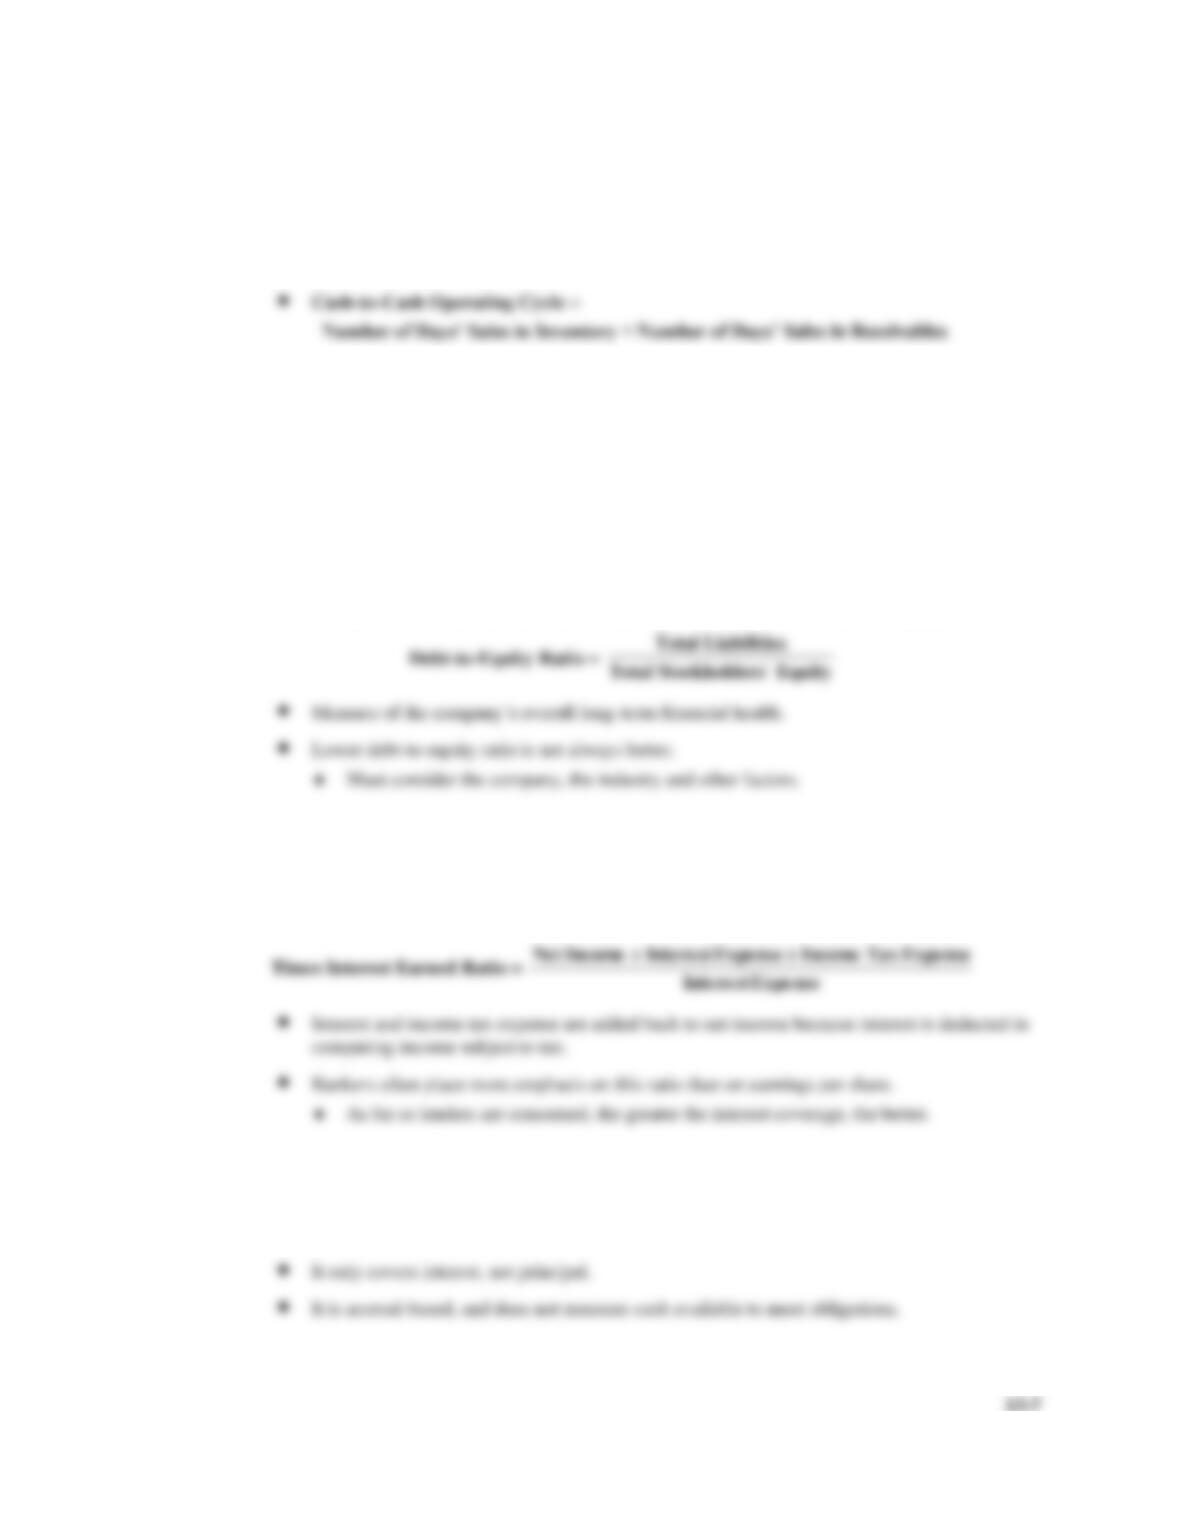
Cash Operating Cycle (Example 13-12)
◼ Cash-to-cash operating cycle is the length of time from the purchase of inventory to the collection
of any receivable from the sale.
Module 3
LO 5
Solvency Analysis
Solvency is the ability of a company to remain in business over the long term, and to remain financially
healthy over the period during which both long and short-term debt will be outstanding.
Debt-to-Equity Ratio (Example 13-13)
◼ Debt-to-equity ratio measures the relationship between total liabilities and total equity:
Times Interest Earned (Example 13-14)
◼ Times interest earned measures the ability to meet current-year interest payments from current
earnings:
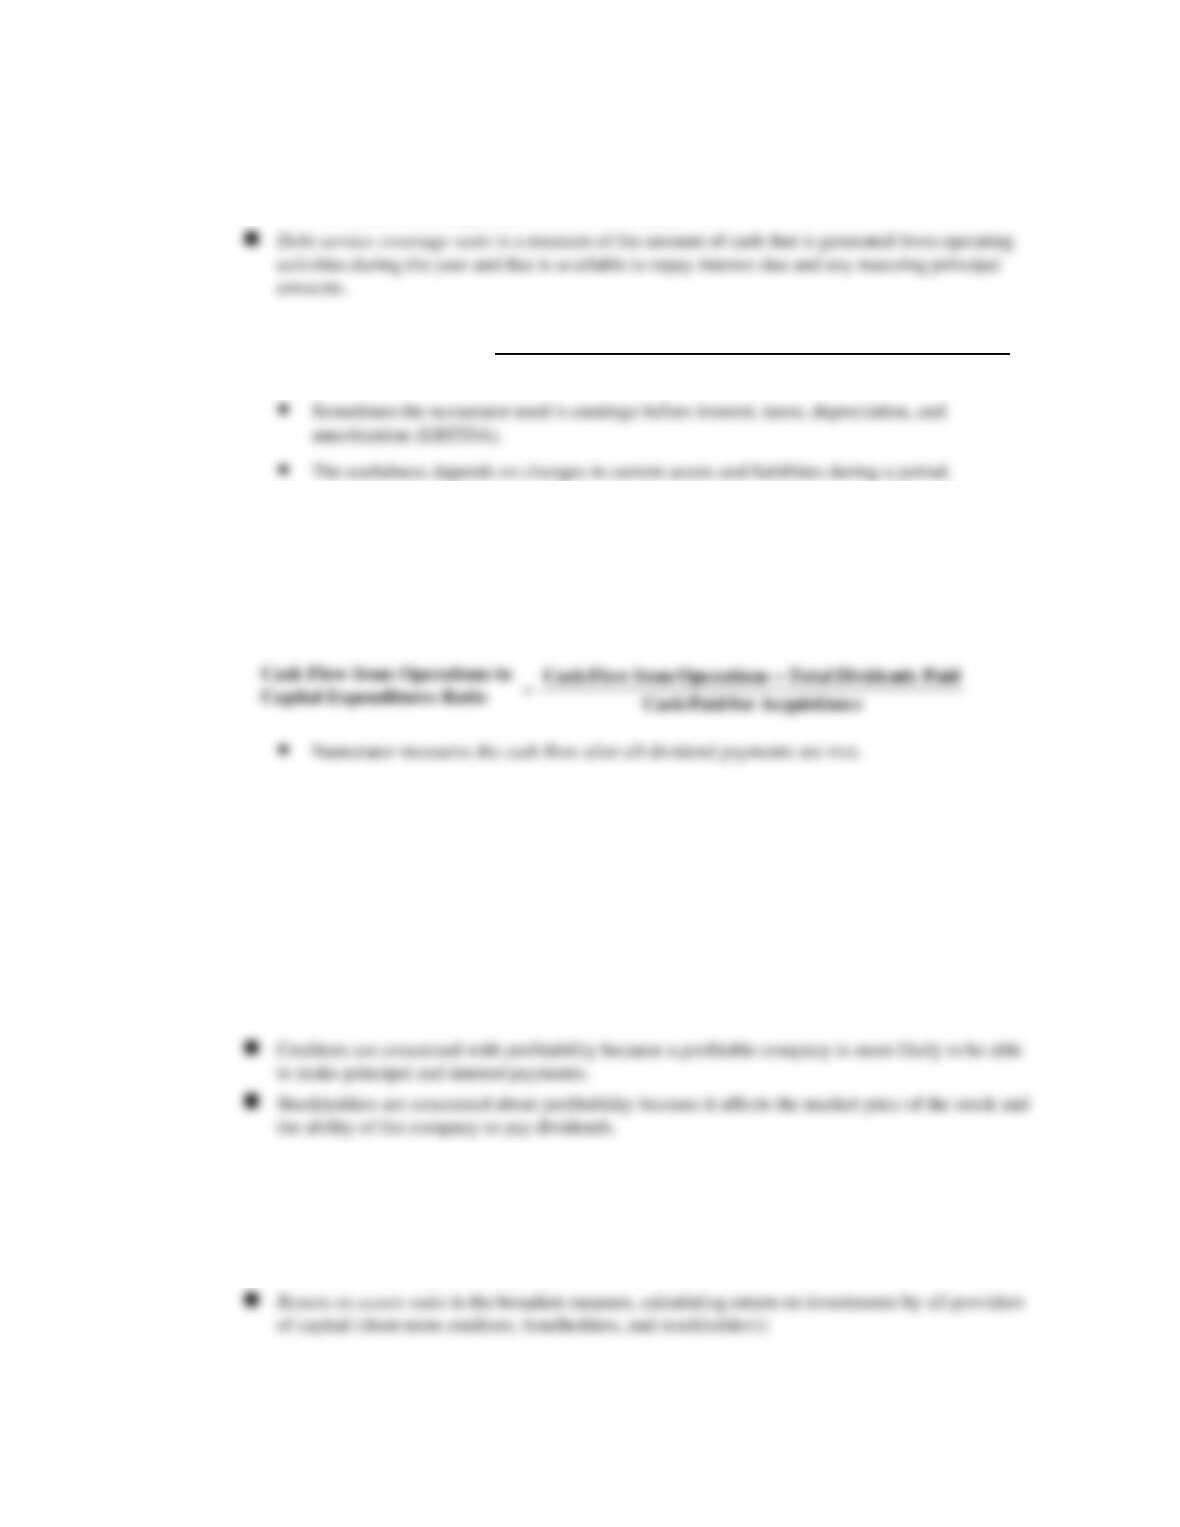
Debt Service Coverage (Example 13-15)
◼ There are limitations with the times interest earned ratio:
INSTRUCTOR’S MANUAL
13-8
• Numerator contains various noncash adjustments, such as depreciation, and denominator
measures interest expense, not cash interest payments.
Debt Service Coverage Ratio = Cash Flow from Operations Before Interest and Tax Payments
Interest and Principal Payments
Cash Flow from Operations to Capital Expenditures Ratio (Example 13-16)
◼ Cash flow from operations to capital expenditures ratio measures the ability of a company to
finance acquisitions of long-lived assets from operations:
MODULE 4 PROFITABILITY ANALYSIS
Module 4
LO 6
Profitability Analysis
Profitability measures management’s ability to use resources available to earn a return on funds invested by
various groups.
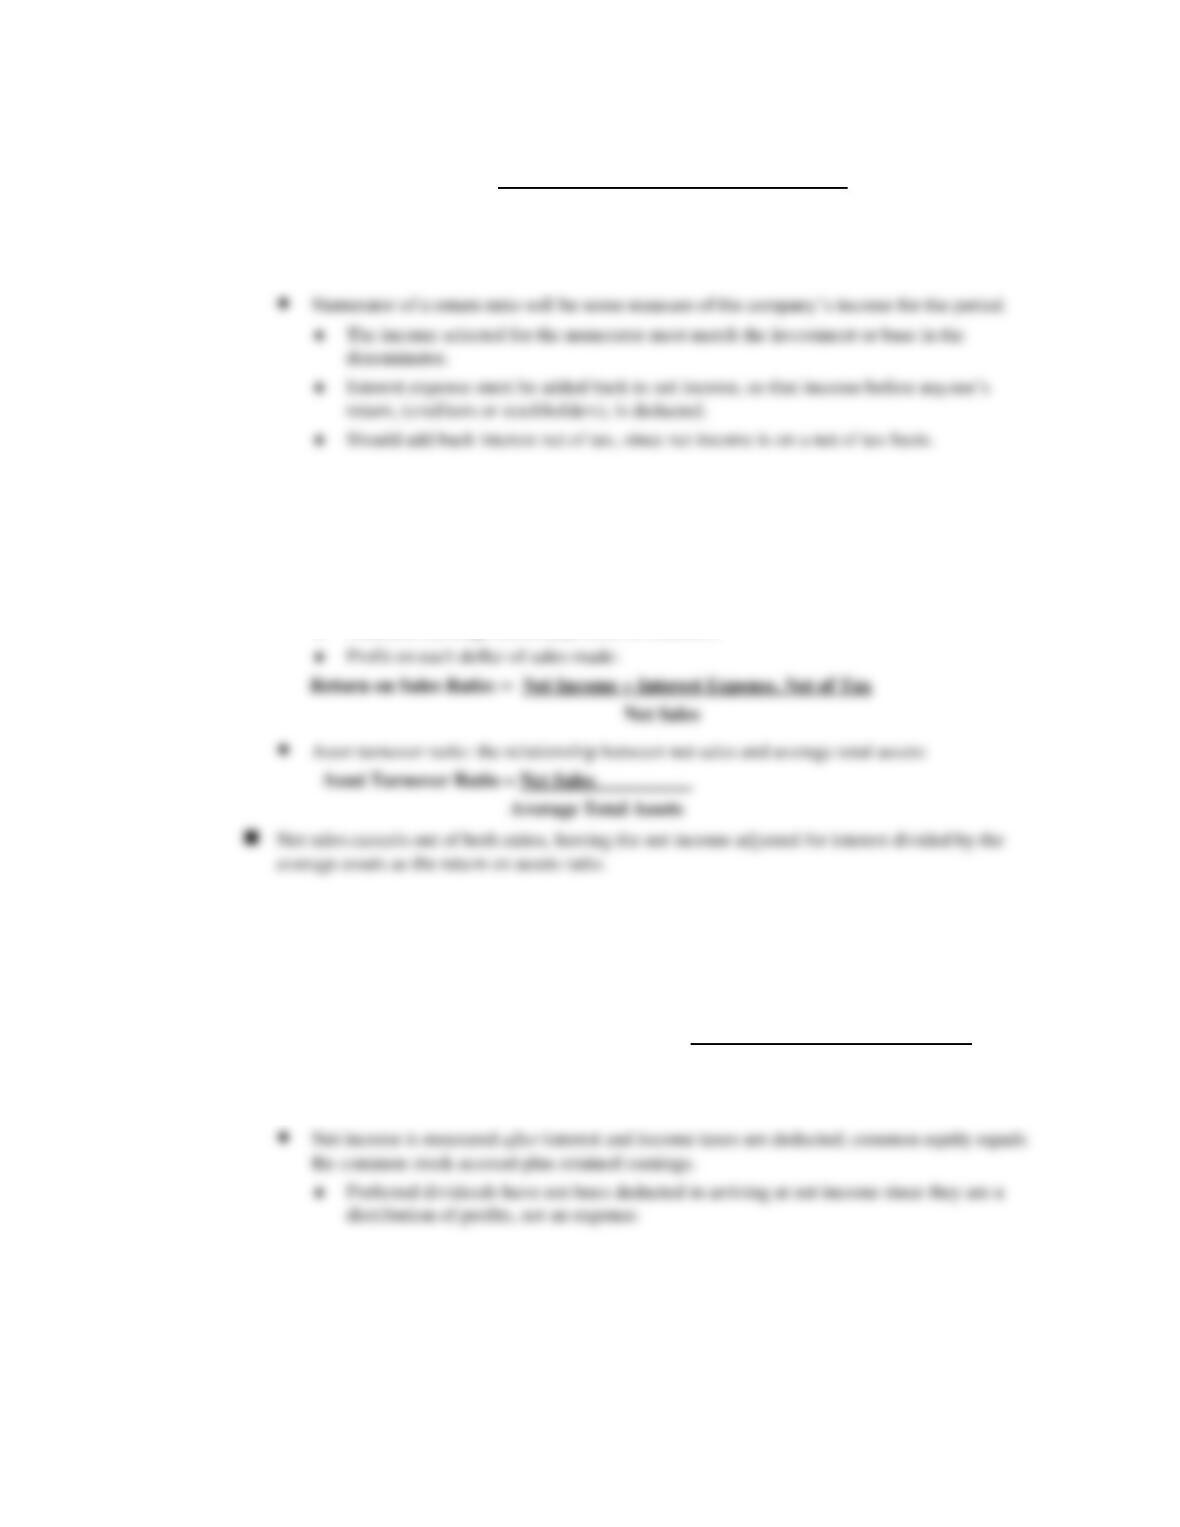
Rate of Return on Assets (Example 13-17)
◼ Every return ratio is a measure of the relationship between income earned by the company and
investments made by various groups.
CHAPTER 13 FINANCIAL STATEMENT ANALYSIS
13-9
Return on Assets Ratio: = Net Income + Interest Expense, Net of Tax
Average Total Assets
• Denominator is average total assets, which is the same as average total liabilities and
stockholders’ equity.
Components of Return on Assets (Examples 13-18 and 13-19)
◼ Two components make up the return on assets ratio – return on sales ratio and asset turnover ratio.
• Return on sales ratio:
Measures earnings before payments to creditors.
Return on Common Stockholders’ Equity (Example 13-20)
◼ Return on common stockholders’ equity measures the return to common stockholders, after the
debt return is accounted for:
Return on Common Stockholders’ Equity Ratio = Net Income – Preferred Dividends
Average Common Stockholders’ Equity
• A measure of a company’s success in earning a return for the common stockholders.
Return on Assets, Return on Equity, and Leverage
INSTRUCTOR’S MANUAL
13–10
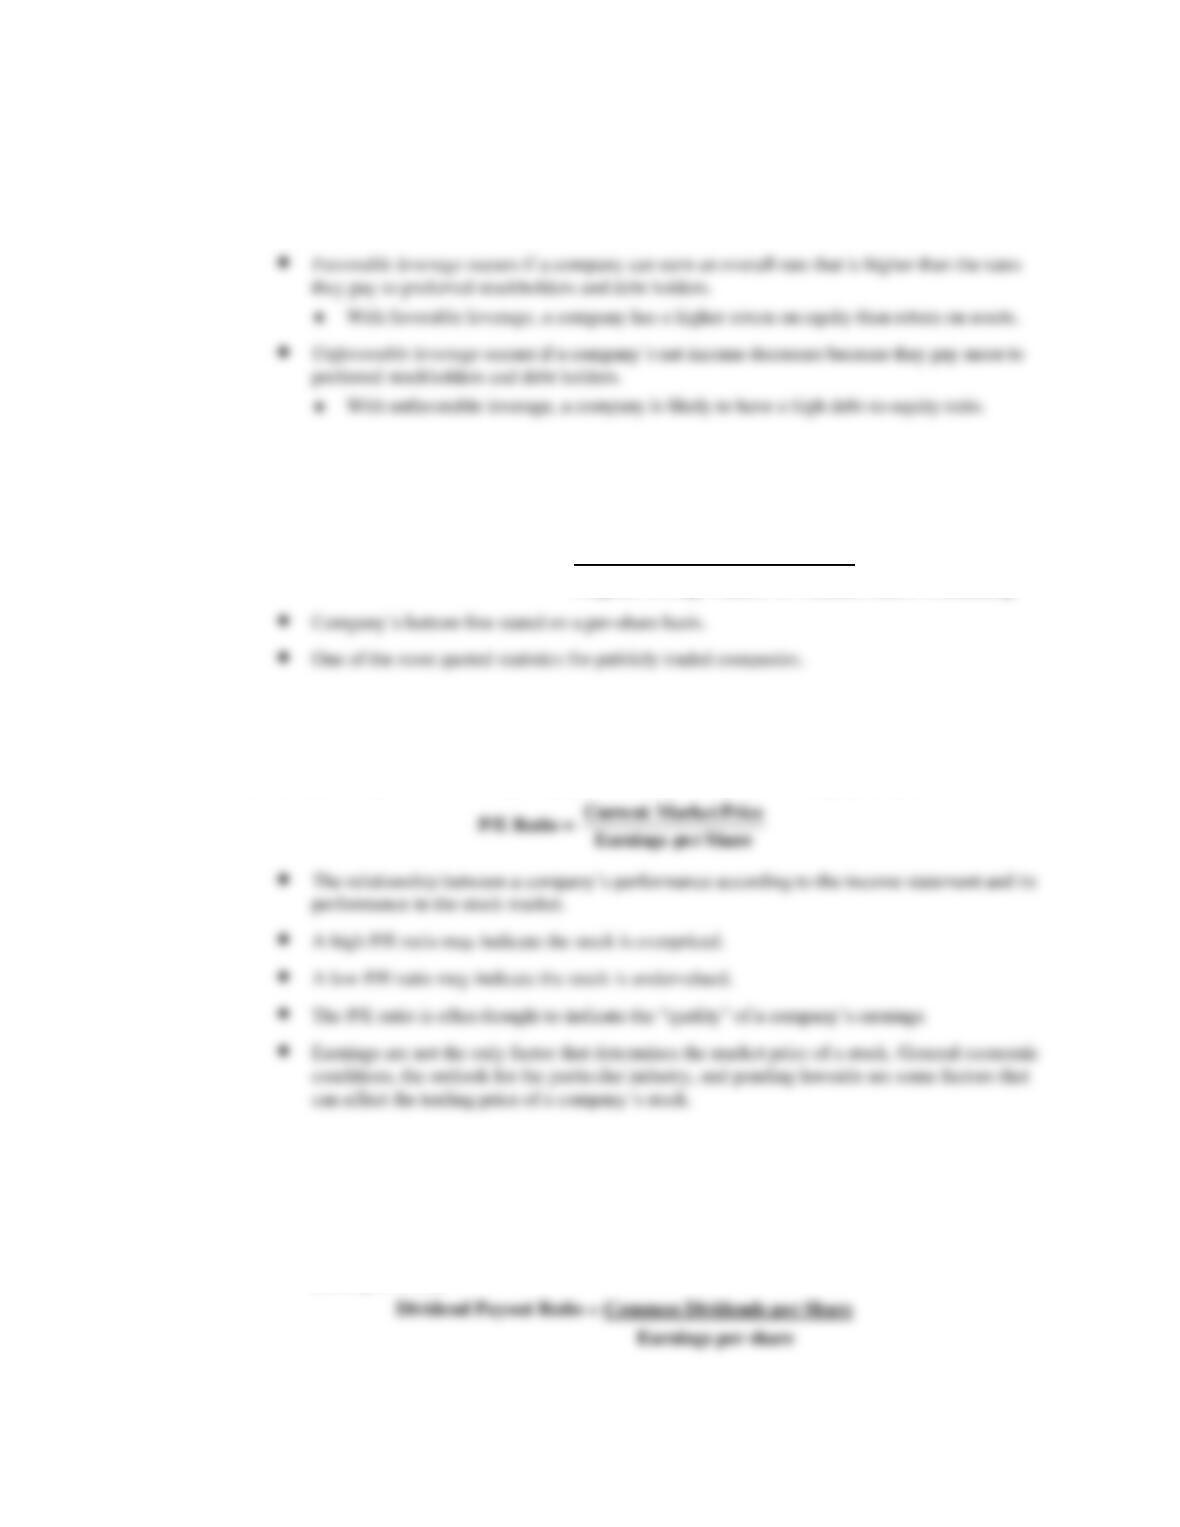
◼ Return on assets and return on equity are tied together in a concept called leverage, the use of
borrowed funds and amounts contributed by preferred stockholders to earn a an overall return
higher than the cost of these funds.
Earnings per Share (Example 13-21)
◼ Earnings per share (EPS) is a calculation of each stockholder’s share of earnings:
Earnings per Share = Net Income – Preferred Dividends
Weighted Average Number of Common Shares Outstanding
Price/Earnings Ratio (Example 13-22)
◼ Price-earnings (P/E) ratio relates the price of a share of stock to earnings per share:
Dividend Ratios
◼ Dividend ratios evaluate a company’s dividend policies.
• Dividend payout ratio measures how much of the earnings actually go to the shareholders
(Example 13-23):
CHAPTER 13 FINANCIAL STATEMENT ANALYSIS
The percentage of earnings paid out as common dividends.
• Dividend yield ratio is the relationship between dividends and the market price of the
company’s stock (Example 13–24):
Dividend Yield Ratio = Common Dividends per Share
Market Price per Share