Advanced Topics in Shear Strength of Soils and Rocks Chapter 13
13-56. A consolidated-undrained triaxial compression test was conducted on an undisturbed
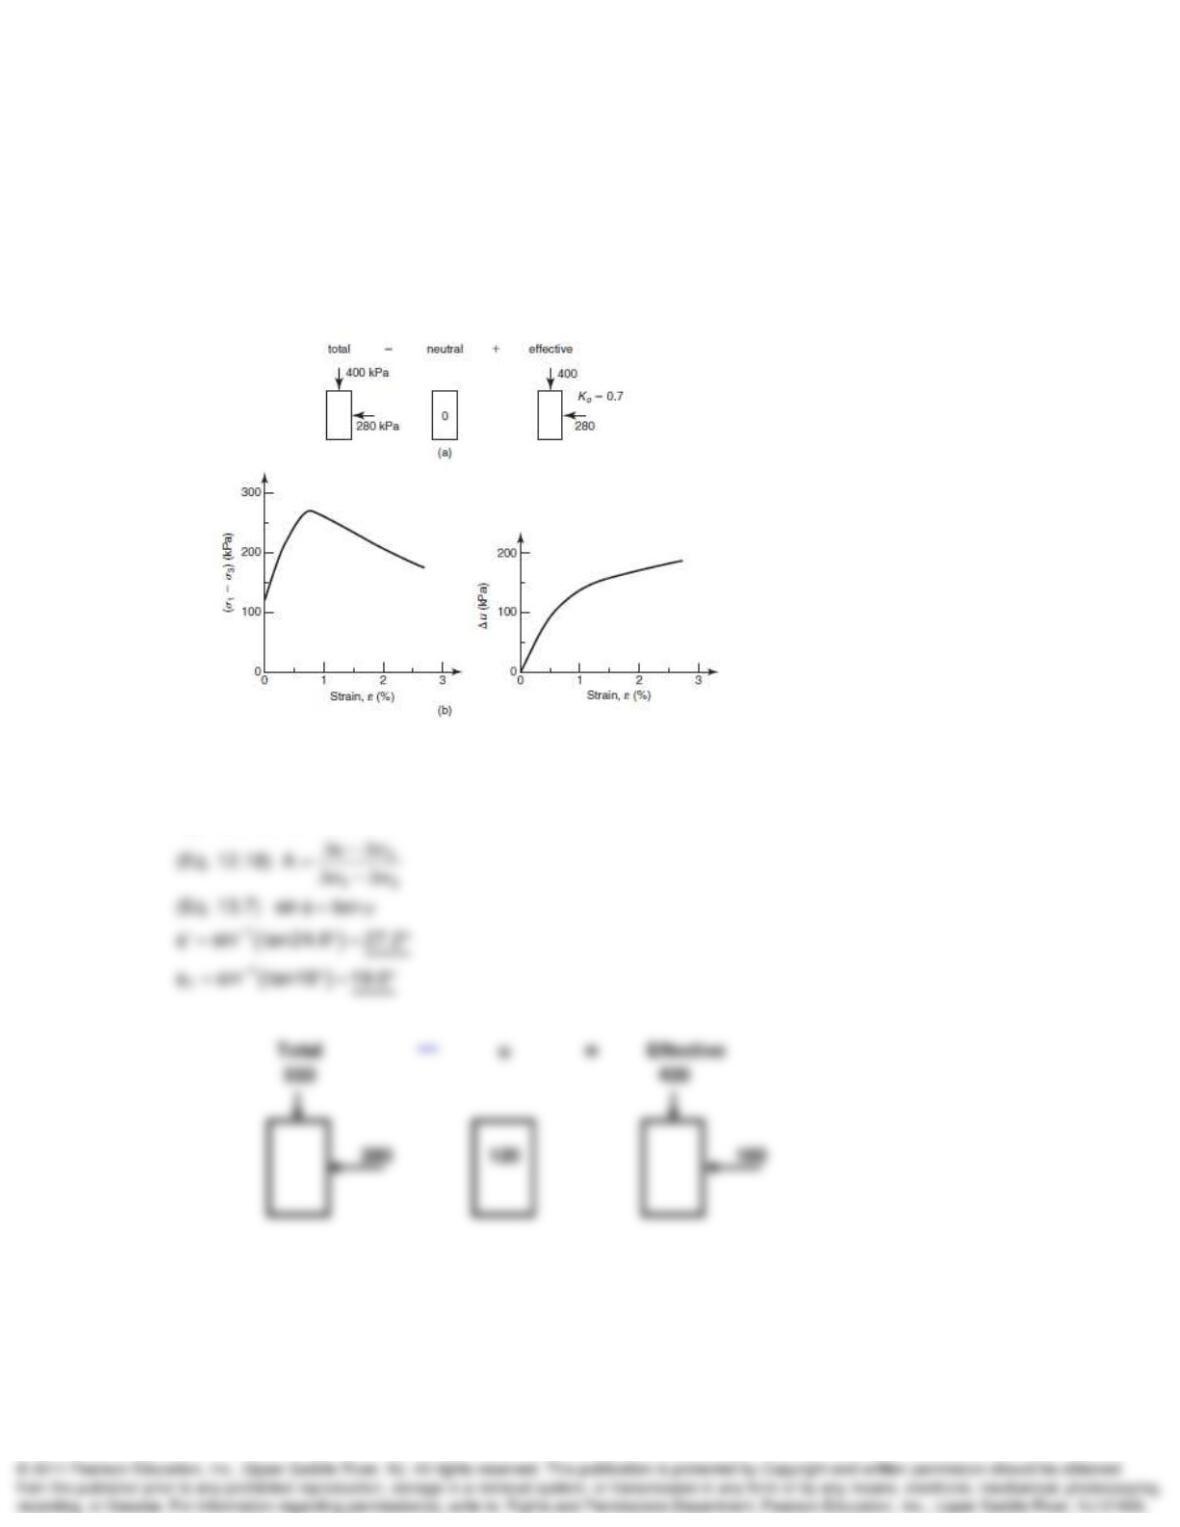
specimen of sensitive Swedish clay. The initial conditions were as shown in Fig. P13.56a.The
stress-strain and pore pressure responses of the specimen are shown in Fig. P13.56b. (a) Find
the stress conditions at failure and symbolically show the total, neutral, and effective stresses
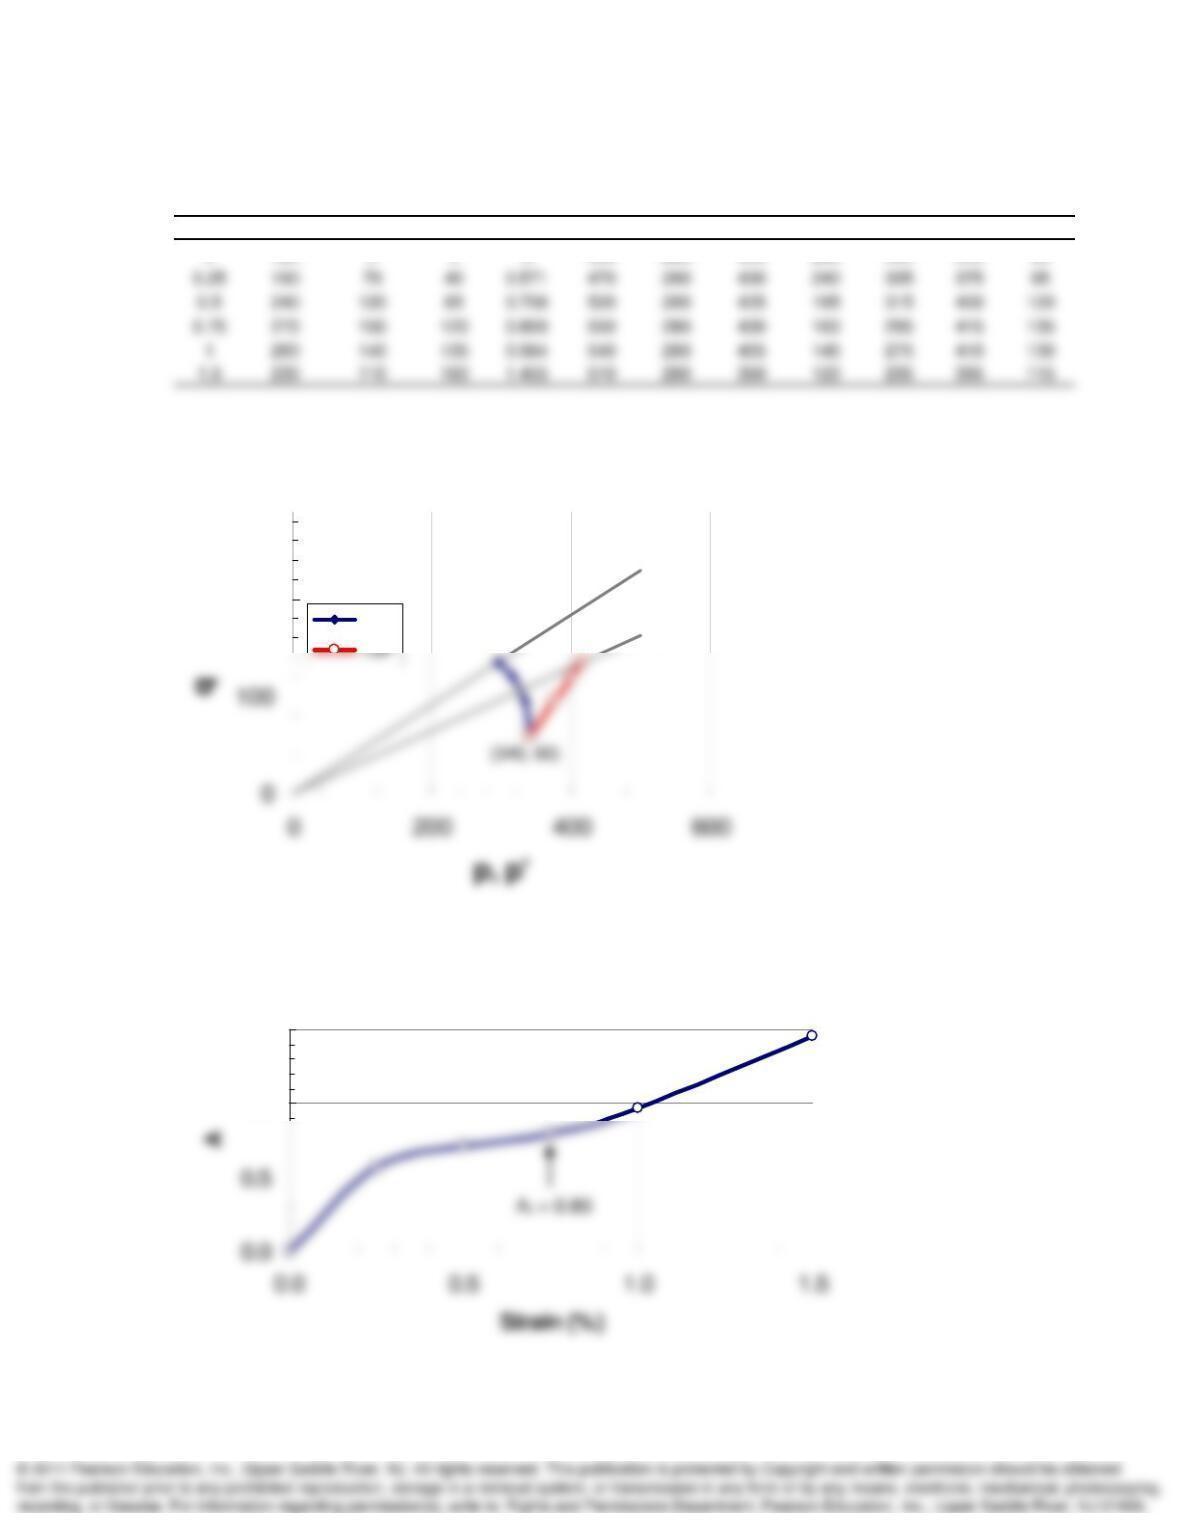
(like the “initial conditions” shown above). (b) Sketch the total and effective stress paths. (c) Plot
A versus
. What is Af? What are
’ and
T?
SOLUTION:
13 f
f
1f
From given plots, at failure: 270 kPa, u 120 kPa, 0.75 %
280 270 550 kPa
Continued on next page.
Advanced Topics in Shear Strength of Soils and Rocks Chapter 13
Problem 13-56 continued.
(%) (
1
–
3
)(
1
–
3
)uA
1
3
‘
1
‘
3
p’ p q
0 120 0 0 0 400 280 400 280 340 340 60
200
ESP
1.0
1.5
18.0o
24.6o
Advanced Topics in Shear Strength of Soils and Rocks Chapter 13
13.57. If an LE test were conducted on a sample of Swedish clay identical to that tested in
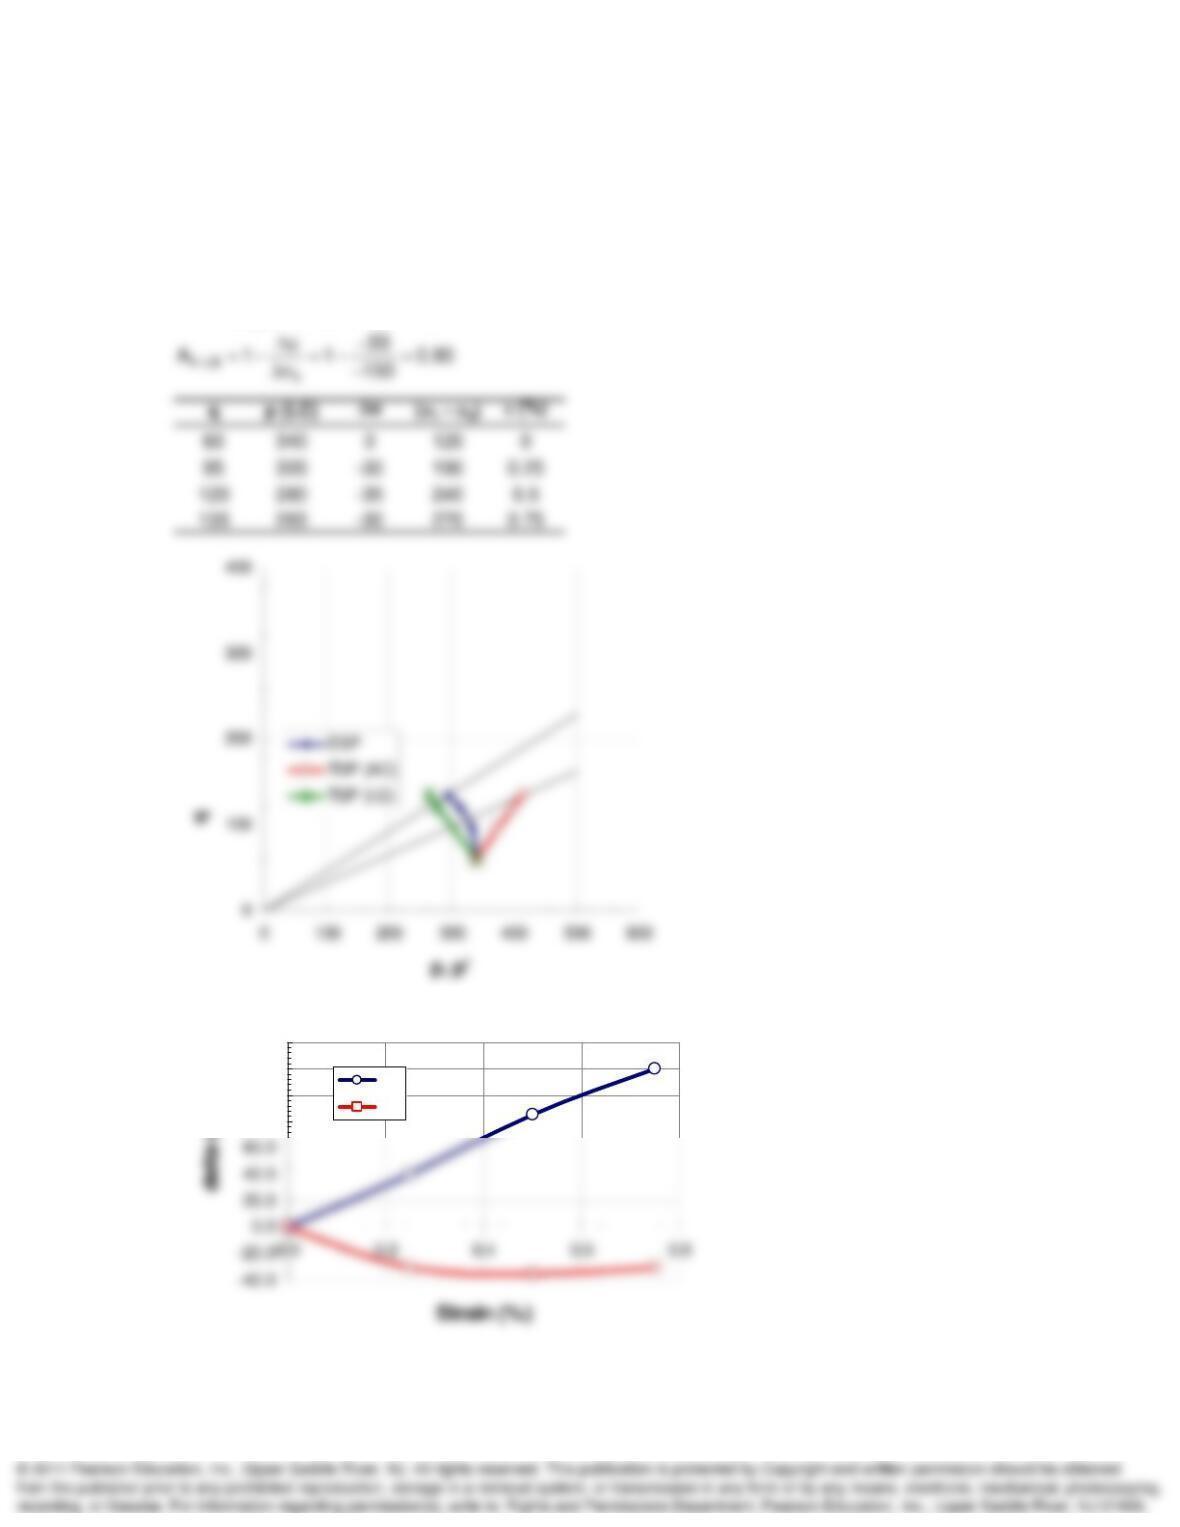
Problem 13.56, predict the pore pressure versus strain response of the clay. What are uf and Af?
What is
T?
SOLUTION:
1
f
Construct LE-TSP path by assuming constant.
From diagram, scale u 30 kPa
80.0
100.0
120.0
140.0
AC
LE
Advanced Topics in Shear Strength of Soils and Rocks Chapter 13
13-58. The data shown in Fig. P13.58 are obtained from several CU tests on a saturated clay
which has an OCR of 10 and a preconsolidation stress of 800 kPa. It is assumed that these
results are valid for all compression stress paths on this clay. You are going to run a special
stress path test on this clay. After consolidation at
’vo, the cell pressure will be increased in such
a way that
3 = 0.2
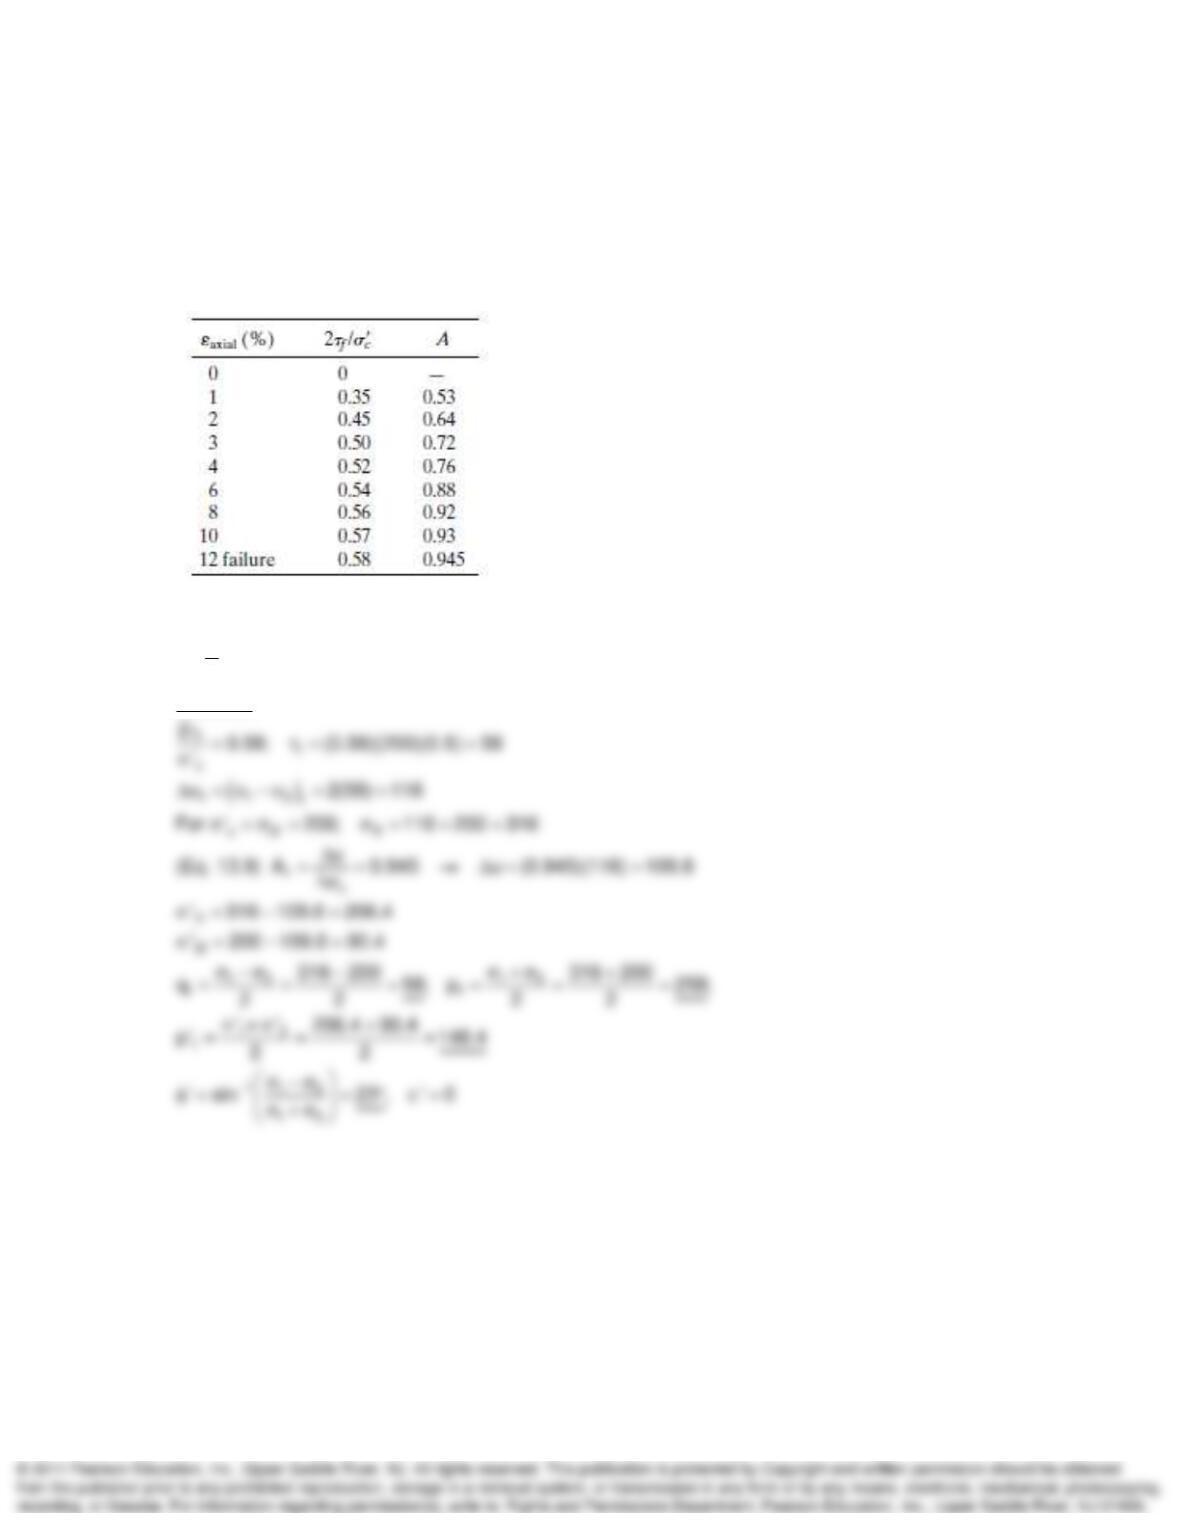
1 until failure occurs. For this special stress path test, fill in the table below
and plot the total and effective stress paths. (After C.W. Lovell.)
SOLUTION:
1c 1
‘
(%) (
1
3
)
1
3
1
3
uA
‘
1
‘
3
p’ p q
0.00 0.00 0.00 0.00 80.00 80.00 0.00 0.10 80 80 80 80 0
150
Advanced Topics in Shear Strength of Soils and Rocks Chapter 13
13-59. A series of CU compression tests on a simple clay (Ladd, 1964) provided the following
test results: (a) In an axial compression test, if
’c = 200 kPa, determine qf, pf, and p’f. (b) Find
’
and c’. A special lateral extension stress path test was conducted on this clay in which the
decrease in lateral stress was exactly equal to the increase in axial stress; that is, –
3 =
1. For
this case, if
’c = 400 kPa, determine
1, q, p, p’ and
u (c) when the axial strain is 4% and (d) at
failure. (After C.W. Lovell.)
SOLUTION:
13
1
2
At failure
Advanced Topics in Shear Strength of Soils and Rocks Chapter 13
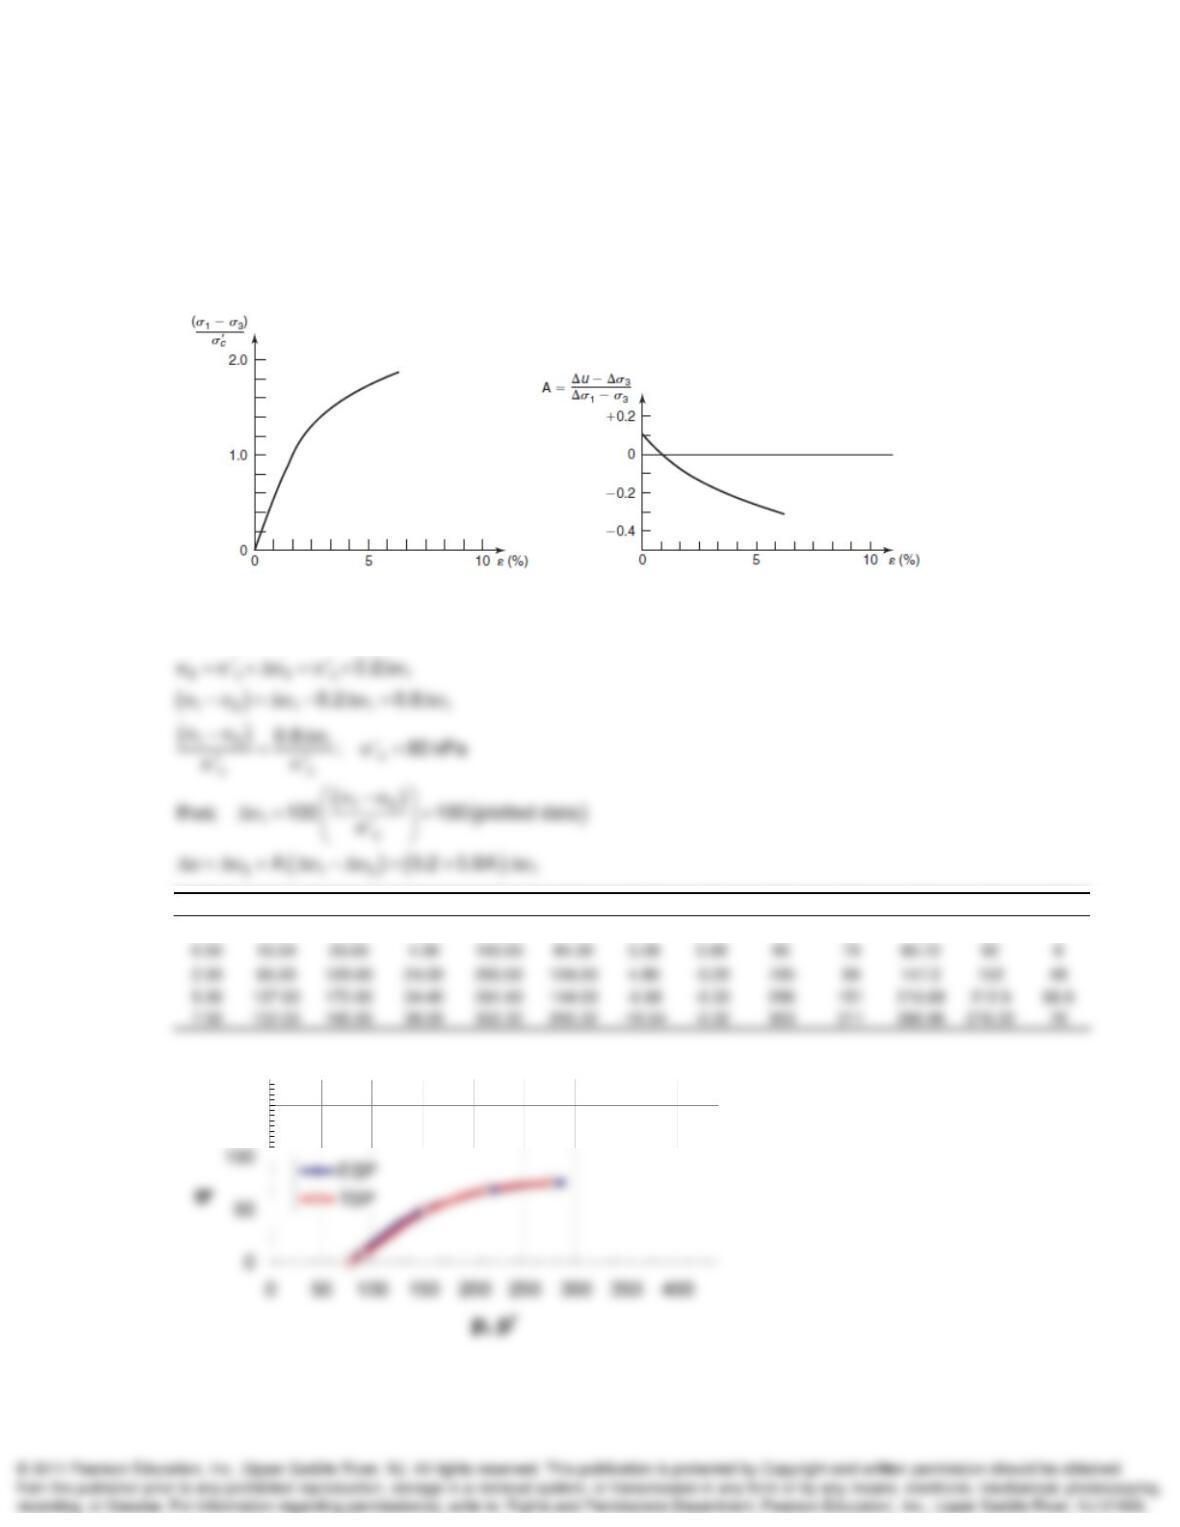
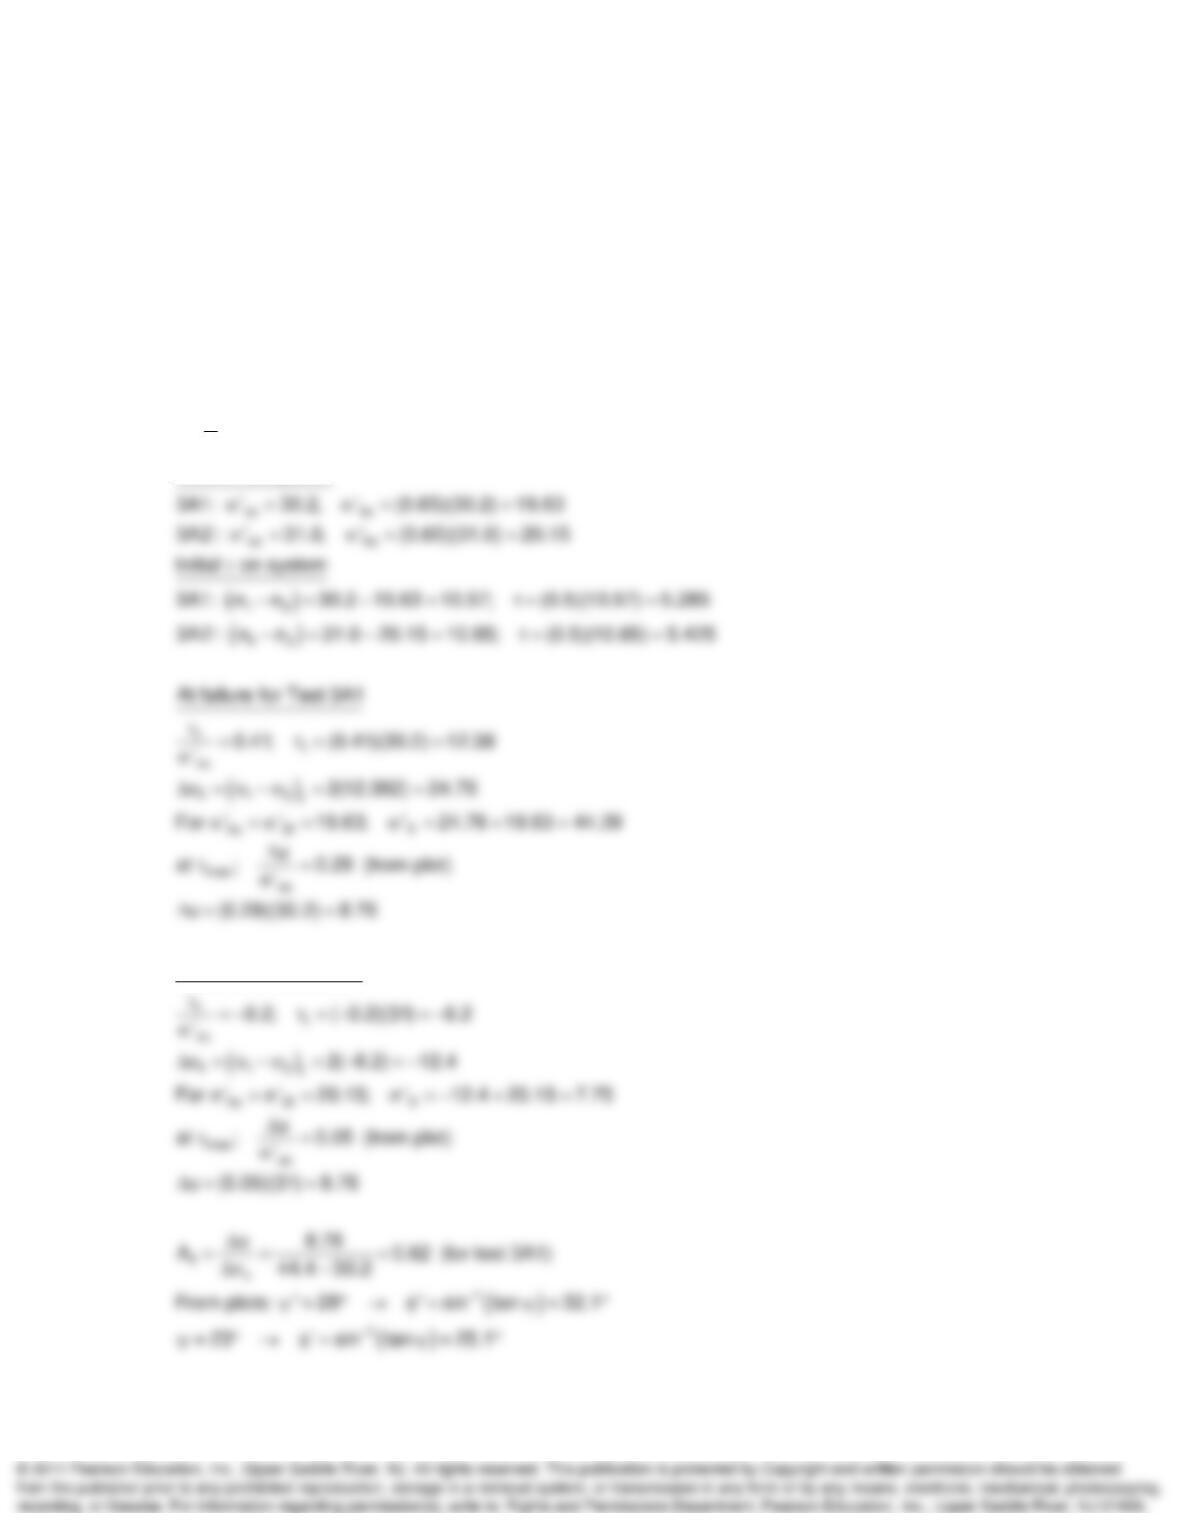
13-60. Figure P13.60 shows normalized data from an axial compression (AC) triaxial test and a
lateral compression (LC) triaxial test on saturated simple clay (Ladd, 1964). Make the appropriate
calculations, and plot the complete total and effective stress paths for both tests. What are the
Mohr–Coulomb strength parameters? Determine Af for each test.
SOLUTION:
c
Assume ‘ 100
(%) (
1
3
)‘
1
/‘
3
u
‘
3
3
‘
1
1
Ap‘pq
0.00 0.00 0.00 0.00 100.00 100.00 100.00 100.00 0.0 100.0 100.0 0.0
100.0
Advanced Topics in Shear Strength of Soils and Rocks Chapter 13
13-61. Two specimens of a soft clay from the Skå-Edeby test field in Sweden were
reconsolidated to their initial in situ effective stress conditions and then sheared to failure. One
specimen was loaded in axial compression (AC), while the other was failed by axial extension
(AE). The normalized stress-strain and pore pressure strain data for both tests is shown in Fig.
P13.61 (after Zimmie, 1973). Pertinent specimen data is given in the accompanying table. (a) On
a p–q diagram, sketch the total, total-uo, and effective stress paths for both tests. (b) Determine
’
and
T in both compression and extension. (c) Calculate the Skempton pore pressure parameter
A at failure for both tests.
SOLUTION:
13
1
2
Initial on system
At failure for
Test 3A2
Advanced Topics in Shear Strength of Soils and Rocks Chapter 13
Problem 13-61 continued.
(%) ‘vc u/s’vc (
1
–
3
)
‘
1
‘
3
uA
1
3
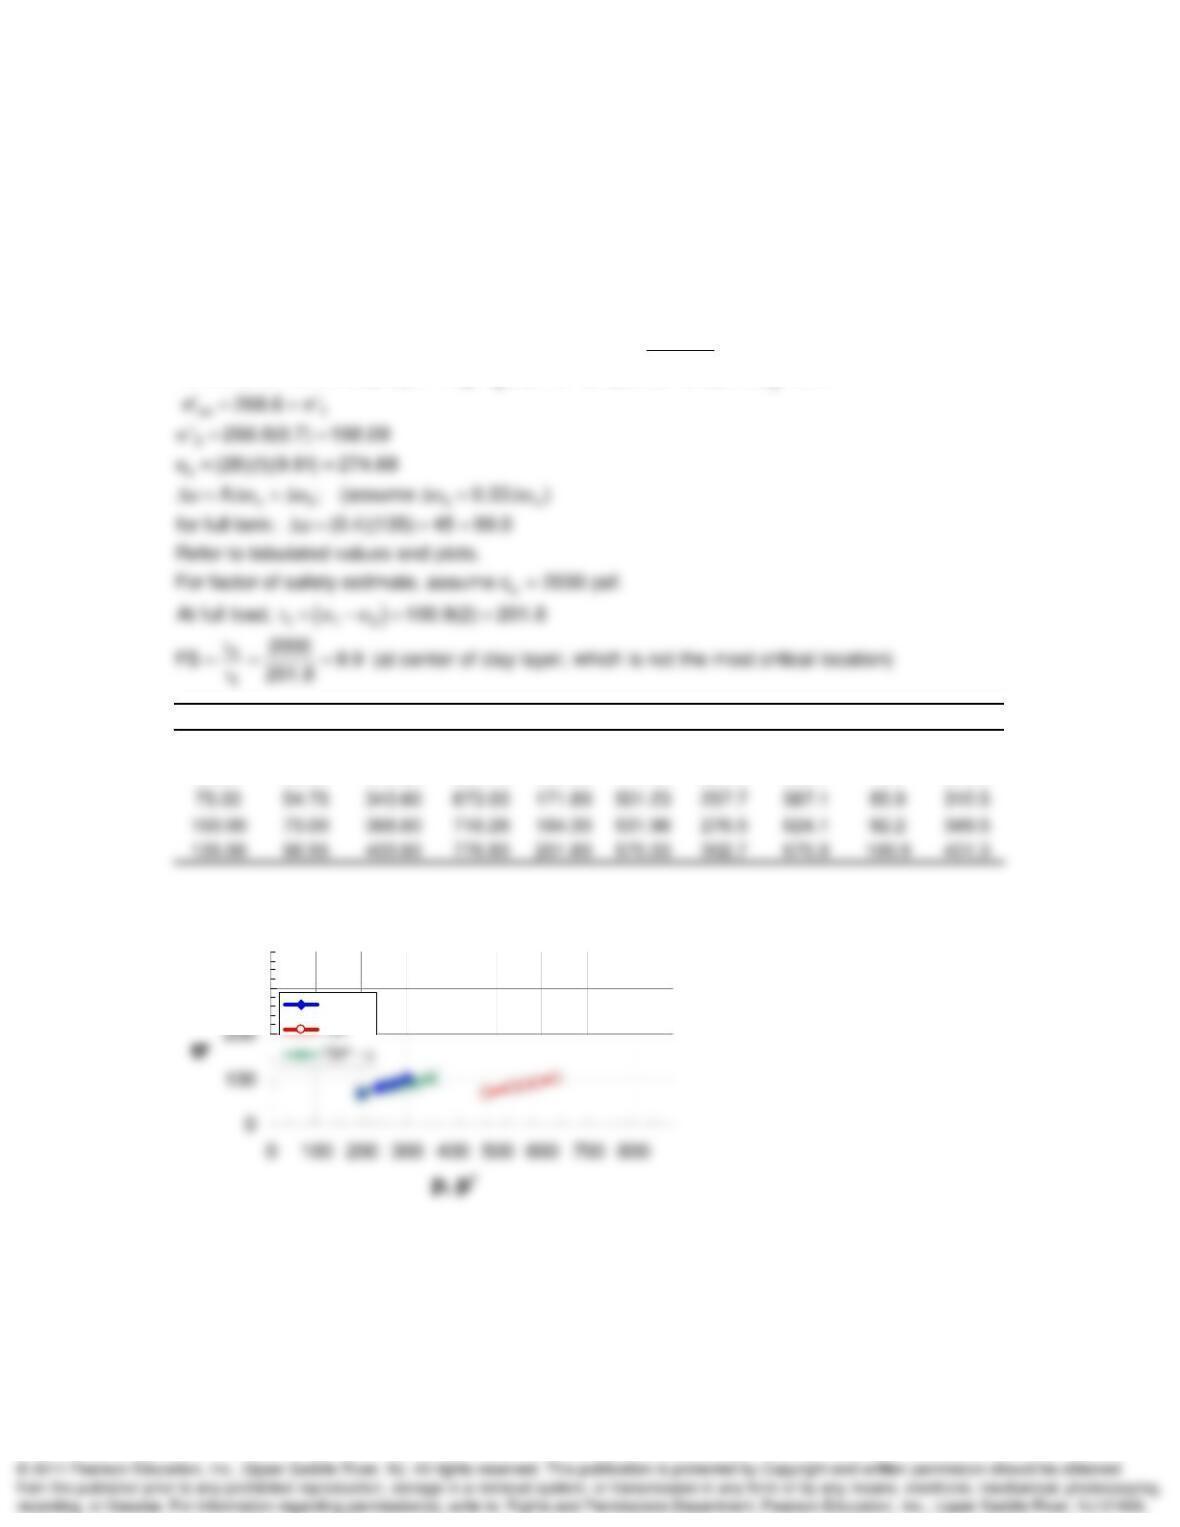
pp‘qp – TSP
0.00 0.17 0.00 10.27 29.90 19.63 0.00 0.00 29.90 19.63 24.76 24.76 5.13 44.76
30.00
Advanced Topics in Shear Strength of Soils and Rocks Chapter 13
13-63. For the oil tank problem in Chapter 10 (Problem 10.16), plot the complete total, total-uo,
and effective stress paths due to construction and filling of the tank for an element under the
centerline of the tank and at the midpoint of the clay layer. Assume that Ko at the site is 0.7 and
that the average value of the A parameter before failure is 0.4; assume Af = 0.5. Make reasonable
estimates of the strength parameters, and estimate the factor of safety against failure.
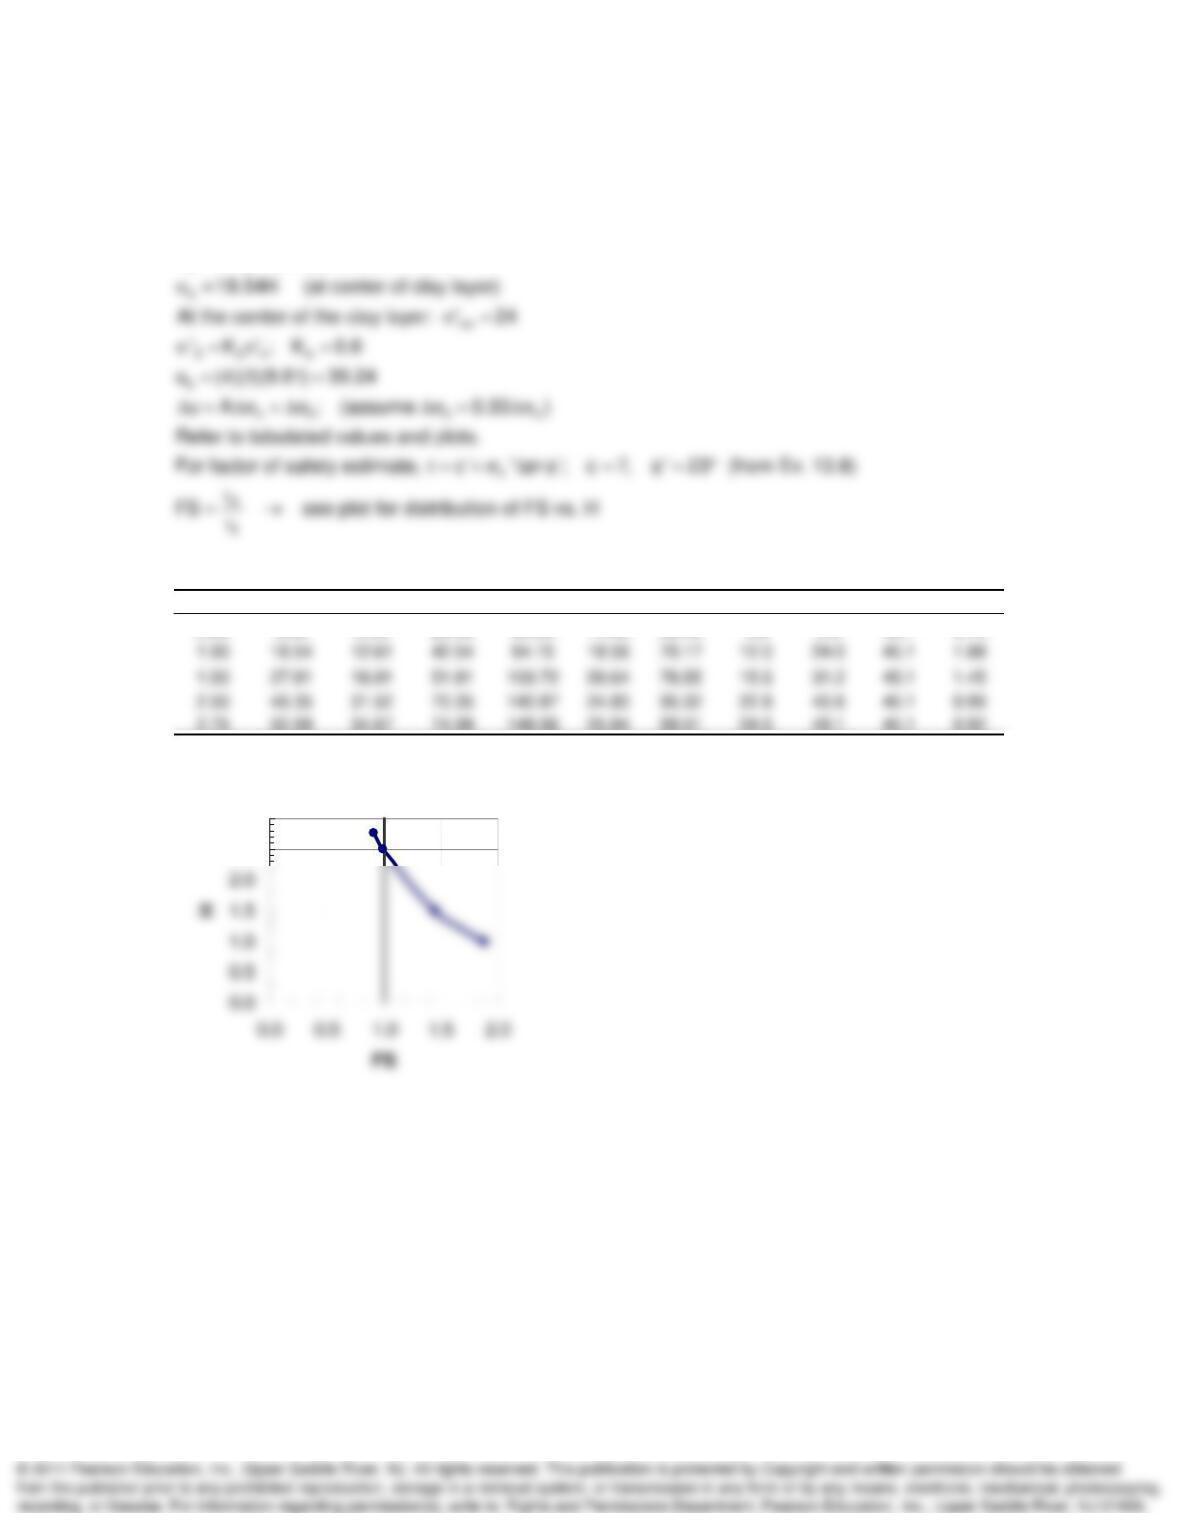
SOLUTION:
zv
vo
From Fig. 10.5: for r = 45 m and z = 30 m, 135 kPa (at center of clay layer)
At the center of the clay layer: ‘ (2)(1.7) (18)(0.81) (10)(0.94) 9.81
vu‘11
‘3
3p’ p q p – uo
0.00 0.00 268.60 543.28 134.30 408.98 201.5 476.1 67.2 201.5
50.00 36.50 318.60 629.78 159.30 470.48 239.0 550.1 79.7 275.5
300
ESP
Advanced Topics in Shear Strength of Soils and Rocks Chapter 13
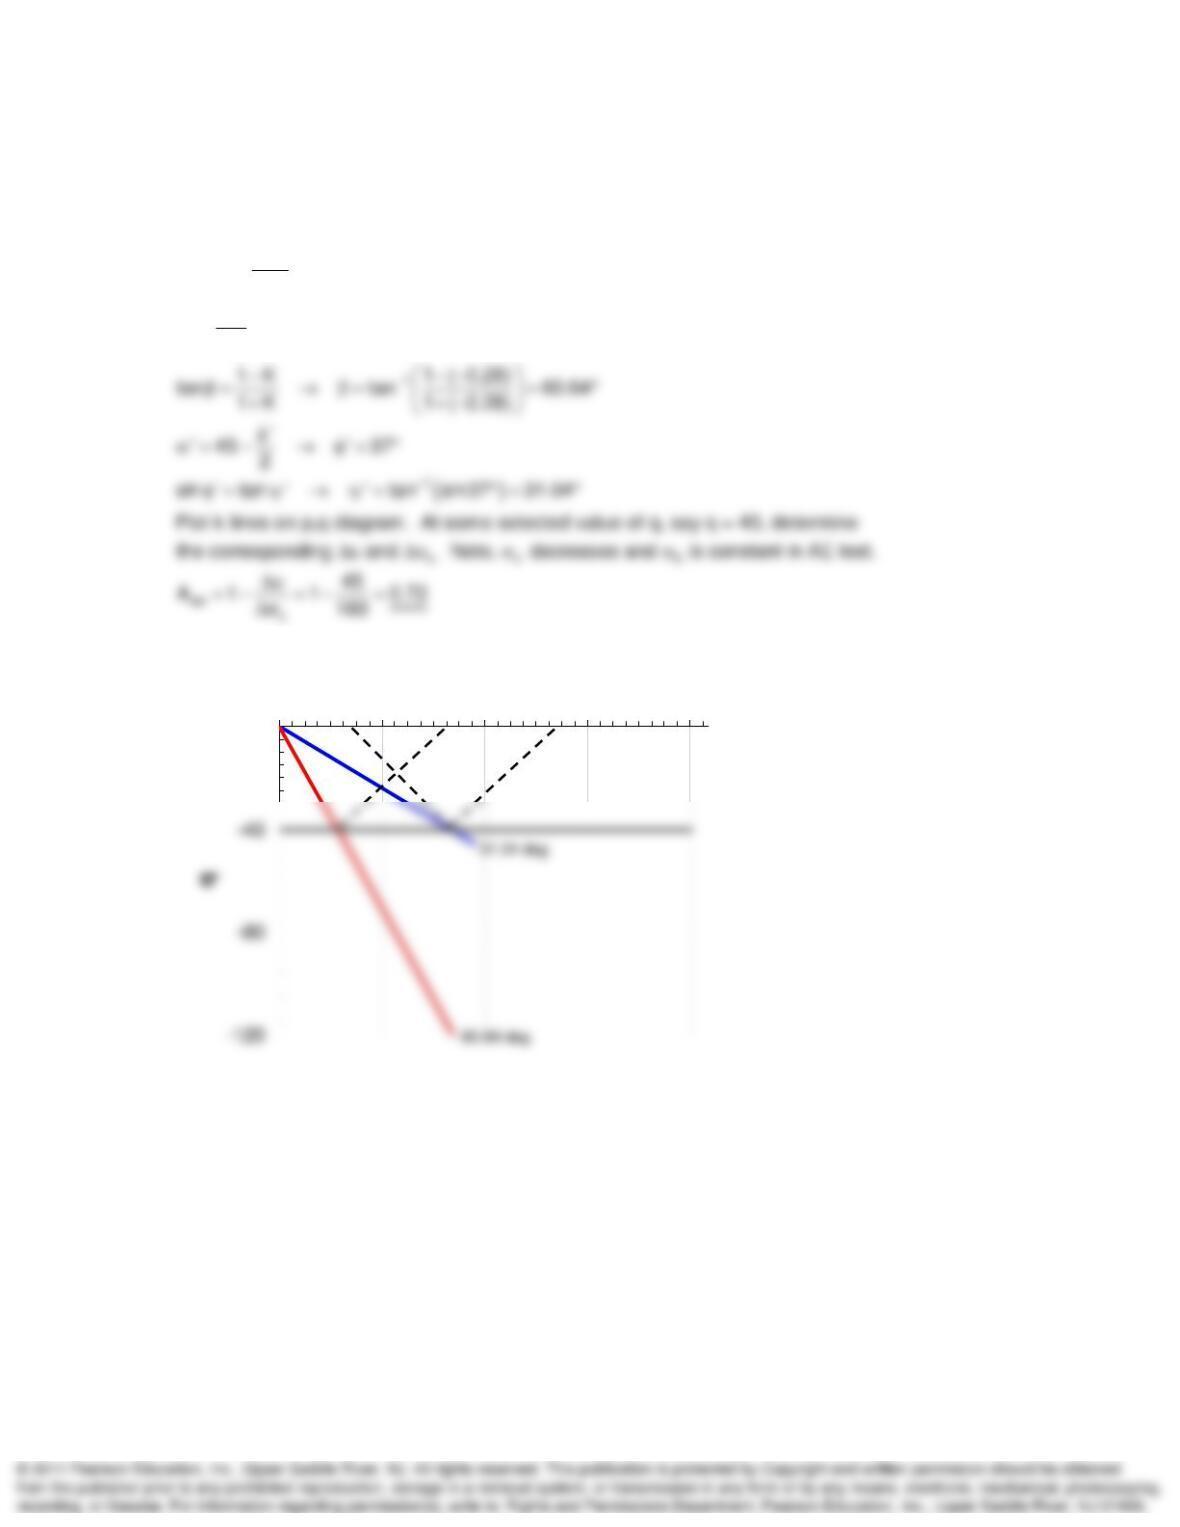
13-64. What is the maximum safe height of the embankment for Examples 13.4 and 13.8? Plot a
graph of factor of safety versus height of the embankment.
SOLUTION:
zv
I I(2.1)(9.81)H; I 0.9
H
v
u‘
1
1
‘
3
3
q
c
u
FS
0.00 0.00 0.00 24.00 63.00 14.40 53.40 4.8 9.6 45.1 4.70
2.75 50.99 34.67 74.99 148.66 25.84 99.51 24.6 49.1 45.1 0.92
2.5
3.0
Advanced Topics in Shear Strength of Soils and Rocks Chapter 13
13-67. A CU extension test was performed on a normally consolidated specimen using axial
extension. The strength ratio was -0.280, and the effective failure angle,
’ = 26.5 deg. Find Af.
SOLUTION:
ae
v
h
f
v
u
A1
‘
K0.28
‘
0
0 40 80 120 160
p, p’
Advanced Topics in Shear Strength of Soils and Rocks Chapter 13
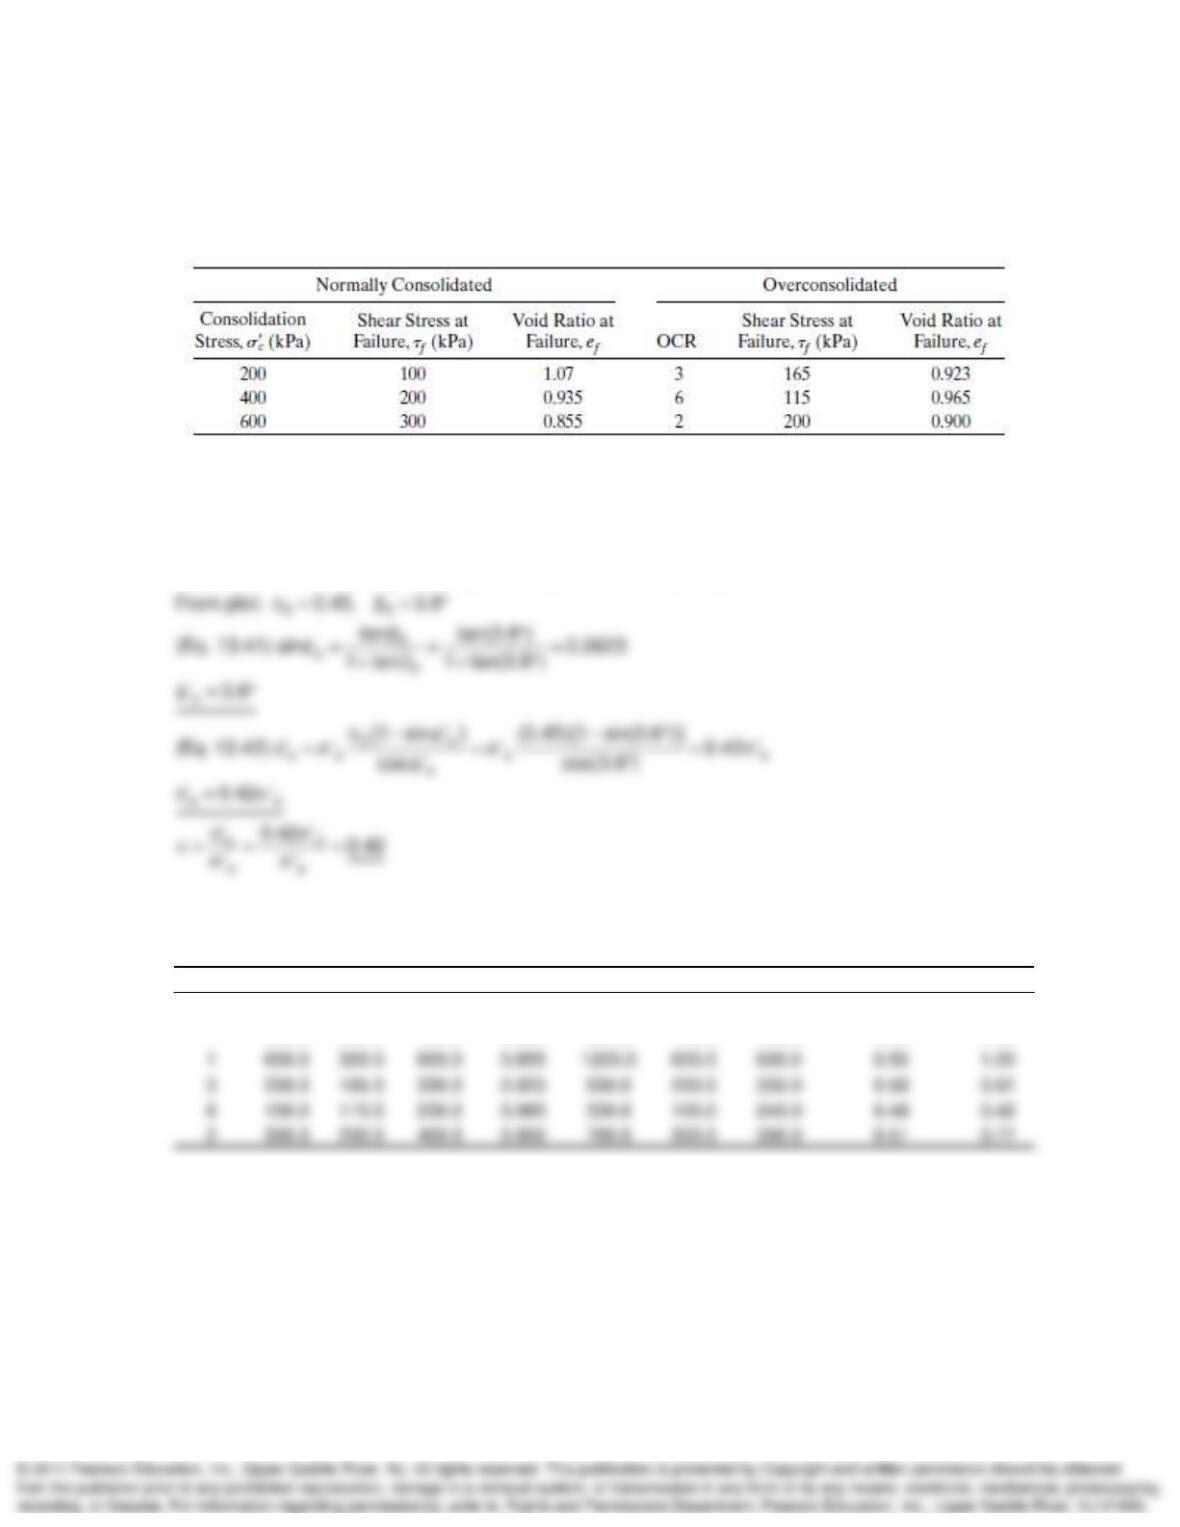
13-68. The following data was obtained from CD direct shear tests on NC and OC specimens of
a low plasticity clay. The OC specimens were originally consolidated to 600 kPa, then rebounded
to obtain the OCRs shown below. Determine the Hvorslev shear strength parameters
’e, ce, and
the Hvorslev coefficient K (After Perloff and Baron, 1976.)
SOLUTION:
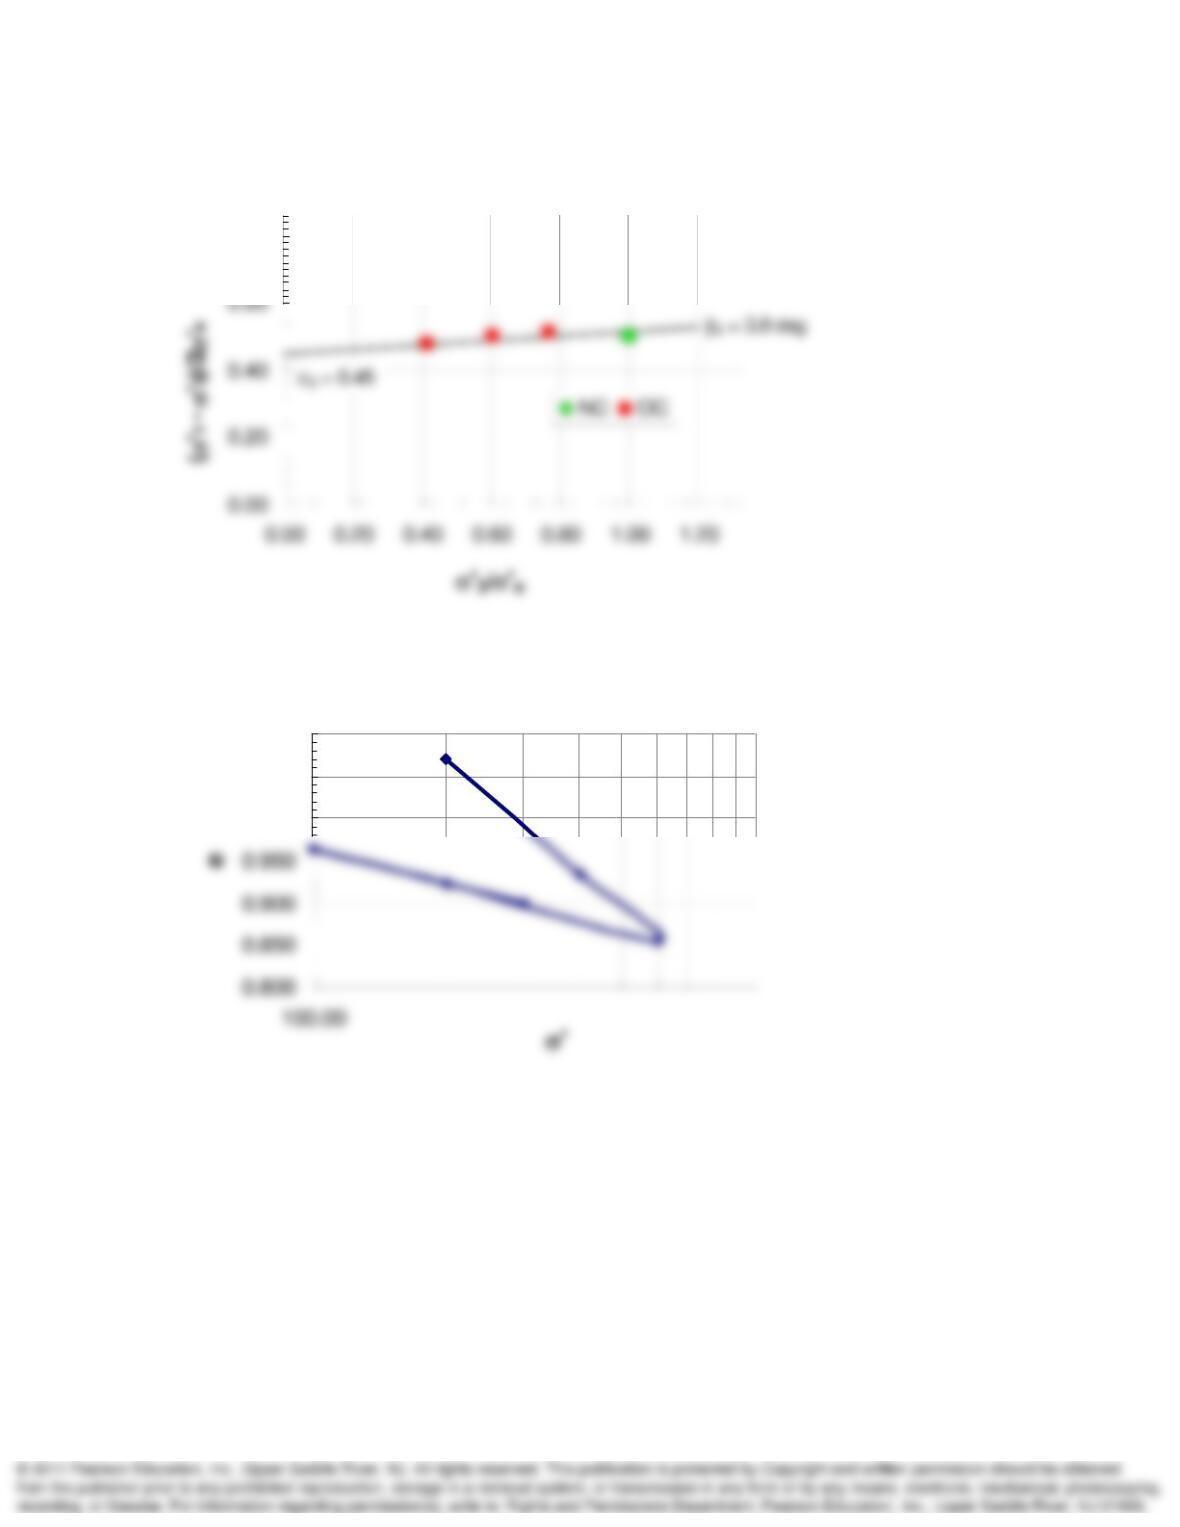
Tabulate data using given data and develop consolidation plot (e vs. ‘).
Develop plot similar to Fig. 13.84, per Bishop and Henkel (1962).
OCR ‘
c
f
(‘
1
‘
3
)e
f
‘
1
‘
3
‘
e
(‘
1
‘
3
)/2‘
e
‘
3
/
‘e
1 200.0 100.0 200.0 1.070 400.0 200.0 200.0 0.50 1.00
1 400.0 200.0 400.0 0.935 800.0 400.0 400.0 0.50 1.00
Continued on next page.
Advanced Topics in Shear Strength of Soils and Rocks Chapter 13
Problem 13-68 continued.
0.80
1.000
1.050
1.100
Advanced Topics in Shear Strength of Soils and Rocks Chapter 13
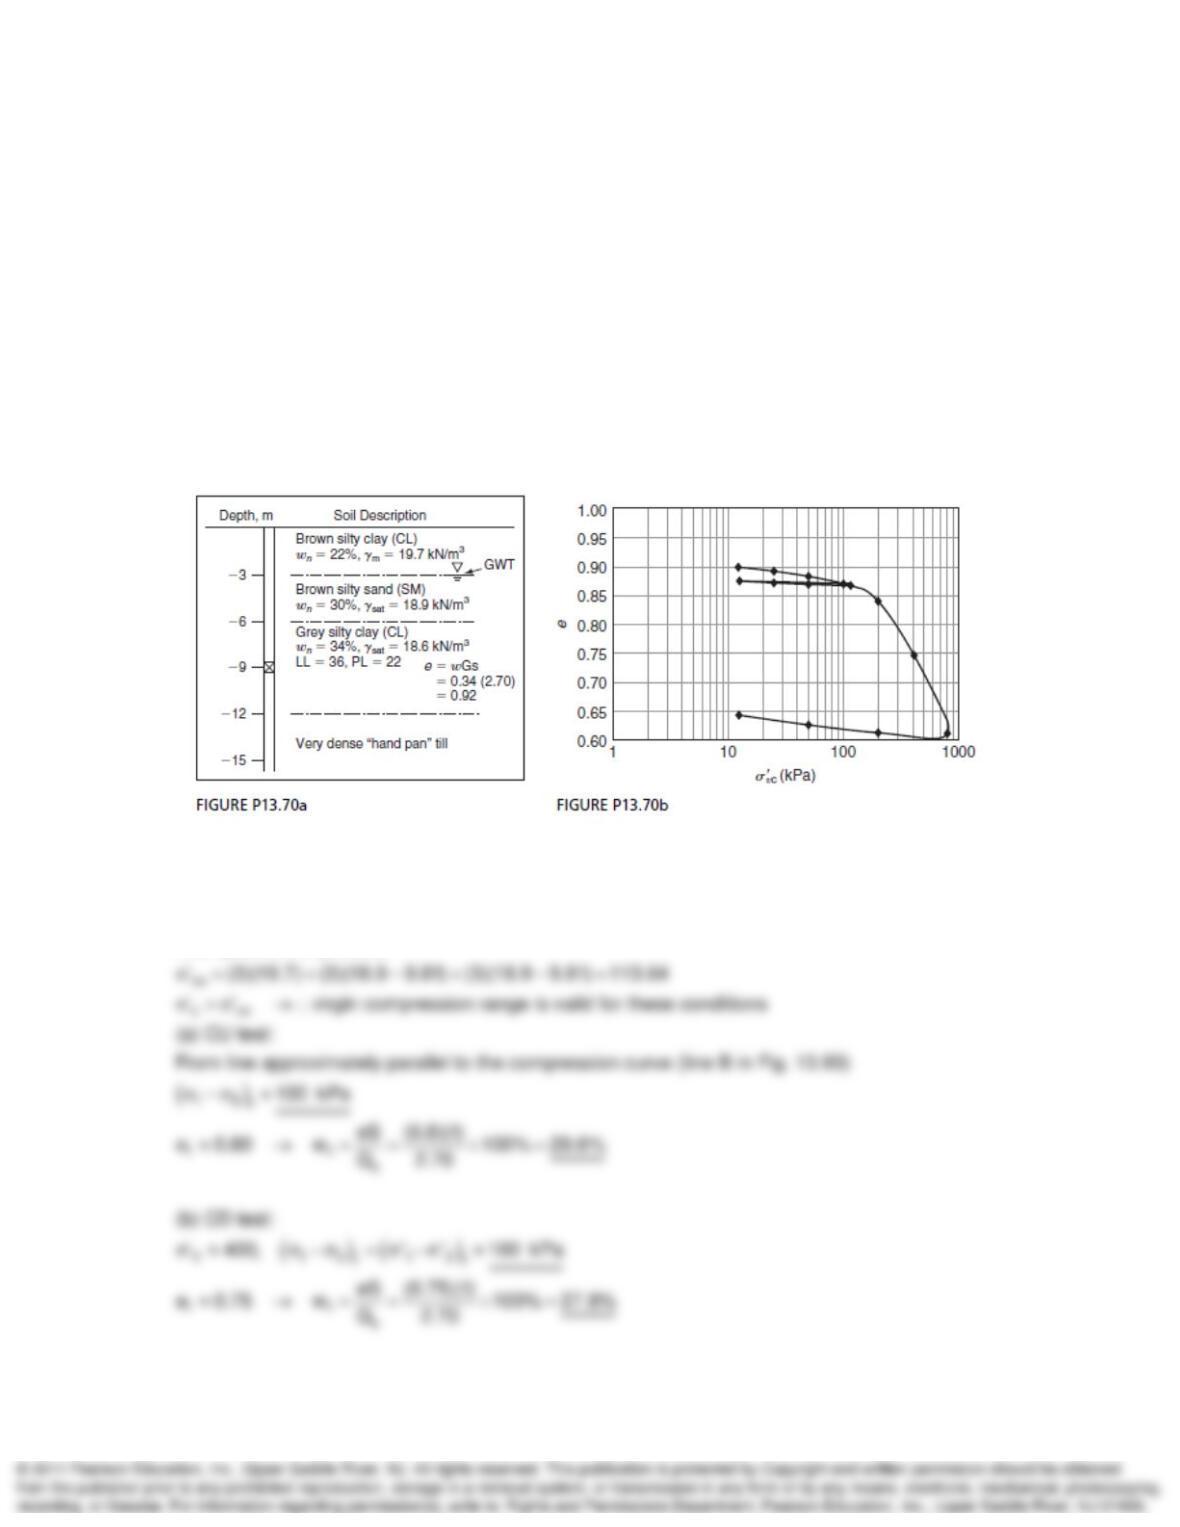
13-70. Undisturbed piston samples of grey silty Chicago clay were obtained from a depth of -9 m
as shown in the soil profile in Fig. P13.70a, for laboratory testing. Different types of strength tests
as well as a consolidation test were conducted, and the results of the consolidation test are
shown in Fig. P13.70b. Unconfined compression (UCC) tests on adjacent specimens from that
depth had an average unconfined compressive strength of about 100 kPa. (a) An additional
specimen was trimmed and consolidated hydrostatically in a triaxial cell to 300 kPa; then it was
sheared undrained (CU test). Estimate the compressive strength of this specimen. (b) A
companion specimen of the same clay was also consolidated to 300 kPa, but then it was sheared
drained (CD test). Estimate the compressive strength of this specimen. (c) Estimate the water
content at failure for both the CD and CU triaxial specimens. (d) Estimate
’ and
T for the two
specimens.
SOLUTION:
An approximate solution can be obtained using the Jurgenson-Rutledge hypothesis
as described beginning on page 716. Refer to Fig.s 13.93, 13.97, and 13.98 for
examples of the process.