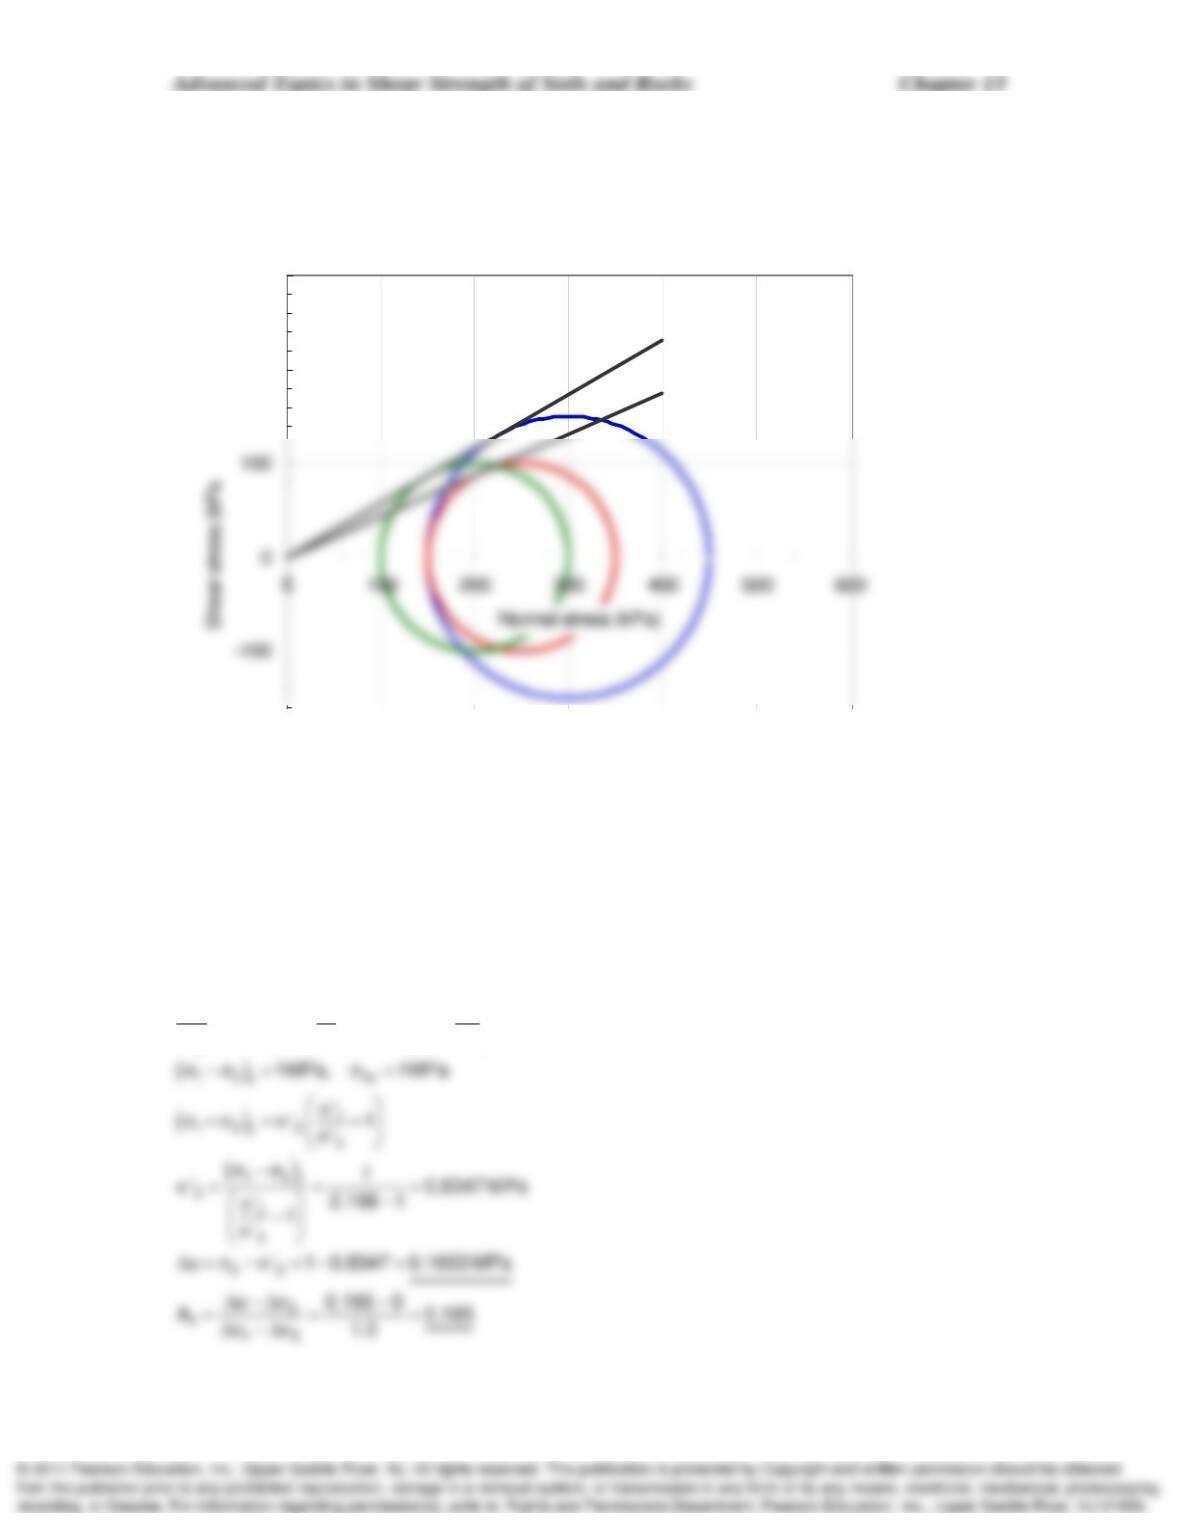
Problem 13-32 continued.
200
300
13-33. A clay sample is hydrostatically consolidated to 1.0 MPa and then sheared undrained.
The (
1 –
3) at failure was also equal to 1 MPa. If drained tests on identical samples gave
’ =
22o, evaluate the pore pressure at failure in the undrained test and compute Skempton’s A
parameter.
SOLUTION:
22
1
3
‘‘22
tan 45 tan 45 2.198
‘2 2
’ = 30.0o
T = 23.6o
Advanced Topics in Shear Strength of Soils and Rocks Chapter 13
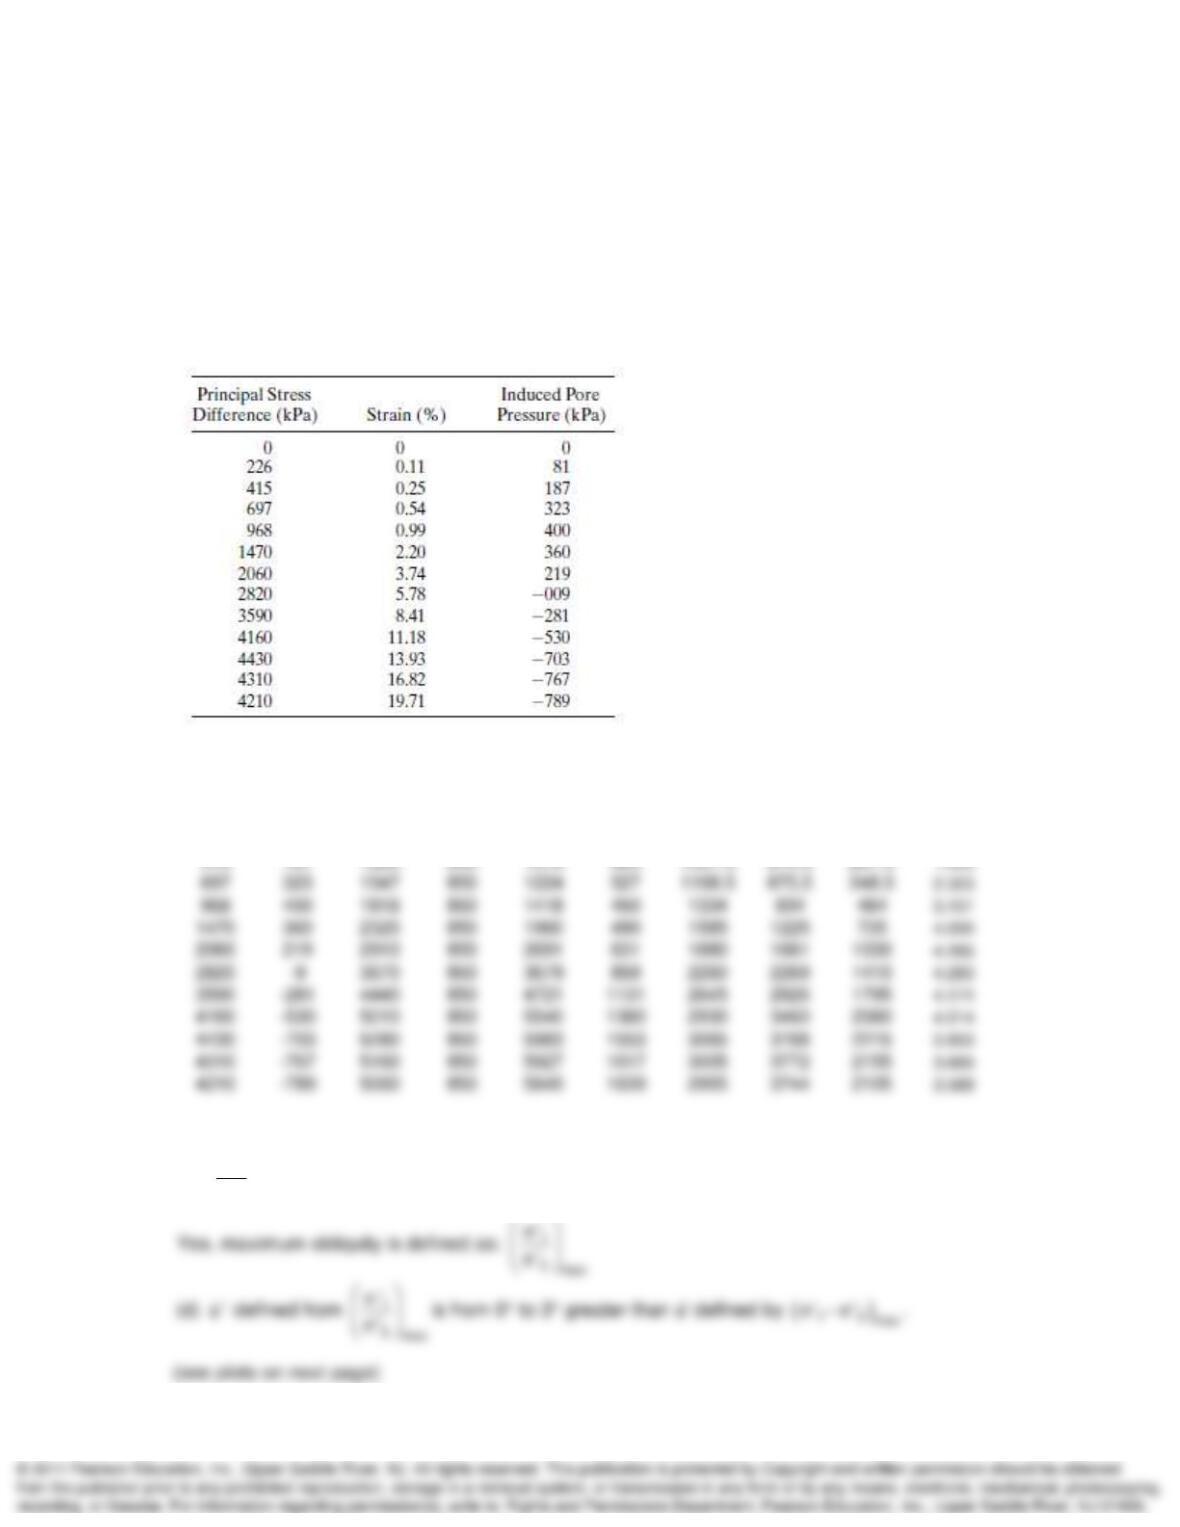
13-34. The following data were obtained from a CU test with pore pressures measured on an
undisturbed specimen of sandy silt. The consolidation pressure was 850 kPa and the specimen
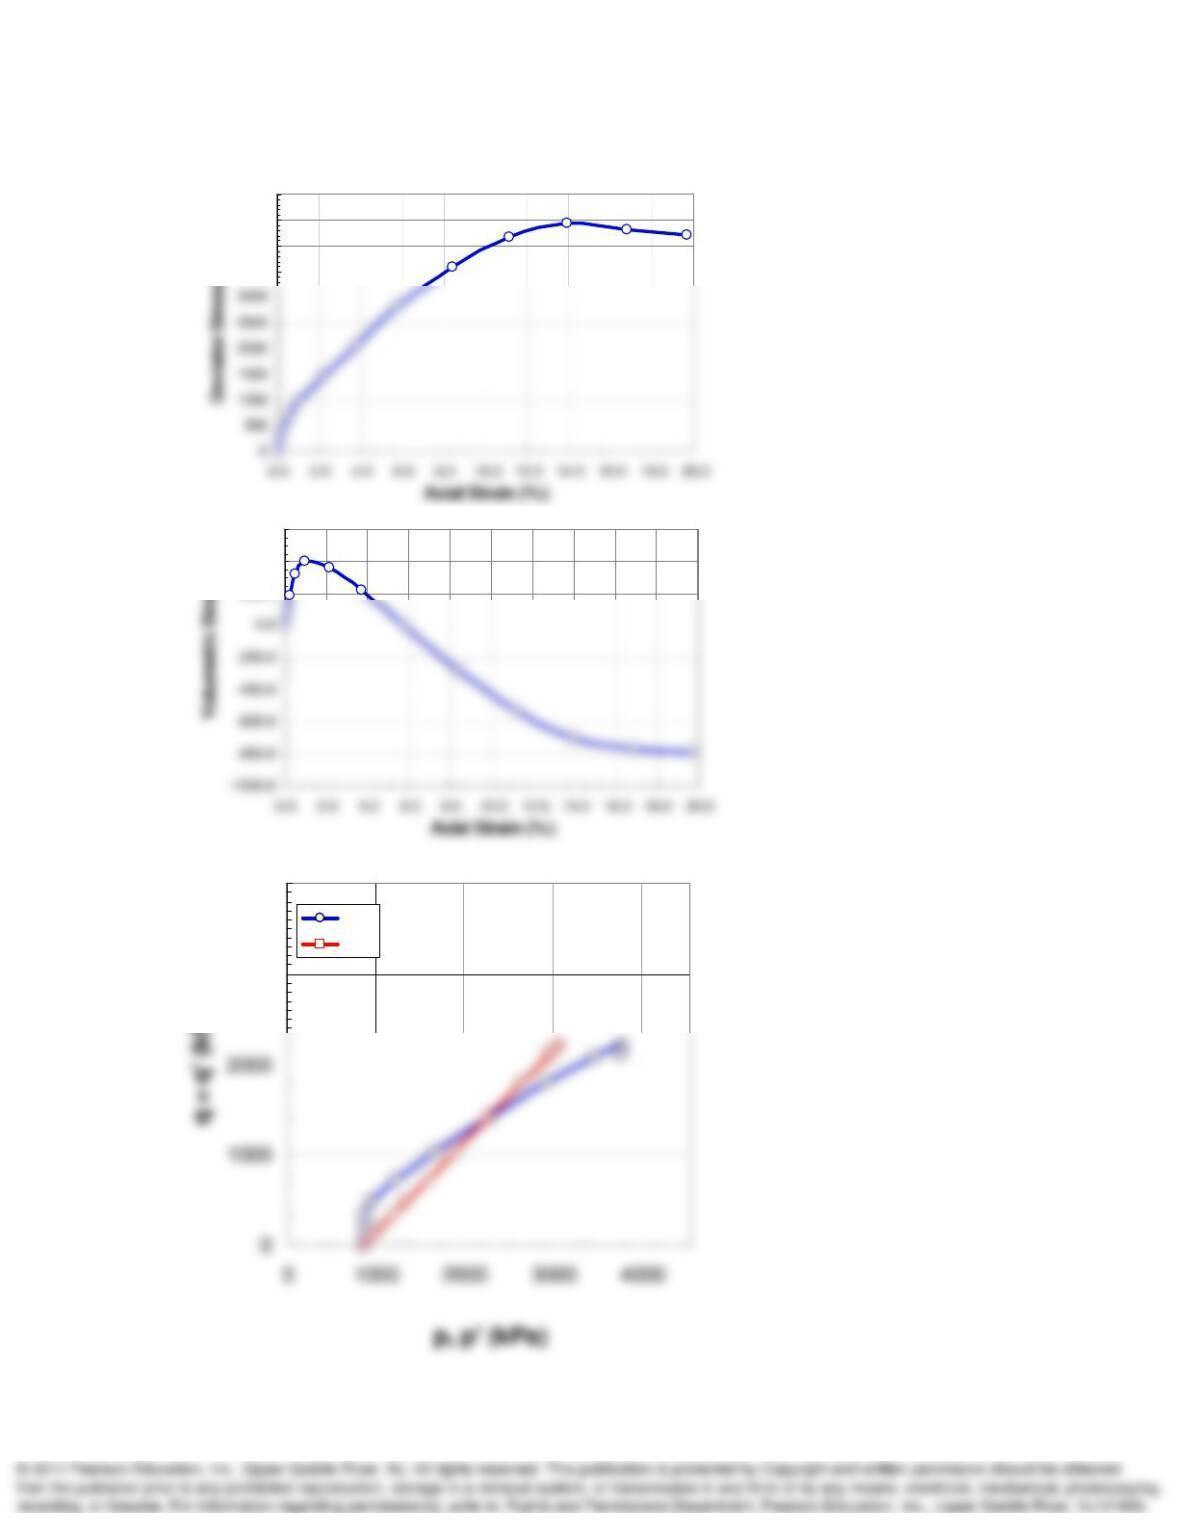
was sheared in axial compression. (a) Plot curves of principal stress difference and pore
pressures versus strain. Plot on one sheet. (b) Plot the stress paths on a p–q diagram. (c) What
is the maximum effective principal stress ratio developed in this test? Is it the same as the
maximum obliquity for this specimen? (d) Is there any difference in
’ as determined when the
principal stress difference or the principal effective stress ratio is a maximum? (After A.
Casagrande.)
SOLUTION:
s1 – s3 u s1 s3 s’1 s’3 p p’ q = q’ s’1/s’3
0 0 850 850 850 850 850 850 0
1.000
226 81 1076 850 995 769 963 882 113
1.294
1
3max
‘
(c) 4.28
‘
Advanced Topics in Shear Strength of Soils and Rocks Chapter 13
Problem 13-34 continued.
3500
4000
4500
5000
200.0
400.0
600.0
)
3000
4000
)
ESP
TSP
Advanced Topics in Shear Strength of Soils and Rocks Chapter 13
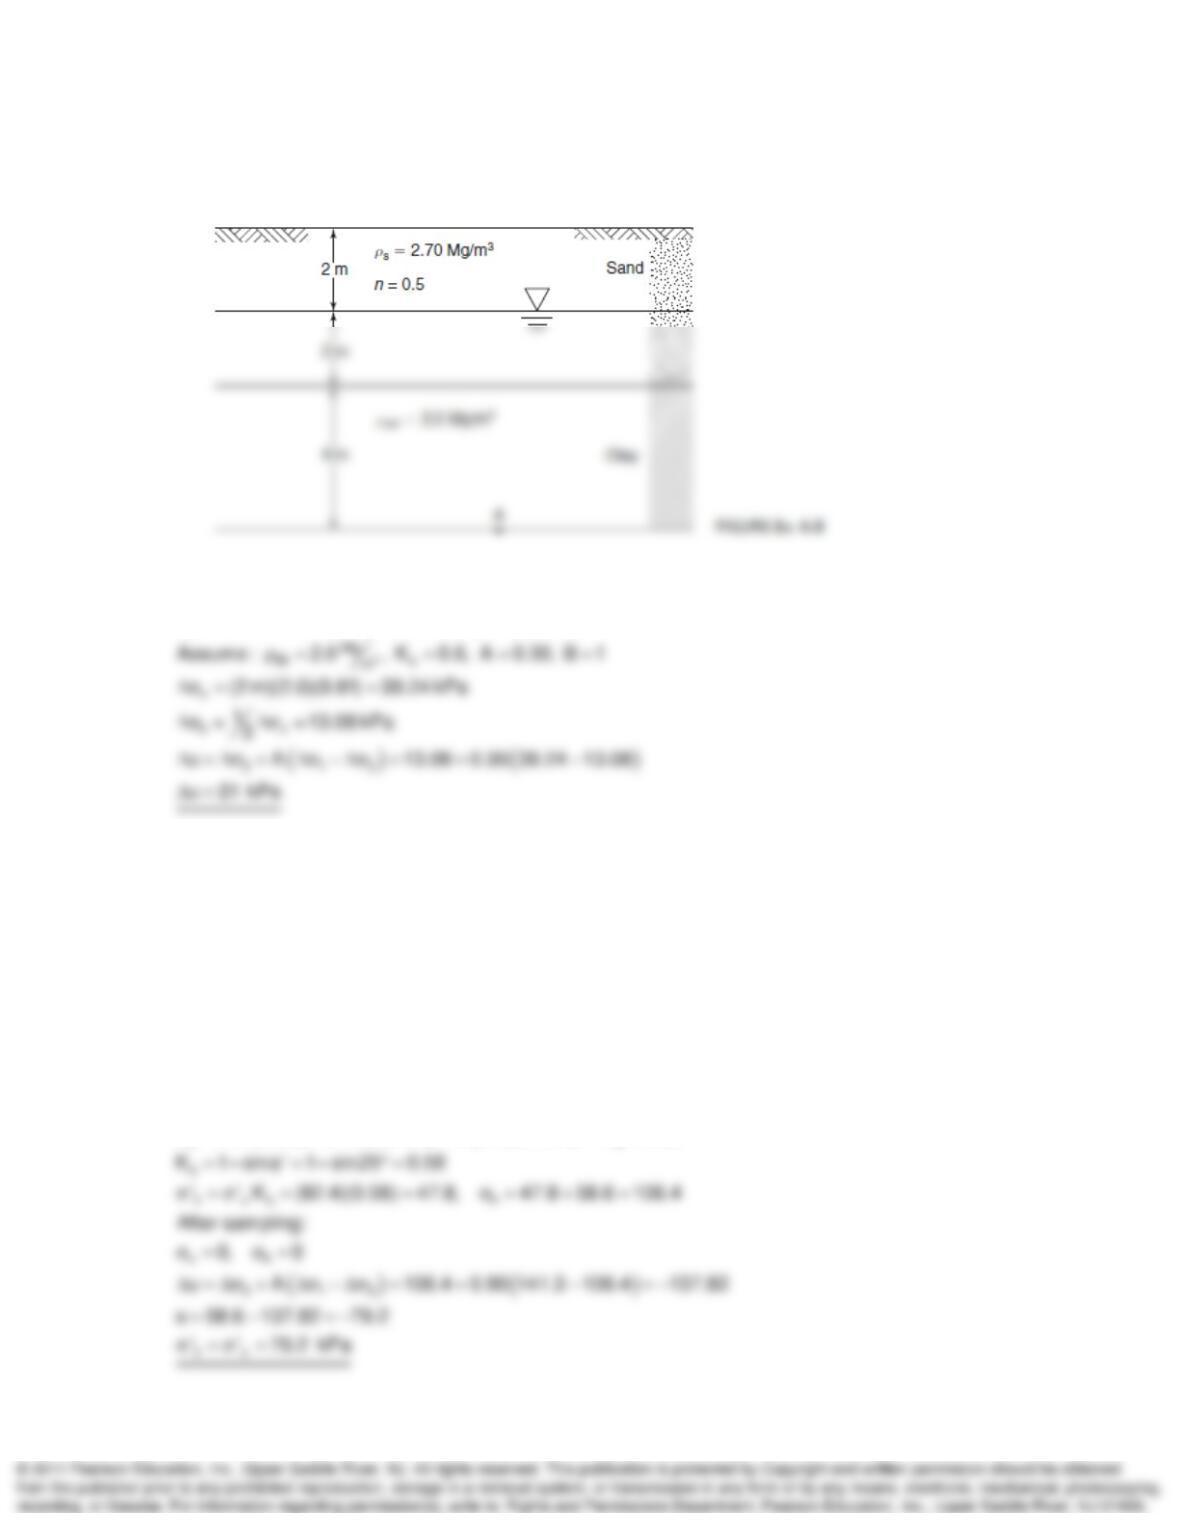
13-43. A 2-m-thick fill is constructed at the surface of the soil profile of Example 6.8. If the clay is
slightly overconsolidated, estimate the change in pore pressure at point A of Fig. Ex. 6.8.
SOLUTION:
vv
141.3 kPa, u 58.9 kPa, ‘ 82.4 kPa
13-44. A soil sample is taken from the midpoint of the clay layer of Example 6.8—that is, from a
depth of 6 m. If the pore pressure parameter Au for unloading is 0.90, estimate the effective
vertical and horizontal stresses acting on the sample just before testing in the laboratory. Assume
’ for the clay is 25 deg. (Hint: Draw elements with stresses similar to Fig. 12.36, and use the
definition of stress increments in Appendix B.3.) (After G.A. Leonards.)
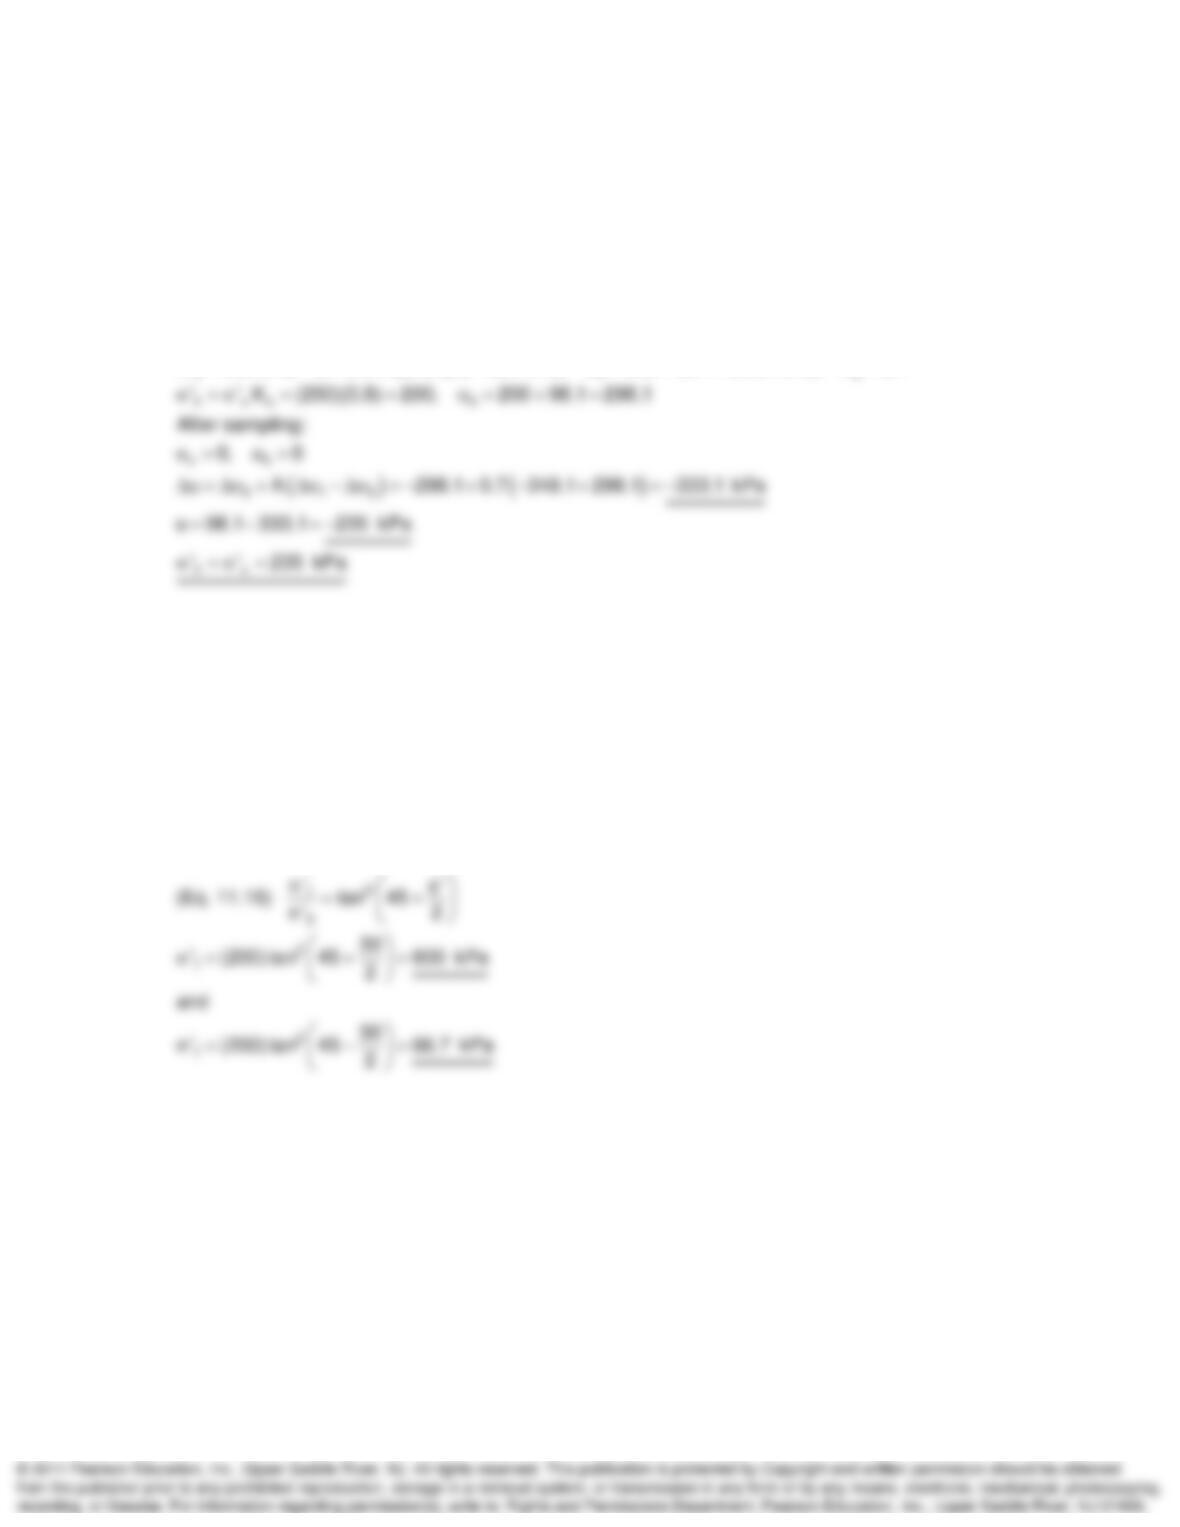
SOLUTION:
vvu
Before sampling:
141.3 kPa, u 58.9 kPa, ‘ 82.4 kPa, A 0.30
Advanced Topics in Shear Strength of Soils and Rocks Chapter 13
13-46. A sample of normally consolidated clay is removed from -10 m below the ground surface.
The effective vertical overburden stress is 250 kPa, and Ko is 0.8. If the pore pressure parameter
due to sampling is 0.7, estimate the change in pore pressure in the sample when it is removed
from the clay layer. What effective stresses act on the specimen after extrusion from the sample
tube? Assume the groundwater table is at the surface.
SOLUTION:
vvu
Before sampling:
‘ 250 kPa, u (10 m)(9.81)(1) 98.1kPa, 250 98.1 348.1kPa, A 0.7
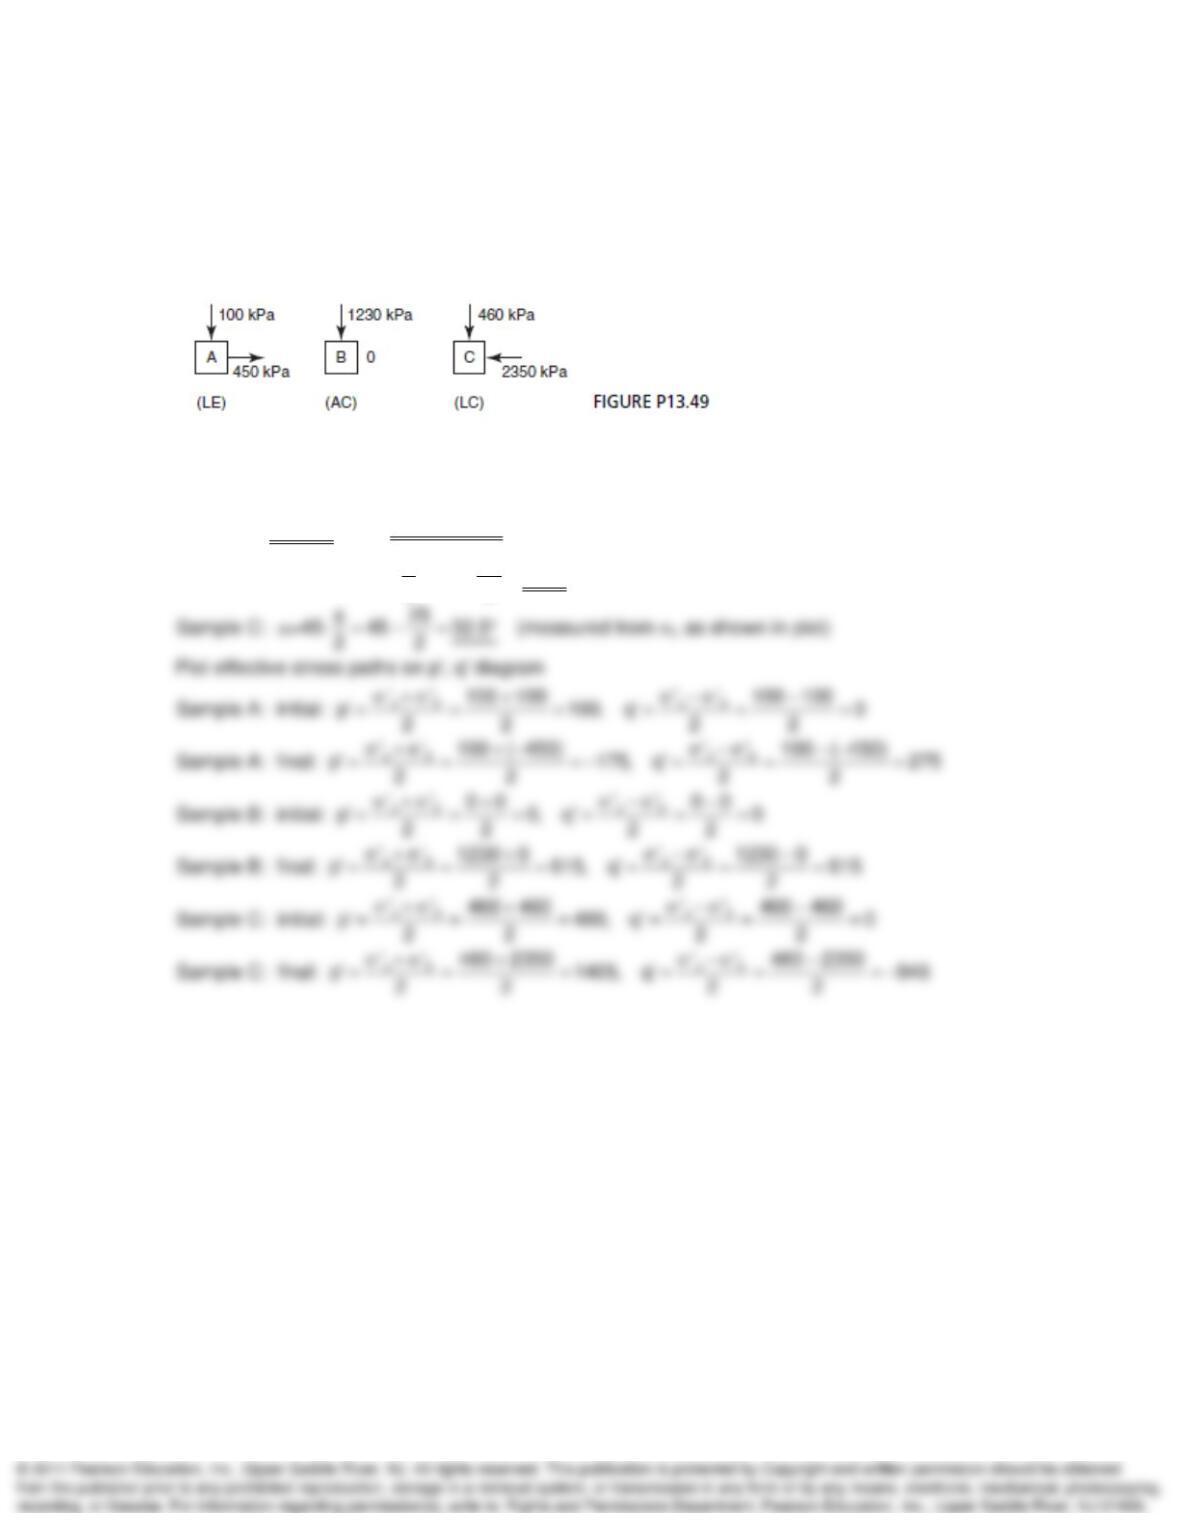
13-48. A normally consolidated clay has a
’ of 30o. Two identical specimens of this clay are
consolidated to 200 kPa in a triaxial cell. Predict the maximum and minimum possible axial
stresses in the specimens for a constant cell pressure. (Hint: The first test is an axial compression
test, the second test is an axial extension test.)
SOLUTION:
o
3
‘ 200 kPa, ‘ 30
Advanced Topics in Shear Strength of Soils and Rocks Chapter 13
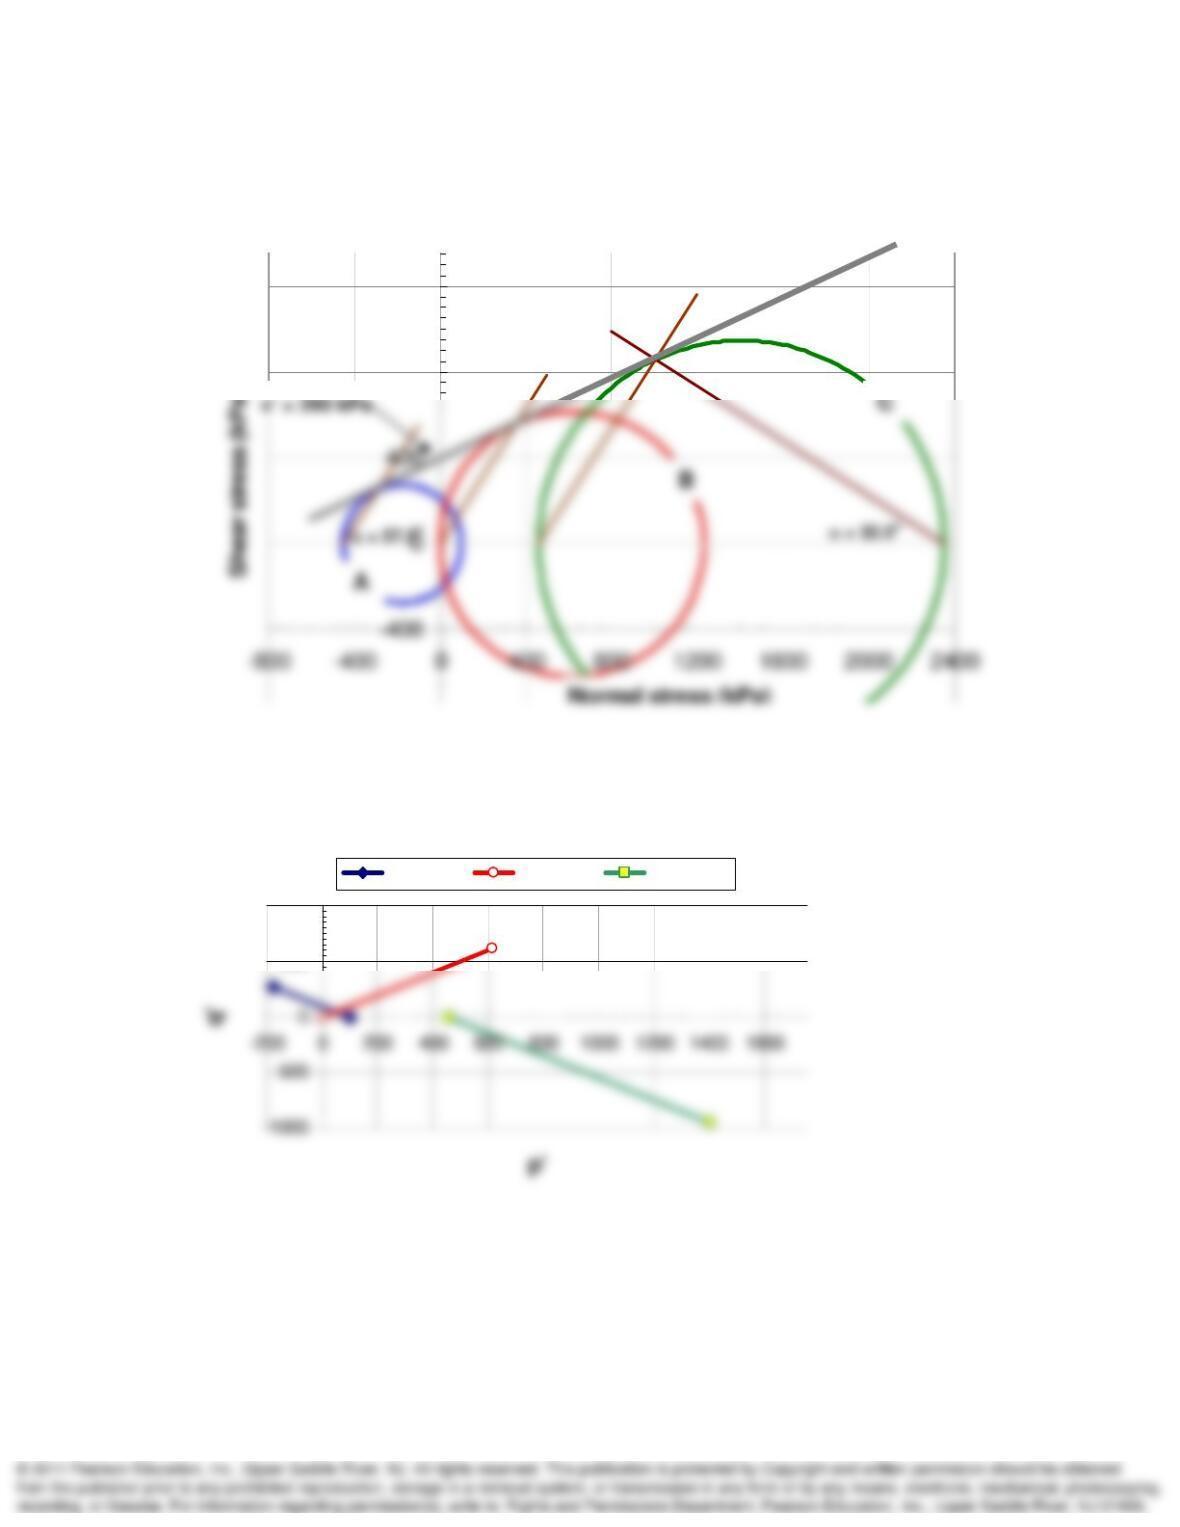
13-49. The effective stresses at failure for three identical triaxial specimens of an
overconsolidated clay are shown in Fig. P13.49. Plot the Mohr circles at failure and determine
’
and c’. Determine the theoretical angle of inclination of the failure planes in each test specimen,
and show these on a small sketch. Also sketch the effective stress paths for the three tests. (After
C.W. Lovell.)
SOLUTION:
From plot, ‘ 25 and c ‘ 390 kPa
25
Samples A and B: =45+ 45 57.5
22
continued on next page
Advanced Topics in Shear Strength of Soils and Rocks Chapter 13
Problem 13-49 continued.
800
1200
)
500
1000
Sample A Sample B Sample C
= 57.5o
‘ = 25o
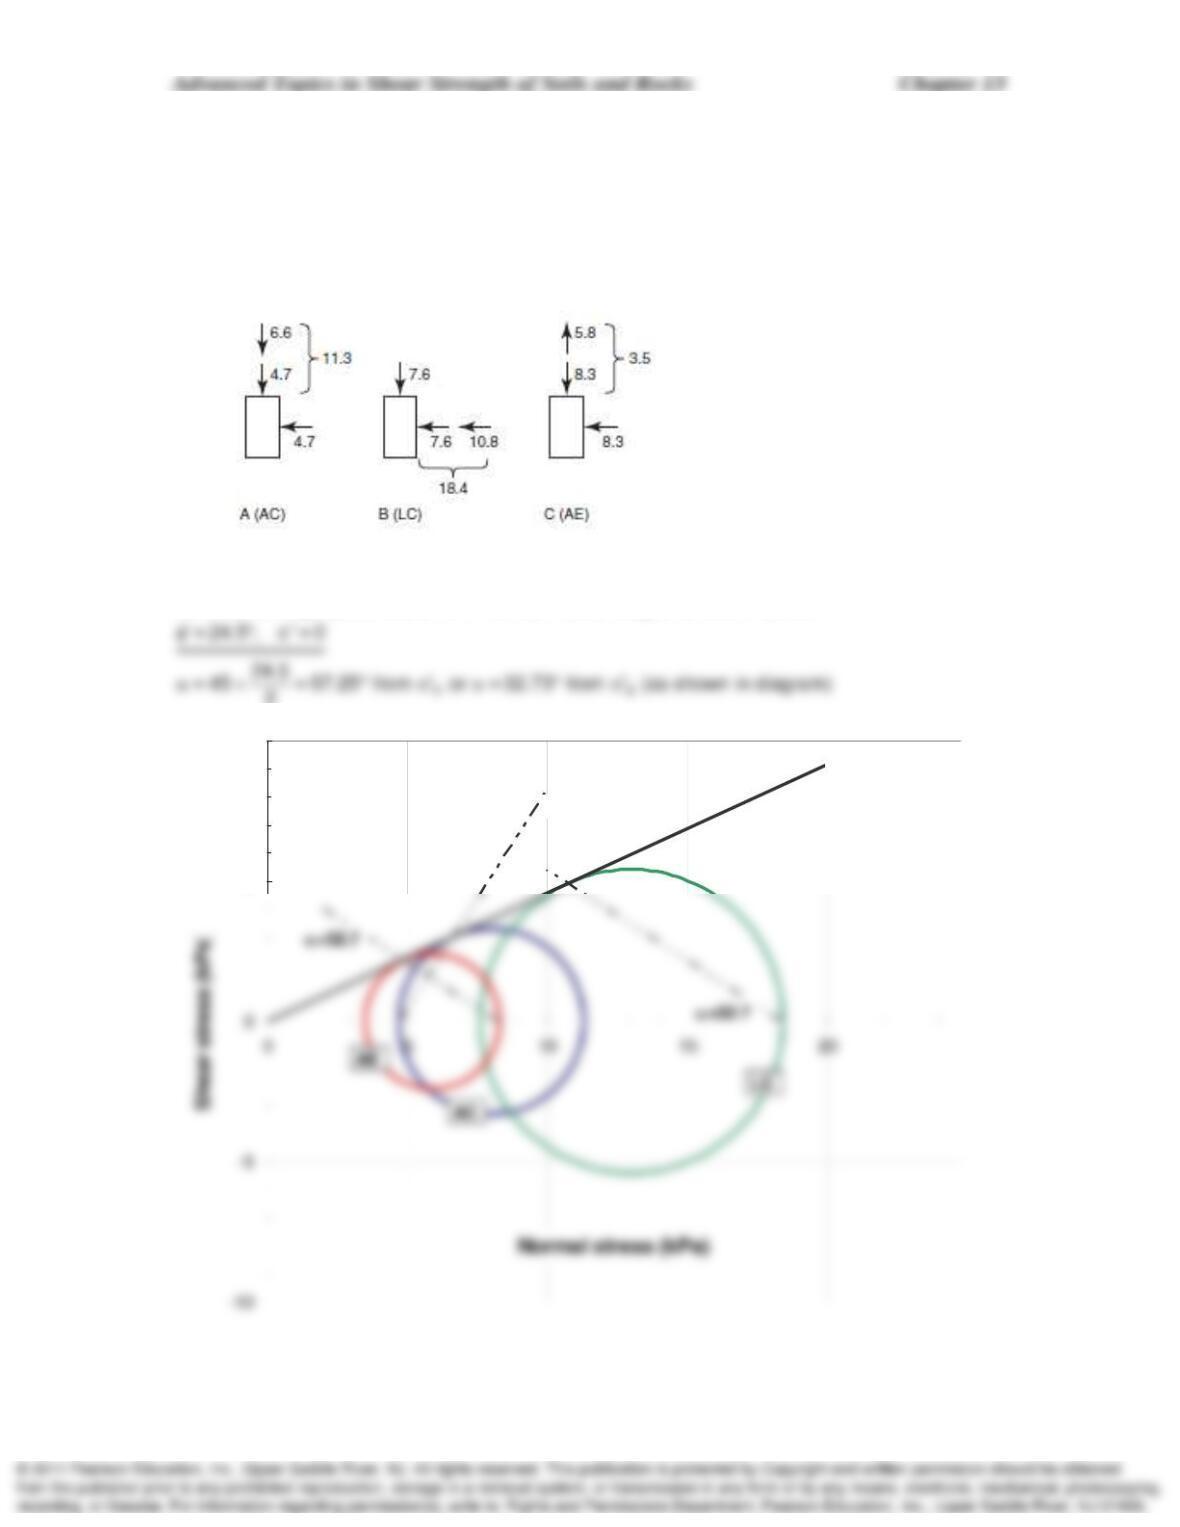
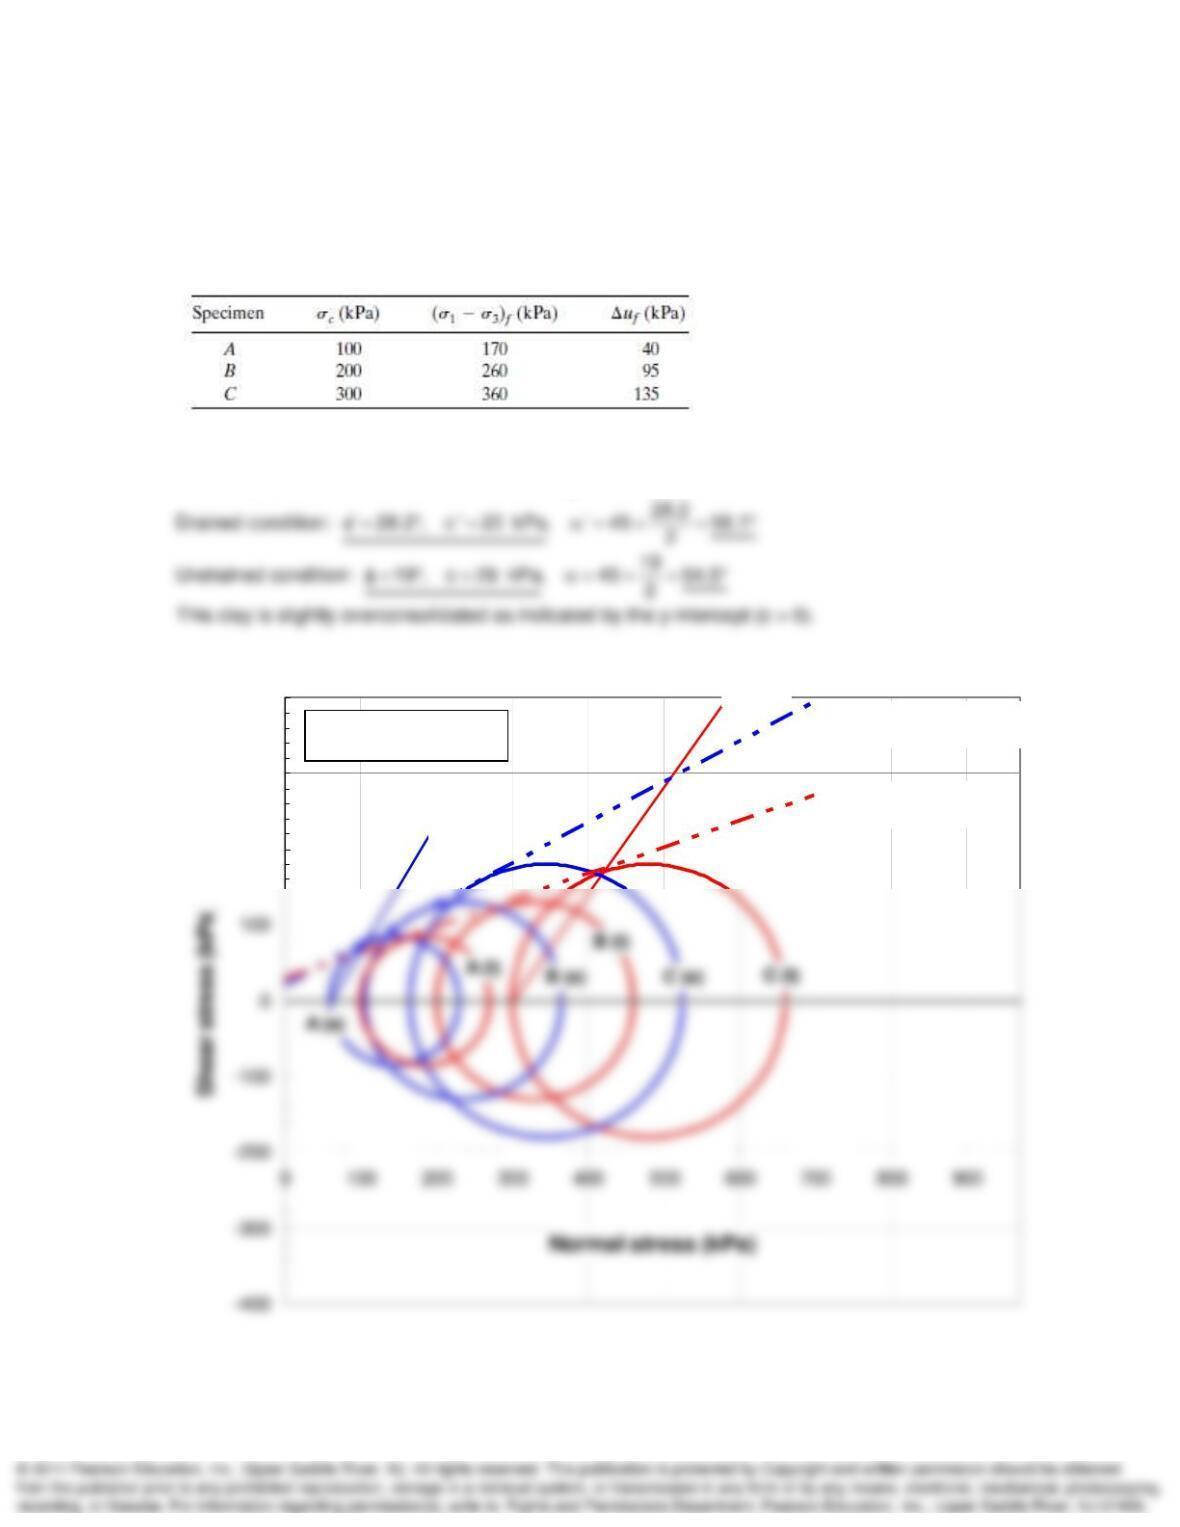
13-50. Three identical specimens (same e, w) of a clay are normally consolidated and sheared
consolidated-drained (CD) in both compression and extension. The stresses at failure for the
three specimens are as shown in Fig. P13.50. (a) Plot the Mohr circles at failure, and determine
’ and
T (b) Determine the inclination of the predicted failure planes (from the Mohr failure
hypothesis). Sketch the failed specimens, showing their failure planes. (c) Sketch the three stress
paths. (After C.W. Lovell.)
SOLUTION:
Estimate strength parameters from the Mohr Circle diagrams shown below.
2
5
10
‘ = 24.5
=57.3
Advanced Topics in Shear Strength of Soils and Rocks Chapter 13
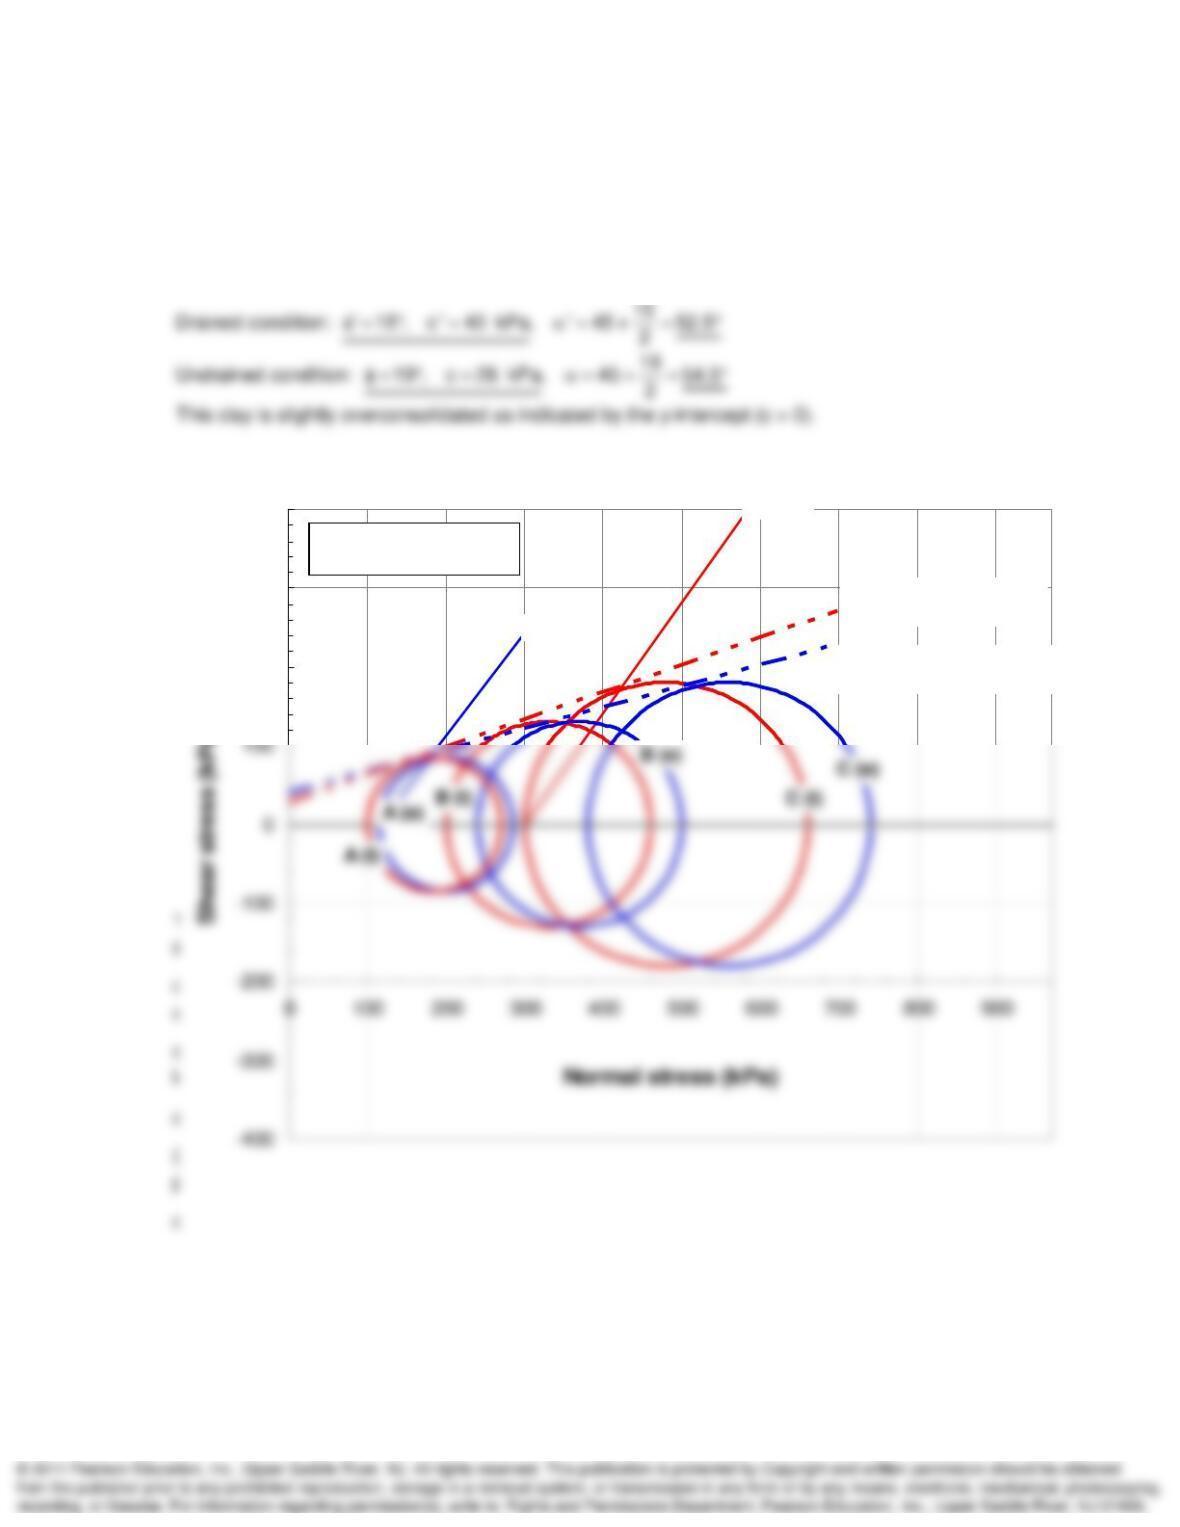
13-51. A series of conventional triaxial compression tests were conducted on three identical
specimens of a saturated clay soil. Test results are tabulated below. (a) Sketch the total and
effective stress paths for each test, and determine the Mohr–Coulomb strength parameters in
terms of both total and effective stresses. (b) Estimate the theoretical angle of the failure planes
for each specimen. (c) Do you believe this clay is normally or overconsolidated? Why?
SOLUTION:
Estimate parameters from the Mohr Circle diagrams shown below.
200
300
400
blue ==> effective stress
red ==> total stress
= 19 deg, c = 28 kPa
(undrained)
‘ = 28.2 deg, c’ = 20 kPa
(drained)
‘ = 59.1
= 54.5
Advanced Topics in Shear Strength of Soils and Rocks Chapter 13
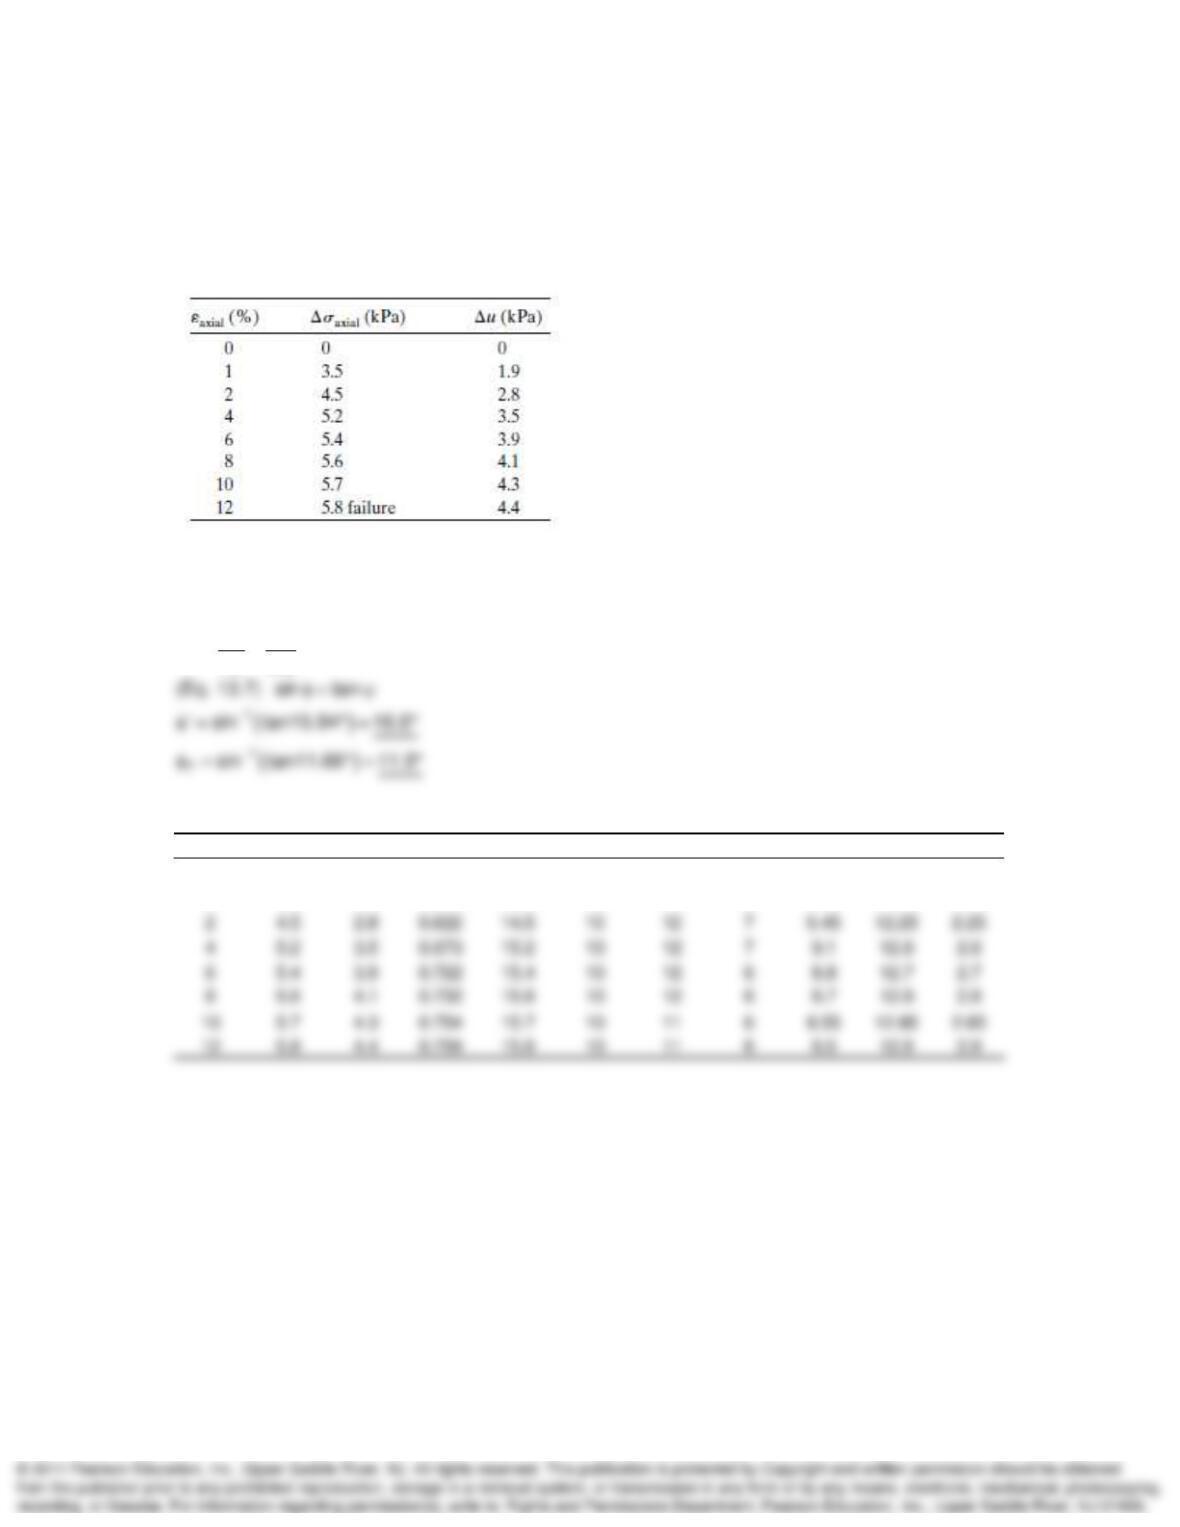
13-52. Assume that the induced pore pressures at failure for Problem 13.51 were: specimen A, –
15 kPa; specimen B, -40 kPa; and specimen C, -80 kPa; and that everything else was the same.
Now do parts (a) and (b) above, and then answer part (c).
SOLUTION:
Estimate parameters from the Mohr Circle diagrams shown below.
200
300
400
)
blue ==> effective stress
red ==> total stress
= 19 deg, c = 28 kPa
(undrained)
‘ = 15 deg, c’ = 40 kPa
(drained)
‘ = 52.5
= 54.5
Advanced Topics in Shear Strength of Soils and Rocks Chapter 13
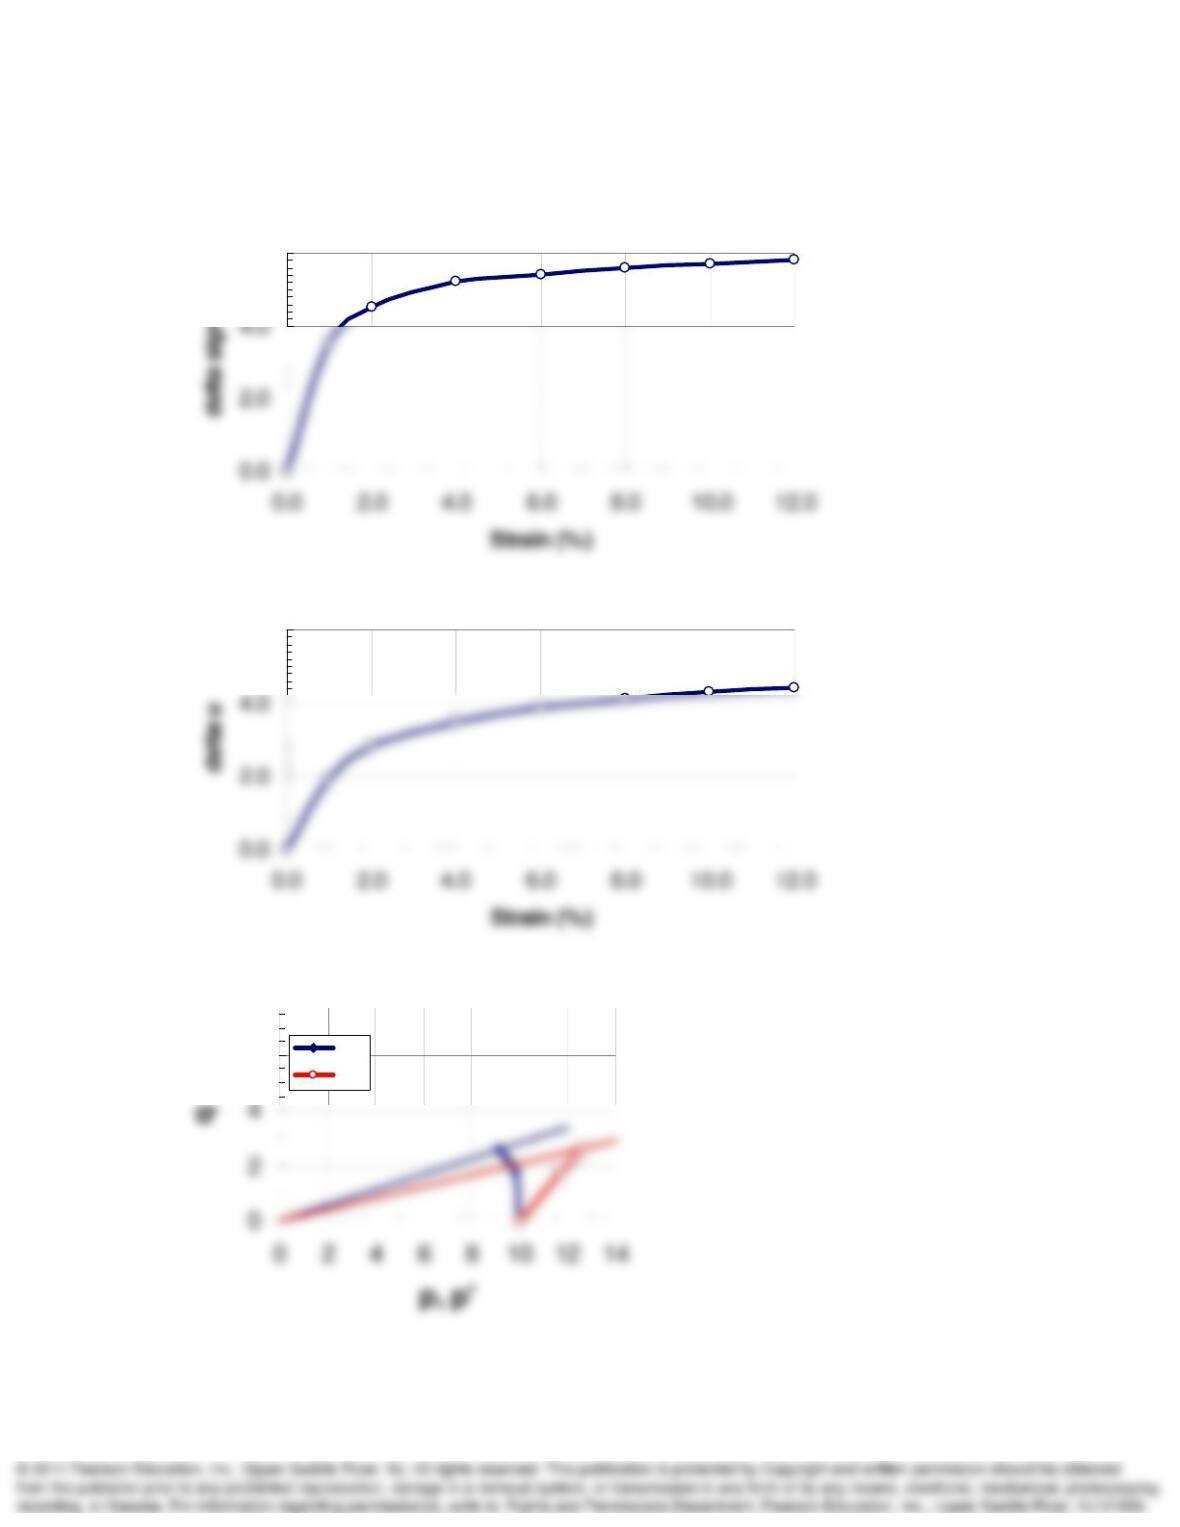
13-54. The following data were obtained from a conventional triaxial compression test on a
saturated (B = 1), normally consolidated simple clay (Ladd, 1964). The cell pressure was held
constant at 10 kPa, while the axial stress was increased to failure (axial compression test). (a)
Plot the
and
u versus axial strain curves. Determine Af. (b) Plot the total and effective stress
paths for the AC test. (c) What is
’ (Assume c’ = 0 for normally consolidated clay.)
SOLUTION:
f
u4.4
A0.76
5.8
(%) (
1
–
3
)uA
1
3
‘
1
‘
3
p’ p q
0 0 0 0 10 10 10 10 10 10 0
1 3.5 1.9 0.543 13.5 10 12 8 9.85 11.75 1.75
Continued on next page.
Advanced Topics in Shear Strength of Soils and Rocks Chapter 13
Problem 13-54 continued.
6.0
a
6.0
6
ESP
TSP
Advanced Topics in Shear Strength of Soils and Rocks Chapter 13
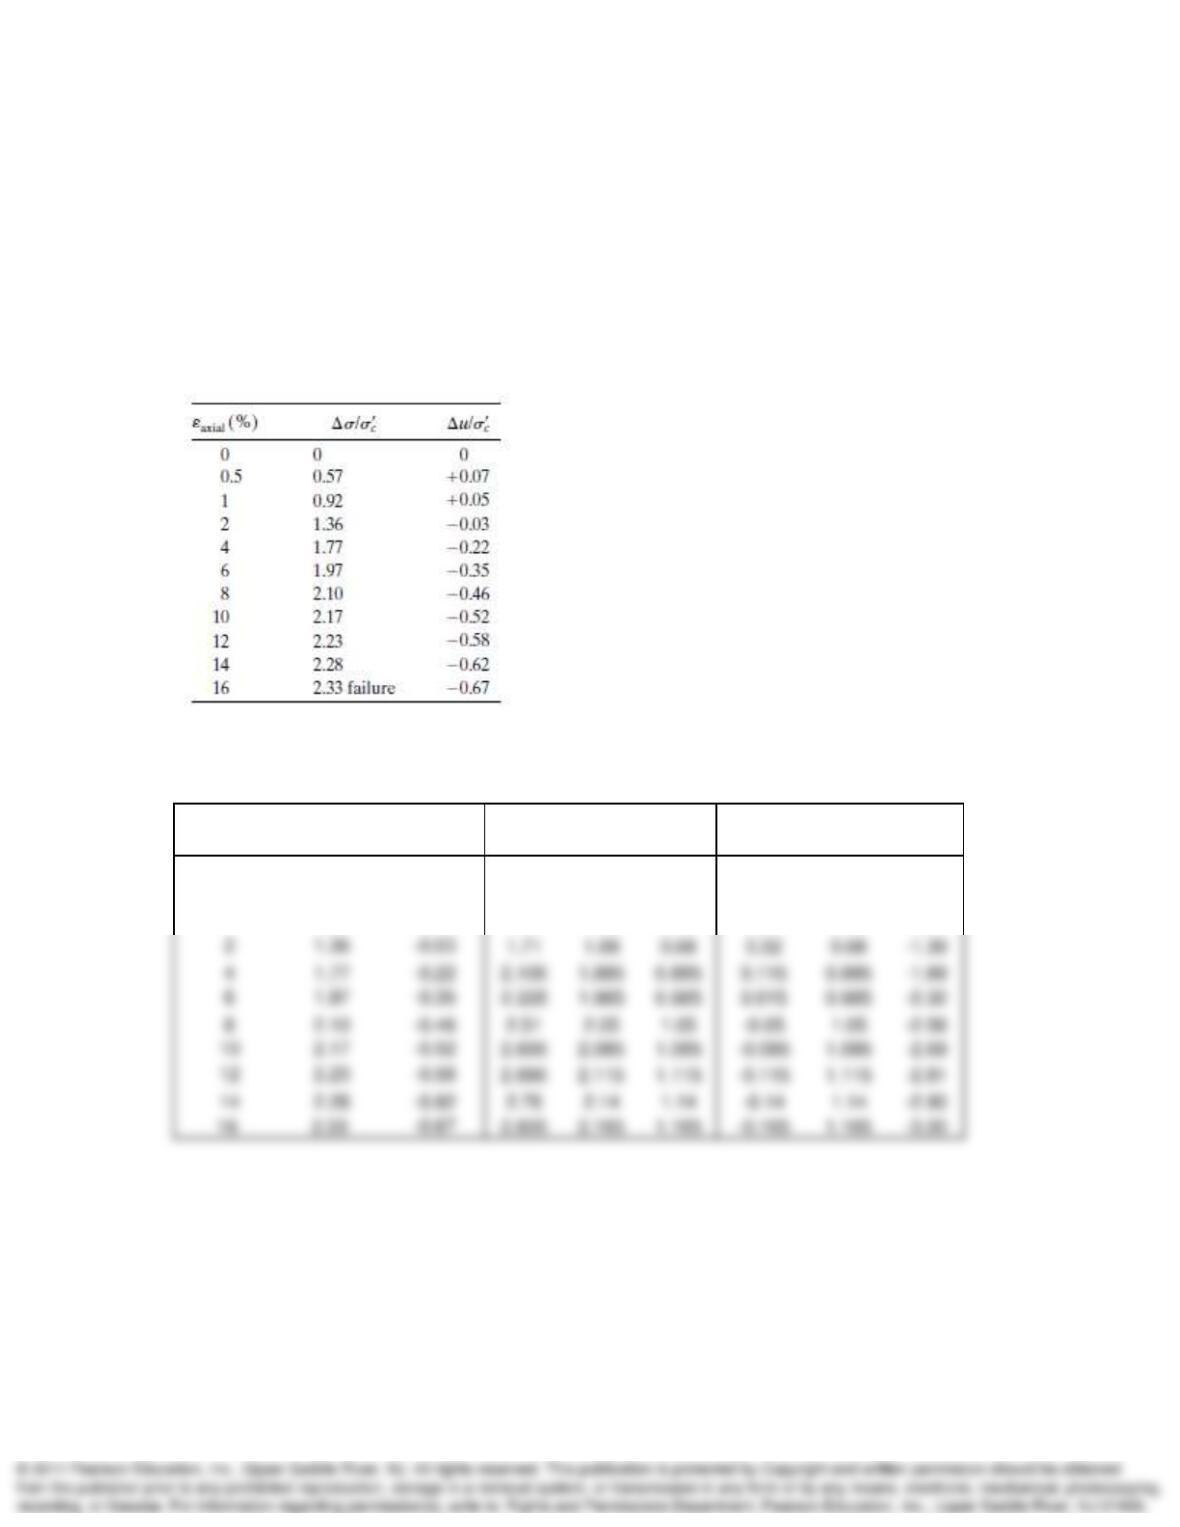
13-55. A conventional triaxial compression (AC) test was conducted on a saturated sample of
overconsolidated clay, and the following data, normalized with respect to the effective confining
pressure, were obtained. A lateral extension (LE) test was conducted on an identical specimen of
the same clay. While the vertical stress was maintained constant, the cell pressure was
decreased until failure occurred at the same principal stress difference as the AC specimen
(
/
’c = 2.33). From your knowledge of stress paths and soil behavior, determine (a) the
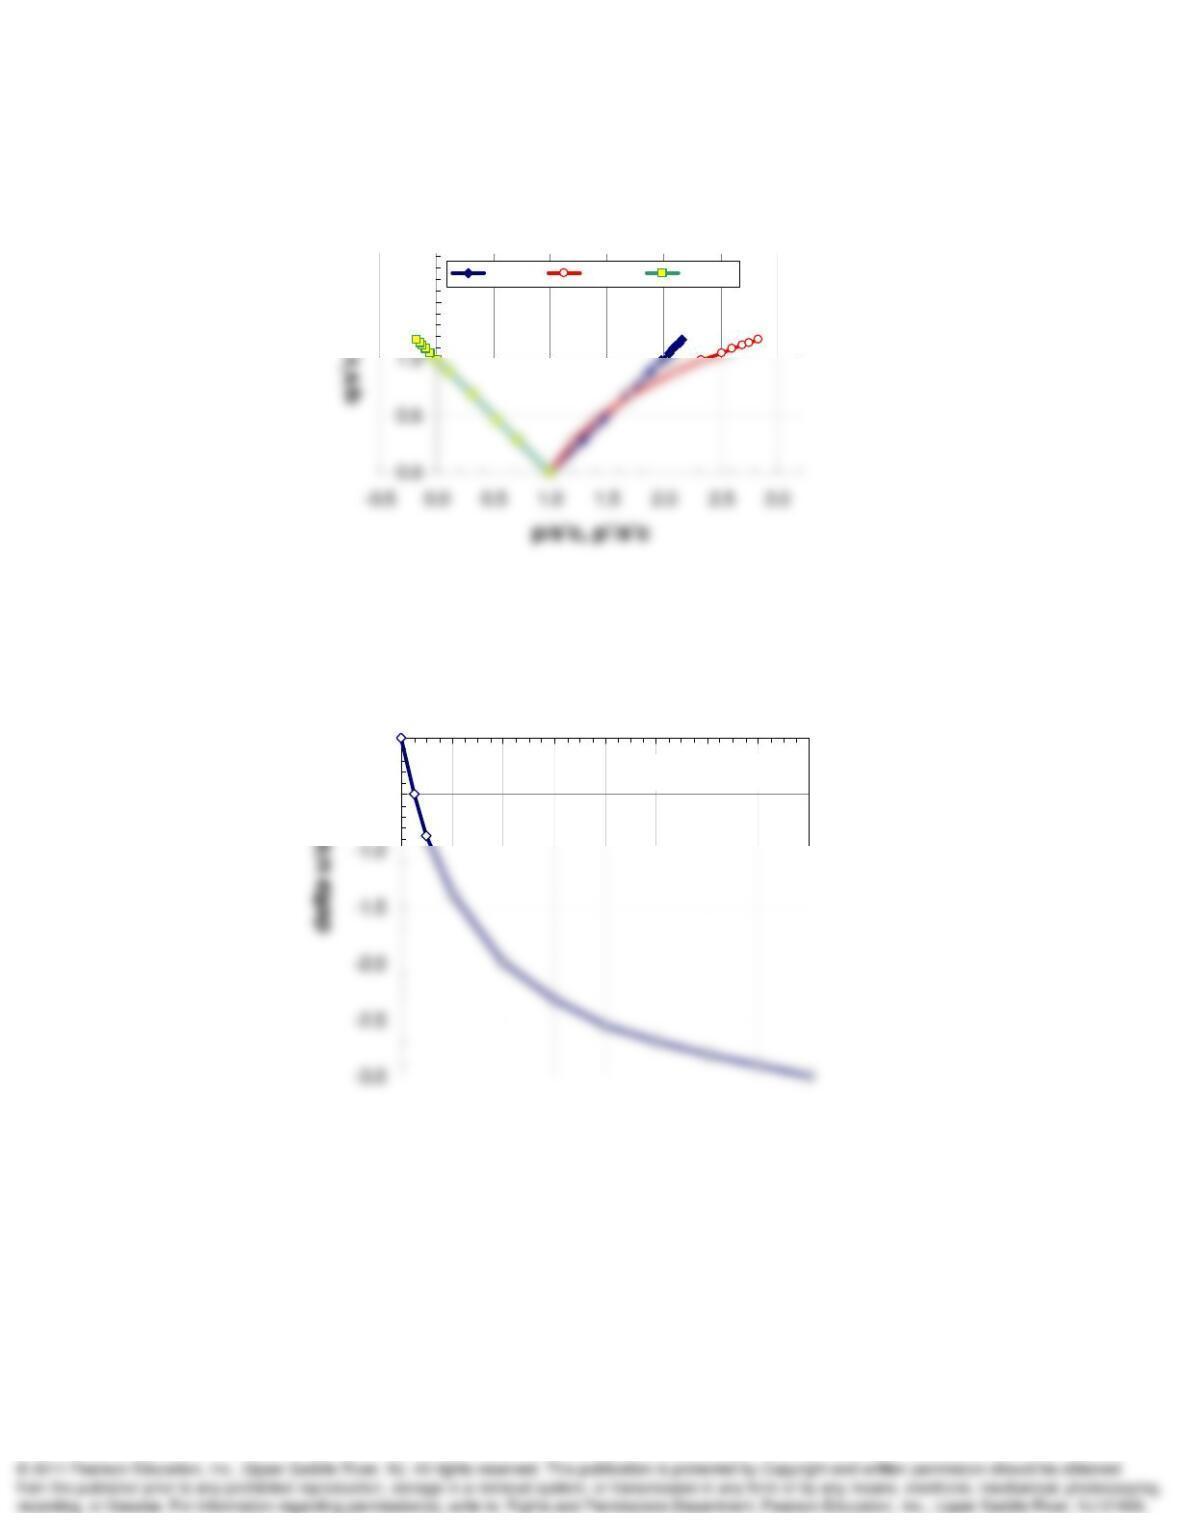
effective and total stress paths for both tests and (b) the pore pressure versus strain response of
the LE test. (c) Can the Mohr–Coulomb strength parameters be determined? Why? (After C.W.
Lovell.)
SOLUTION:
strain (%) ‘
c
u‘
c
p’/‘
c
p/‘
c
q/‘
c
p/‘
c
q/‘
c
u‘
c
0 0 0 110 1 00
0.5 0.57 +0.07 1.215 1.285 0.285 0.715 0.285 -0.50
1 0.92 +0.05 1.41 1.46 0.46 0.54 0.46 -0.87
AC Test LE Test
Continued on next page.
Advanced Topics in Shear Strength of Soils and Rocks Chapter 13
Problem 13-55 continued.
1.5
AC TSP AC ESP LE TSP
LE Triaxial Test
-0.5
0.0
0.0 2.0 4.0 6.0 8.0 10.0 12.0 14.0 16.0
Strain (%)
c