13-1
DairyPak
Teaching Commentary
OVERVIEW
This case is a fairly simple, straightforward exercise in creating a value chain (for the paper milk carton industry) and in
using it to facilitate managerial decision making (product emphasis, customer emphasis, capital expenditure analysis,
make/buy analysis).
The value chain concept has been discussed in the strategy literature since at least 1980. As a generic concept
ANSWERS TO ASSIGNMENT QUESTIONS
Question 1
Calculational Difficulties
I do not wish to imply that constructing a value chain for a firm is easy. There are several thorny
problems to confront: calculating a value for intermediate products, isolating key cost drivers, identifying linkages
across activities, and computing supplier and customer margins.
The analysis starts by segmenting the chain into those components for which some firm somewhere does make
Part of the “art” of strategic analysis is deciding which stages in the value chain can meaningfully be decoupled,
conceptually, and which cannot. Unless some firm somewhere has decoupled a stage by making a market at that stage,
one cannot independently assess the economic profit earned at that stage. But the opportunities for meaningful analysis
across a set of firms that have defined differently what they make versus what they buy and sell are often very
13-2
A PROCESS FLOW VALUE CHAIN
REGIONAL DAIRY BRANDED OJ
Milk OJ MM/CH Tropicana
Consumer Pays $1.16 $1.50 $1.89 $2.26
Per Ton Per Ton
Price to Processor $1,152 $864
Converter Margin 318 30
Freight to Processor 10 10
Converter Cost 231 231
*Estimated Market Value Transfer Prices. The
converting operations have a “true” market price for sales
to the processors. But how can we approximate “value”
for intermediate products? Uncoated board is transferred
internally from the mill to the extruder and coated board
ESTIMATING A MARKET PRICE FOR COATED BOARD
(Extruder to Converter)
We exported 32,000 tons of Coated Board in 1987
Per Ton
Selling Price (Exhibit 5) $577
Approximated market price between Extruder and Converter for
Coated Board
Per Ton
Mill cost $424
Freight to Extruder 3
Extruder Cost 94
In 1987, we sold 10,000 tons of uncoated board domestically
and exported 12,000 tons.
Per Ton
Selling Price (Exhibit 5) $530
Margin (as above) 59
Approximated Market Price $486
Question 2
Total $3,379 $7,555 $10,435
CHAMPION % 11% 5% 0.6%
New Insights? Does the information based on
value chain analysis lead to new insights? We believe it
13-3
DairyPak realized $355 (11% of the total value). In sharp
contrast, in the differentiated processor segment,
DairyPak’s share of the total profit in the chain is only
.6%! The buyer power in the differentiated segment is
There is no particular reason, ex ante, to believe
that 11% of the overall profit in the commodity segment
is a “reasonable” or “unreasonable” share for the carton
manufacturer versus the processor or the retailer. But
whatever the share is for the carton manufacturer in the
commodity segment, the share should be higher in the
Question 3
Estimated Asset Investment. Assets per ton of
board at each value activity are estimated using current
replacement costs and assuming full utilization of
capacity. Current replacement costs were estimated from
discussions with plant engineers and equipment vendors.
Tons of production at full capacity were estimated from
differentiated segment.
From a conventional BCG-grid (Exhibit A,
here), the differentiated processor segment would look
extremely attractive. But based on the value chain
analysis, this market looks much less attractive. The
differentiated processors have enormous leverage (buyer
processors are willing to share some of their profit in
order to entice an investment by a new competing
supplier).
EXHIBIT A
RETURN ON ASSETS PER TON OF BOARD
REGIONAL DAIRY BRANDED OJ
MILK OJ
Margin Assets ROA Margin Assets ROA Margin Assets ROA
Store* $1,728 $1,800 96% $4,320 $1,800 240% $6,768 $1,800 376%
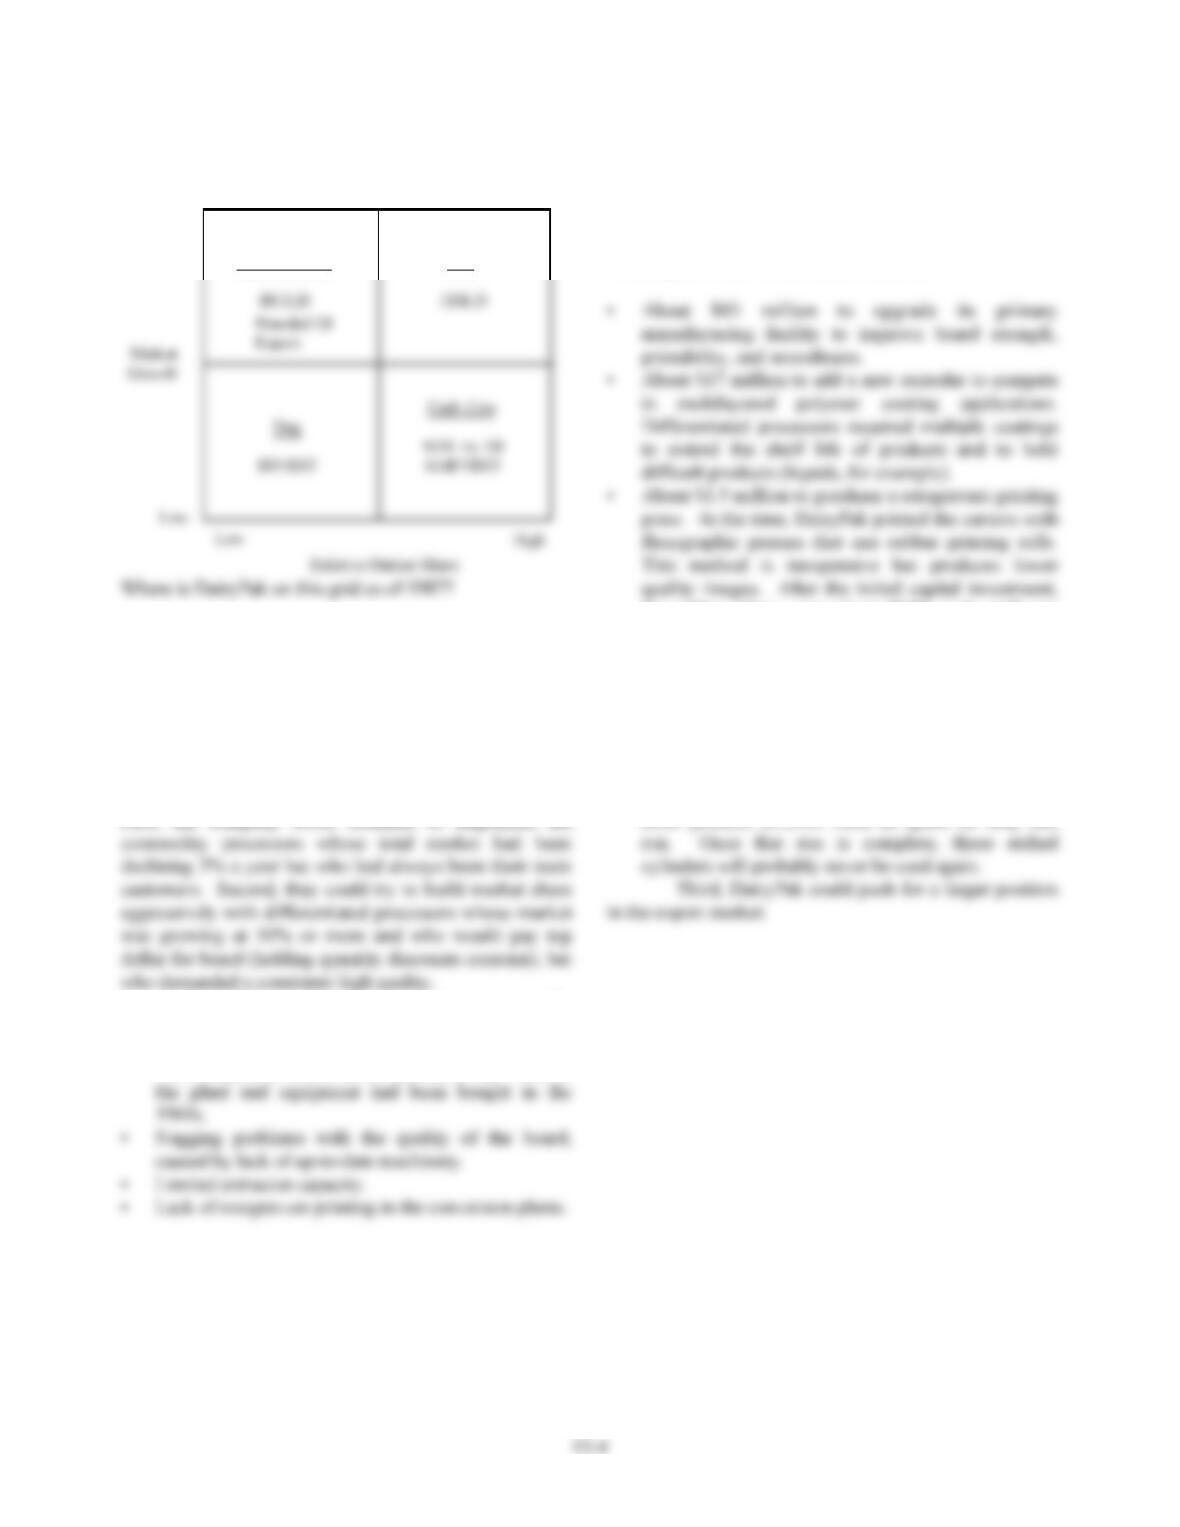
Boston Consulting Group Grid
High
Question Mark
Star
• Regional Dairy Segment?
• Branded OJ Segment?
• Export Market?
Question 4
On the choice of market segments, DairyPak
considered three specific alternatives (see Exhibit B here).
First, the company could continue to emphasize the
DairyPak recognized its weaknesses vis-à-vis the
differentiated segment:
• Technologically obsolescent manufacturing. Most of
Their low market share in the differentiated
segment reflected their status as largely a “backup”
supplier. Major capital investments (a total of $61.5
million) had to be made if DairyPak was serious about
rebuilding market share in this fast-growing segment.
Three specific new investments would be:
the rubber plates cost about $150 each, with six
needed for a standard six-color process. Although
the quality was not as good as with rotogravure
printing, the commodity processors had never
required high quality printing. Rotogravure printing
uses etched metal printing rolls and gives an
extremely precise and high quality finish, but it is
expensive. After the initial capital expense, each
etched metal printing plate costs $2,500. With a six–
color process, $15,000 must be spent for only one
13-5
EXHIBIT B
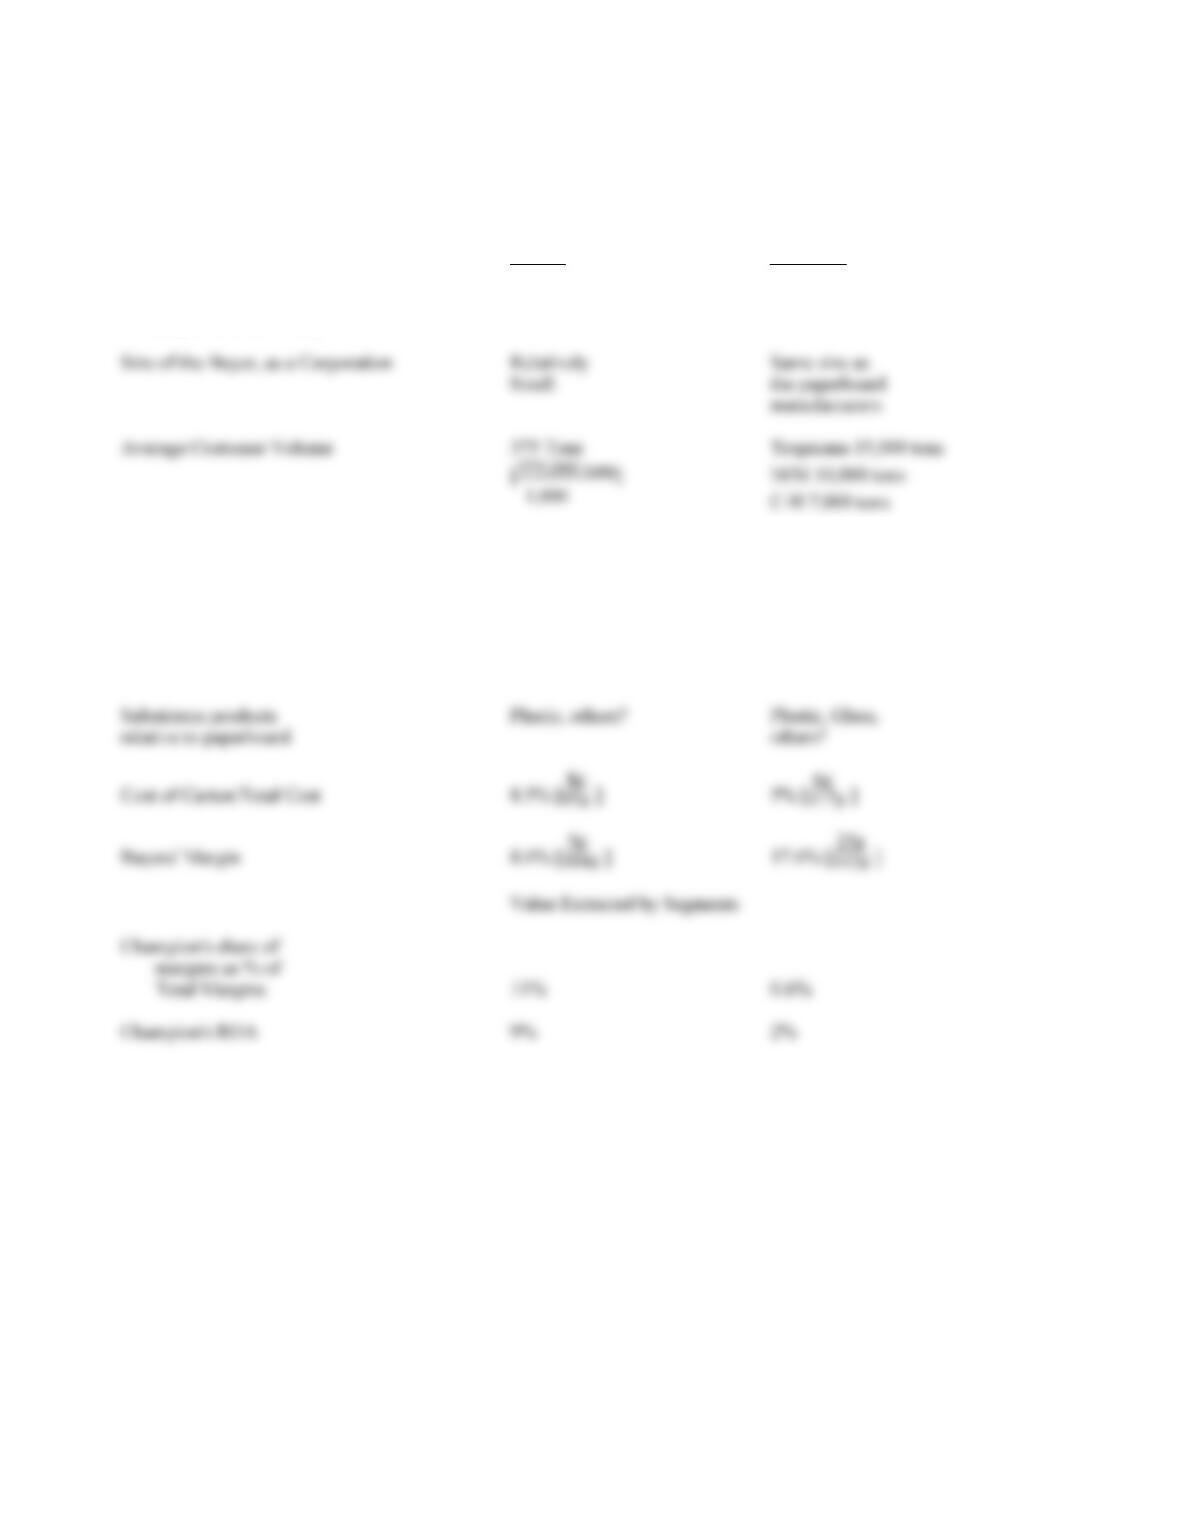
1. Commodity Dairies
Overall Size of the Market 375,000Tons
Opportunities
• Uncertain supply of plastics. This is a by-product for the oil companies.
2. Branded OJ Segment
New Growth in
Size of Annual Growth OJ Consumption Total
the Market in “Base” (5% of Base Growth
1987 Business (10%) Business) in Volume
Tropicana 15,000 tons 1,500 tons 750 tons 2,250 tons
Champion’s Potential Volume:
Is it worth the $62 million investment to chase this volume?
3. Export
Overall Size of the Market 1,112,000 Tons
13-6
EXHIBIT C
Capital Investment Analysis for DairyPak Projects
(Per Internal Documents)
All Numbers Disguised
Differentiated Segment
Capital investments needed in Year 0:
Annual Cash Flows:
Profit per ton 302
Total market (differentiated segment) = 400,000 tons
Additional Volume 48,000 tons*
* (We ignore additional growth beyond Year 1, to be conservative.)
Total annual after-tax cash flows $11.16 million
Time horizon for the project = 10 years
13-7
Conventional Analysis of the Strategic Options
How should DairyPak’s senior executives
evaluate the marketing and investment options open to
them? Conventional capital expenditure requests, using
Another way to address these options would be
through the simple 22 growth/share matrix as originally
introduced by the Boston Consulting Group (Exhibit A,
here). Even though volume had been shrinking at 3% per
year over the past five years, the firm had maintained
market share at 40% in this large segment (375,000 tons
per year). This segment appears to be the classic “cash
cow” in the BCG terminology — “high market share with
low growth.” The strategic inference from the BCG grid
would be that DairyPak should “harvest” this commodity
within DairyPak at the time of the case. This point of
view was supported by formal financial analysis using
DCF techniques (Exhibit C, here), as indicated above. A
13% “real” return certainly argues for investing $61.5
Strategic Analysis – A Value Chain Perspective
Organizing the information in the value chain
framework provides a fundamentally different view of the
As noted:
• There are very few buyers in the differentiated
segment—fewer than ten versus more than 1,000 in
the commodity segment.
appeal, printability. Plastic poses a more significant
threat to coated board in the differentiated segment
since this segment values more highly the marketing
appeal of the package. This substitution threat sets a
cap on paperboard carton prices and a corresponding
cap on investment returns, once the overwhelming
buyer power is factored into the analysis.
Buyer power can be summarized as in Exhibit D here.
Overall, the value chain perspective yields a
your hand in the draw in a poker game. Do you put more
money in the pot, even if you know you have a bad hand?
Do you fold? Or do you stay in as long as possible
without adding much to the pot?
structural and executional drivers of cost behavior for
the major cost items in the mill, extruder, and
converter operations. They then need to manage
these drivers better than the competitors. Staying in
the commodity segment is the only logical choice.
13-8
selling in the differentiated segment. Also, the
profitability at the mill is well below satisfactory
levels. A cost driver analysis at the mill and extruder
stages might go a long way in identifying profit
improvement opportunities. Such analysis is beyond
the scope of this case.
The SCM-value chain perspective thus extends
of their impact on the overall chain and the firm’s position
within it. For strategic decision making, cost analysis
today cannot afford to ignore this critical dimension.
TEACHING STRATEGY
I use this case to introduce value chain analysis in the
required course on managerial accounting. I assign it
13-9
EXHIBIT D
Buyer Power Analysis
Commodity Branded OJ
Dairies Producers
Number of Buyers 1,000 3
(buyer concentration)
Buyer Switching Costs Low. Buy com- High. Buy differen–
modity board tiated board
Ability to backward Nil. Do not buy Nil. Do not buy in
integrate into paper- in volume for a volume for a scale
board scale efficient efficient plant
plant
13–10
EXHIBIT E
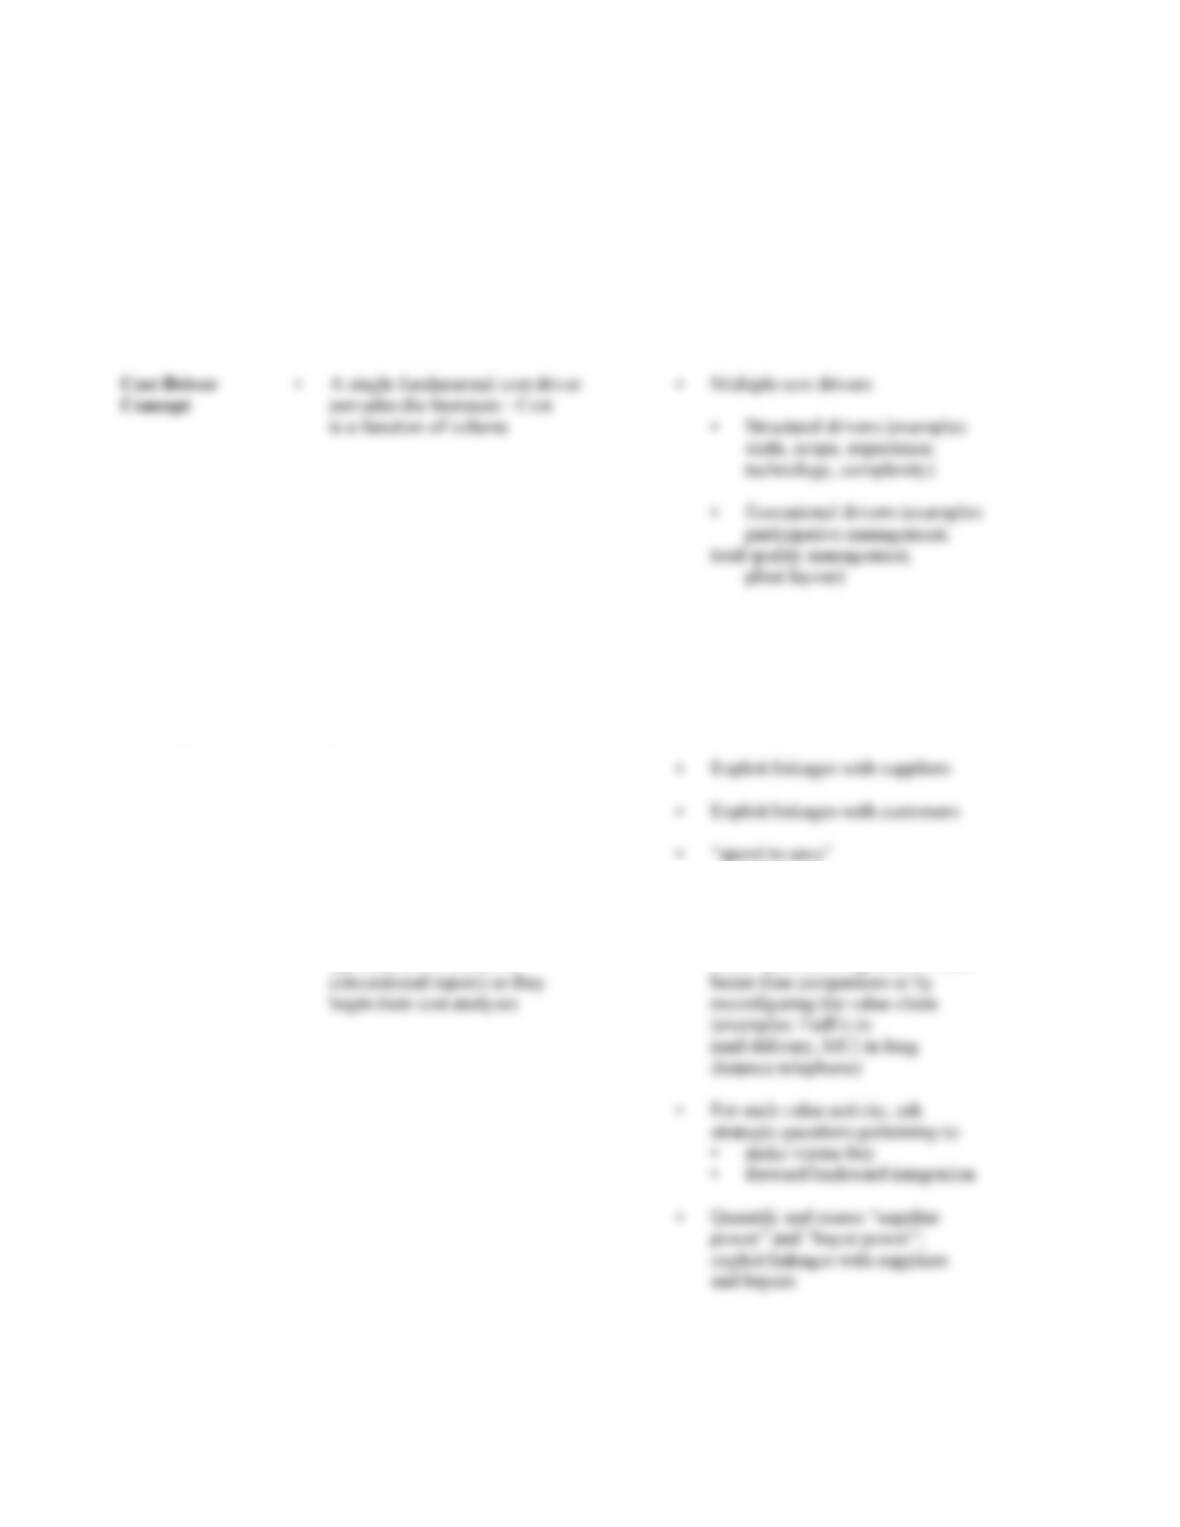
Traditional Management Value Chain Analysis in
Accounting the SCM Framework
Focus Internal External
Perspective Value-added Entire set of linked activities from
raw material suppliers to ultimate end use customers
• Applied too often, only at the • Each value activity has a set
overall firm level of unique cost drivers
Cost • Cost reduction approached via • Cost containment is a function
Containment responsibility centers or via of the cost driver(s) regulating
Philosophy product cost issues each value activity
Insights for None are readily apparent. This • Identify cost drivers at the
Strategic is a major reason why the individual activity level; develop
Decisions strategic consulting firms cost/differentiation advantage
typically throw away the either by controlling those drivers