Unlock document.
This document is partially blurred.
Unlock all pages and 1 million more documents.
Get Access
S-149
1. Due to an increase in consumer wealth, there is a $40 billion autonomous increase
in consumer spending in the economies of Westlandia and Eastlandia. Assuming that
the aggregate price level is constant, the interest rate is fixed in both countries, and
there are no taxes and no foreign trade, complete the accompanying tables to show
the various rounds of increased spending that will occur in both economies if the
marginal propensity to consume is 0.5 in Westlandia and 0.75 in Eastlandia. What do
your results indicate about the relationship between the size of the marginal propen-
sity to consume and the multiplier?
Incremental Total
change change
Rounds in GDP in GDP
1 ⌬C = $40 billion ?
Westlandia
Income and Expenditure 11
CHAPTER
KrugWellsECPS4e_Macro_CH11.indd S-149KrugWellsECPS4e_Macro_CH11.indd S-149 1/29/15 8:07 AM1/29/15 8:07 AM

Solution
Solution
S-150 CHAPTER 11 INCOME AND EXPENDITURE
1. The accompanying tables clearly show that the larger the marginal propensity to con-
sume, the larger the size of the multiplier. In Westlandia, with the marginal pro-
pensity to consume of 0.5, the multiplier equals 2. In Eastlandia, with the marginal
propensity to consume of 0.75, the multiplier equals 4.
Westlandia
Eastlandia
2. Assuming that the aggregate price level is constant, the interest rate is fixed, and there
are no taxes and no foreign trade, what will be the change in GDP if the following
events occur?
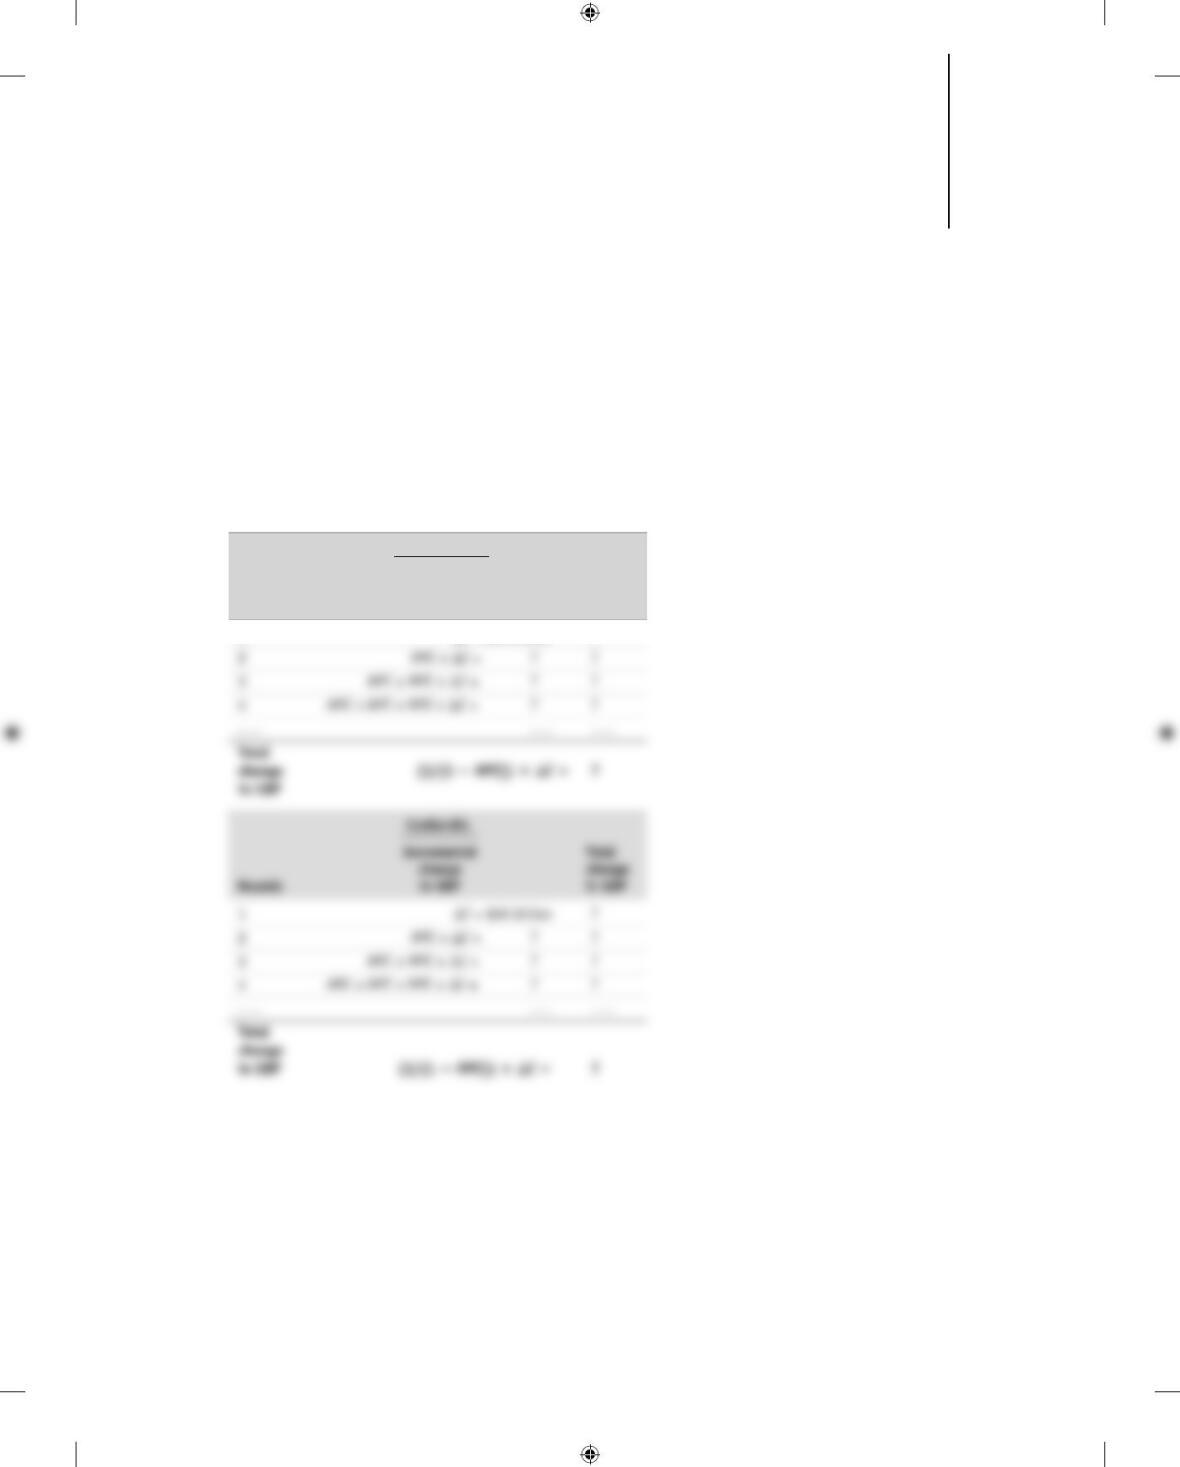
2. a. An autonomous increase in consumer spending of $25 billion, with a marginal
propensity to consume of 2/3, will increase GDP by $75 billion:
Total change in GDP = (1/(1 − MPC)) × ⌬C
Incremental Total
change change
Rounds in GDP in GDP
1 ⌬C = $40 billion $40 billion
Incremental Total
change change
Rounds in GDP in GDP
1 ⌬C = $40 billion $40 billion
in GDP
KrugWellsECPS4e_Macro_CH11.indd S-150KrugWellsECPS4e_Macro_CH11.indd S-150 1/29/15 8:07 AM1/29/15 8:07 AM
Solution
CHAPTER 11 INCOME AND EXPENDITURE S-151
b. If firms reduce investment spending by $40 billion and the marginal propensity to
consume is 0.8, GDP will fall by $200 billion:
Total change in GDP = (1/(1 − MPC)) × ⌬I
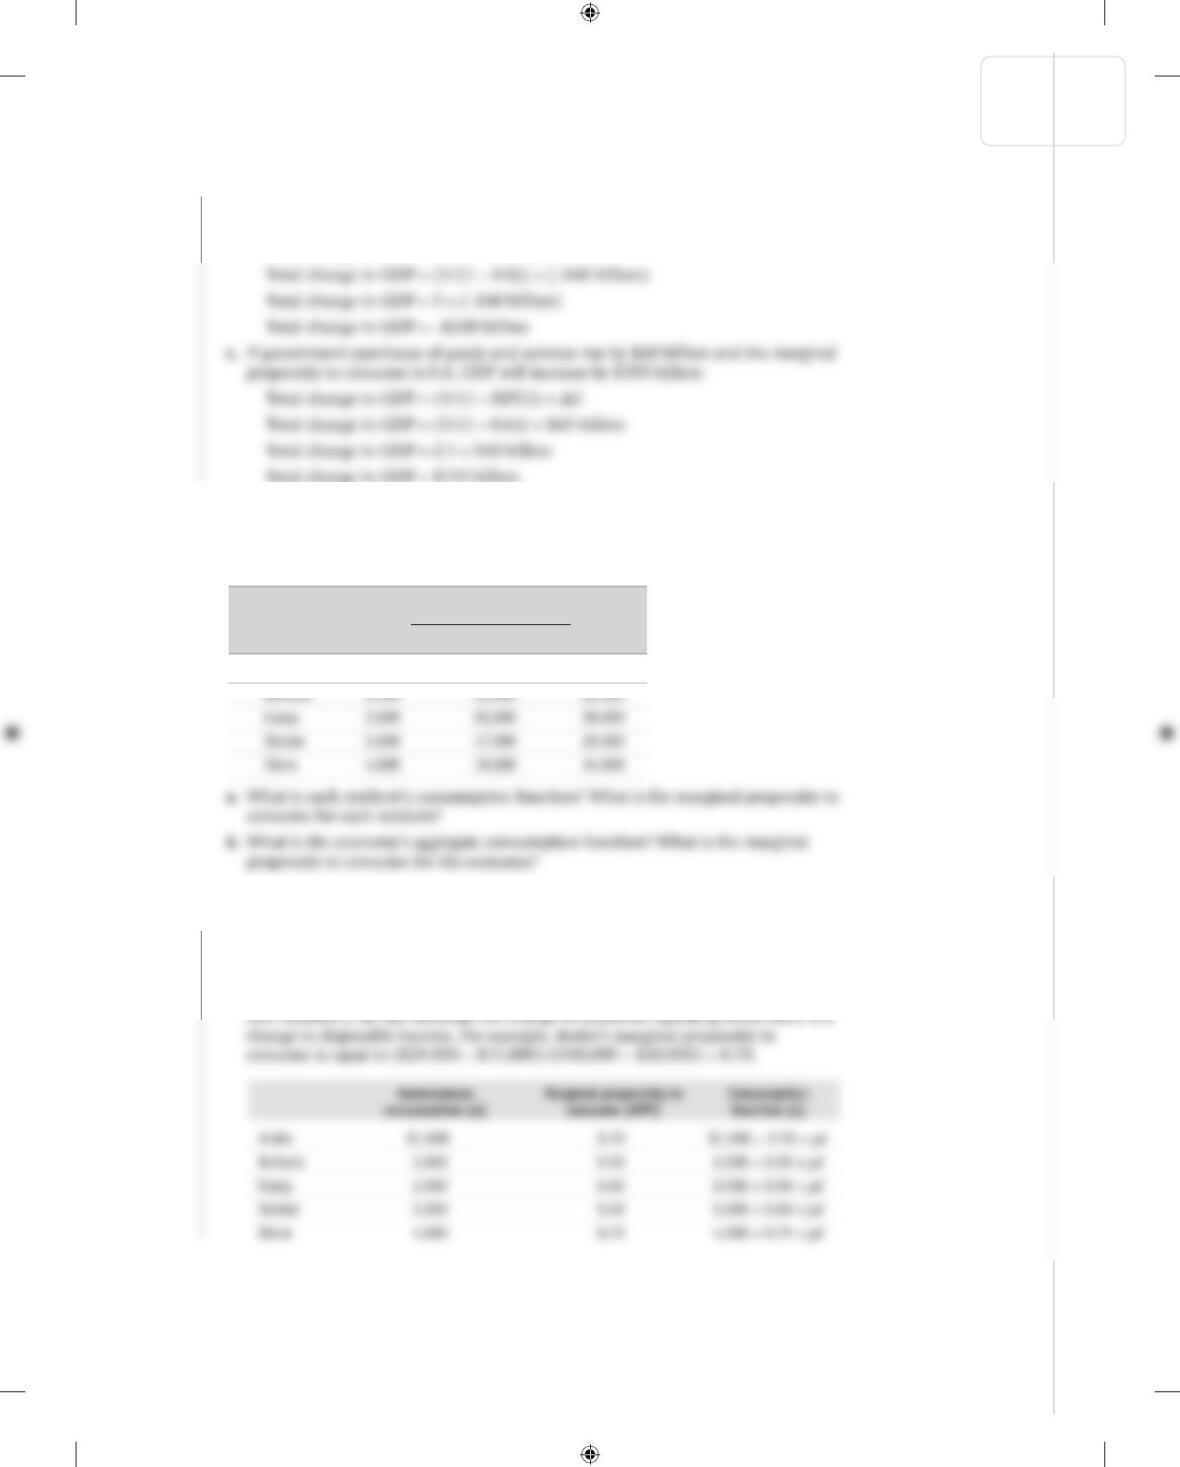
3. Economists observed the only five residents of a very small economy and estimated
each one’s consumer spending at various levels of current disposable income. The
accompanying table shows each resident’s consumer spending at three income levels.
3. a. Each resident’s consumption function and marginal propensity to consume are
given in the table below. To determine autonomous consumer spending for each
resident (the vertical intercept of his or her consumption function), we can look
at each one’s consumer spending when disposable income is zero. To calculate
each resident’s marginal propensity to consume (the slope of his or her consump-
Individual consumer Individual
spending by current disposable income
$0 $20,000 $40,000
Andre 1,000 $15,000 29,000
KrugWellsECPS4e_Macro_CH11.indd S-151KrugWellsECPS4e_Macro_CH11.indd S-151 1/29/15 8:07 AM1/29/15 8:07 AM
Solution
b. To find the economy’s consumption function, we calculate aggregate consumer
spending at each level of aggregate disposable income:
• When each resident earns $0 in disposable income, aggregate consumer spend-
ing is $14,500.
4. From 2009 to 2014, Eastlandia experienced large fluctuations in both aggregate con-
sumer spending and disposable income, but wealth, the interest rate, and expected
future disposable income did not change. The accompanying table shows the level of
aggregate consumer spending and disposable income in millions of dollars for each of
these years. Use this information to answer the following questions.
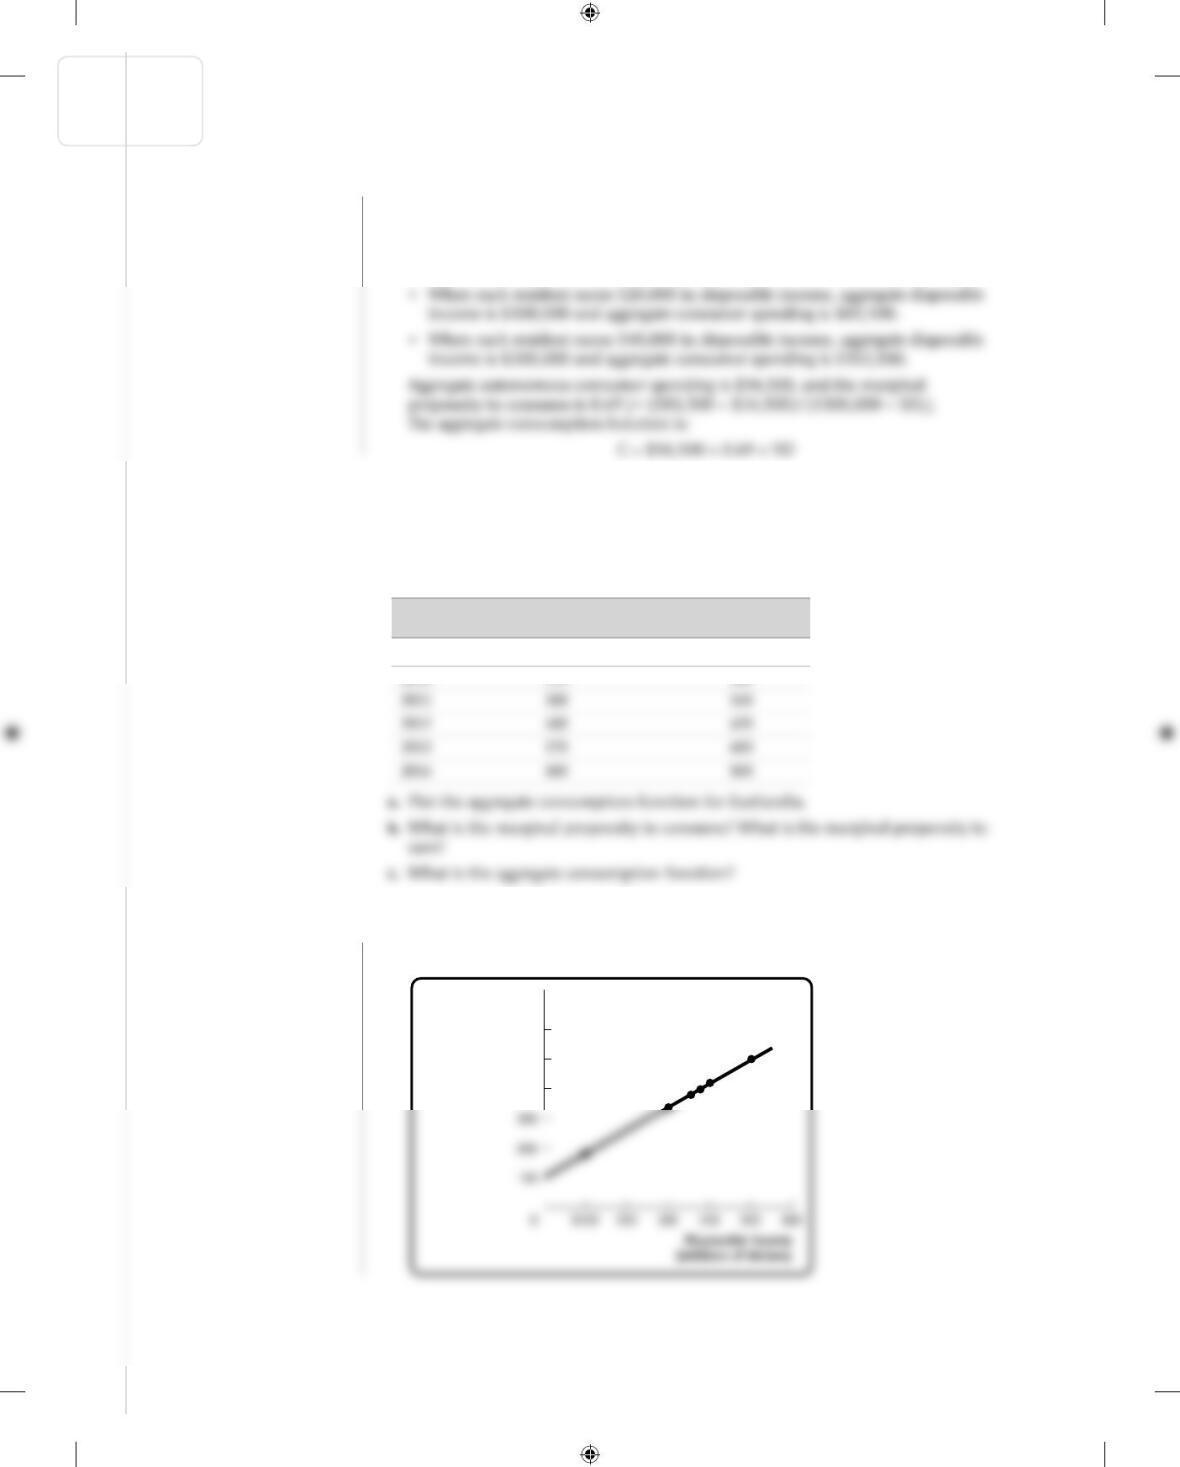
4. a. The accompanying diagram shows the aggregate consumption function for
Eastlandia.
$600
500
400
Consumer spending
(millions of dollars)
CF
Disposable income Consumer spending
Year (millions of dollars) (millions of dollars)
2009 $100 $180
2010 350 380
S-152 CHAPTER 11 INCOME AND EXPENDITURE
KrugWellsECPS4e_Macro_CH11.indd S-152KrugWellsECPS4e_Macro_CH11.indd S-152 1/29/15 8:07 AM1/29/15 8:07 AM

Solution
Solution
5. The Bureau of Economic Analysis reported that, in real terms, overall consumer
spending increased by $66.2 billion during the second quarter of 2014.
a. If the marginal propensity to consume is 0.52, by how much will real GDP change
in response?
5. a. Real GDP increases as a result of this change in consumer spending by
(1/(1 − 0.52)) × $66.2 billion = $137.92 billion.
6. During the early 2000s, the Case–Shiller U.S. Home Price Index, a measure of average
home prices, rose continuously until it peaked in March 2006. From March 2006 to
May 2009, the index lost 32% of its value. Meanwhile, the stock market experienced
similar ups and downs. From March 2003 to October 2007, the Standard and Poor’s
ket hurt or help consumer spending?
6. As home prices increased, homeowners experienced a large increase in the value of their
wealth held in real estate. At the same time, as the S&P 500 almost doubled from March
2003 to October 2007, stockholders experienced a large increase in the value of their
7. How will planned investment spending change as the following events occur?
a. The interest rate falls as a result of Federal Reserve policy.
in higher interest rates.
CHAPTER 11 INCOME AND EXPENDITURE S-153
KrugWellsECPS4e_Macro_CH11.indd S-153KrugWellsECPS4e_Macro_CH11.indd S-153 1/29/15 8:07 AM1/29/15 8:07 AM

Solution
Solution
S-154 CHAPTER 11 INCOME AND EXPENDITURE
7. a. The lower interest rate will lead to a rise in planned investment spending.
8. Explain how each of the following actions will affect the level of planned investment
spending and unplanned inventory investment. Assume the economy is initially in
income–expenditure equilibrium.
a. The Federal Reserve raises the interest rate.
8. a. A rise in the interest rate will reduce planned investment spending. Planned aggre-
gate spending will now be less than GDP, and inventories will accumulate. So
unplanned inventory investment will be positive.
9. In an economy with no government and no foreign sectors, autonomous consumer
spending is $250 billion, planned investment spending is $350 billion, and the mar-
ginal propensity to consume is 2/3.
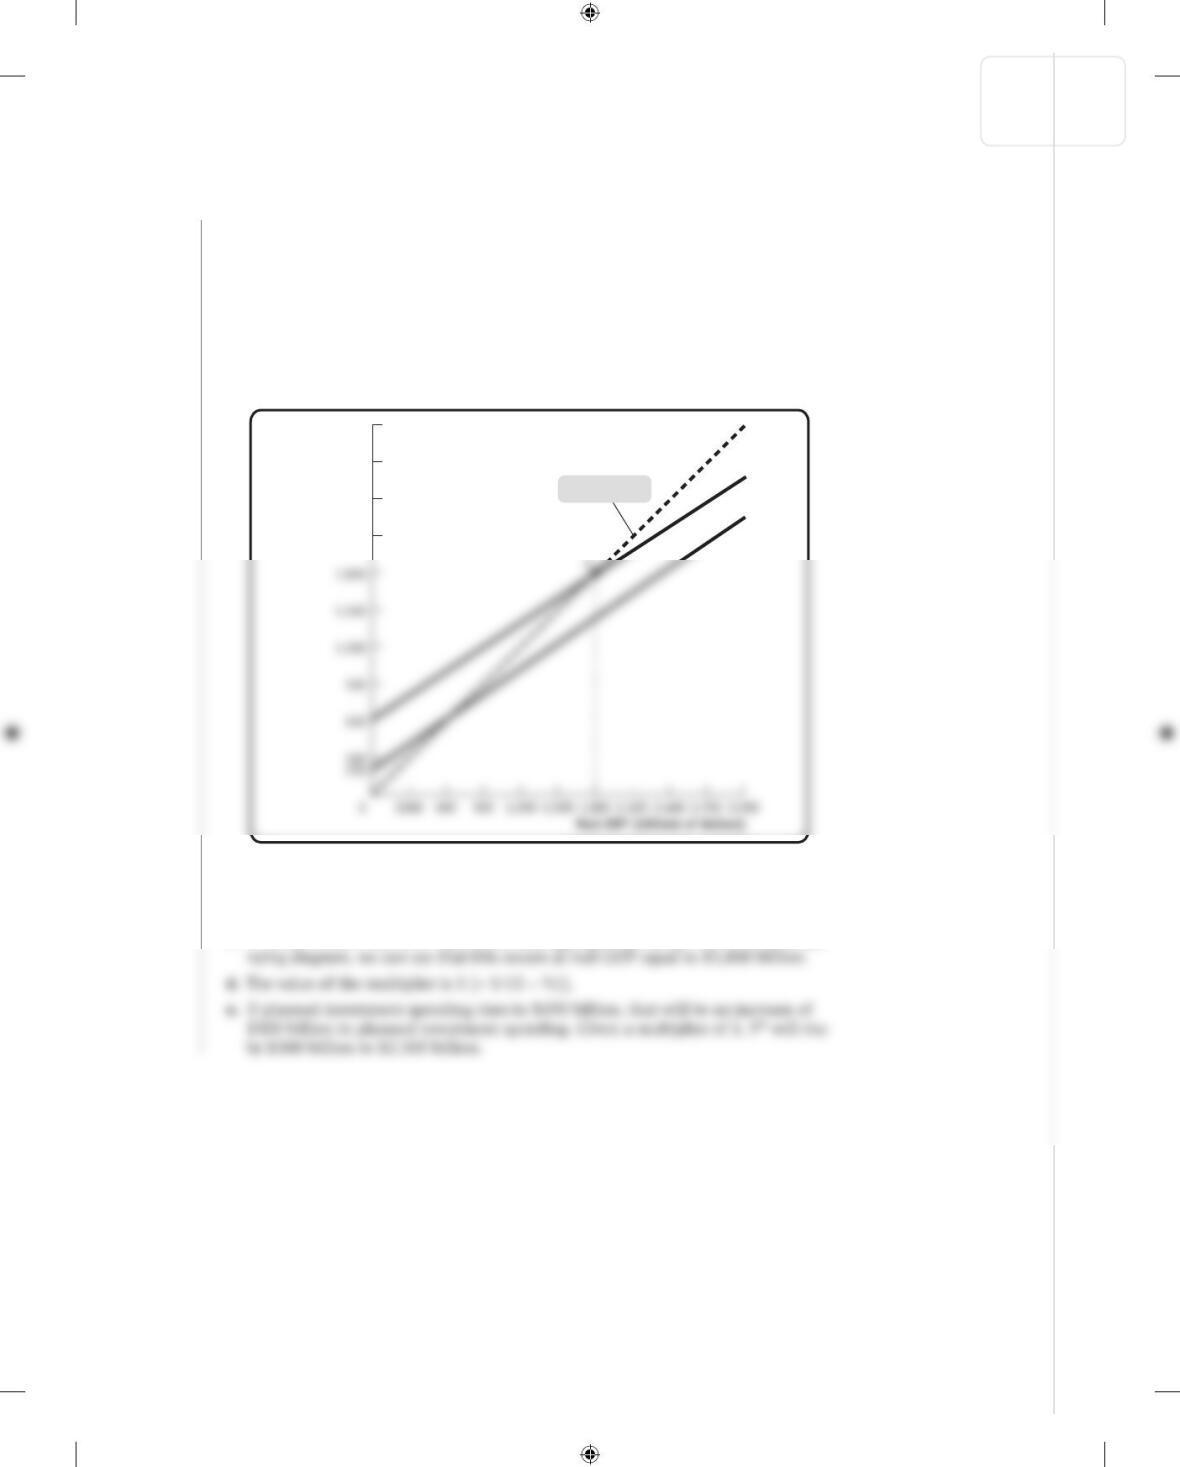
a. Plot the aggregate consumption function and planned aggregate spending.
Solution
CHAPTER 11 INCOME AND EXPENDITURE S-155
9. a. If autonomous consumer spending is $250 billion and the marginal propensity to
consume is 2⁄3, the aggregate consumption function is:
C = $250 billion + 2⁄3 × YD
Planned aggregate spending equals consumer spending plus planned investment
spending:
AEPlanned = C + IPlanned
AEPlanned = ($250 billion + 2⁄3 × YD) + $350 billion
AEPlanned = $600 billion + 2⁄3 × YD
CF
AEPlanned
$3,000
2,700
2,400
2,100
AEPlanned,
consumer
spending
(billions
of dollars)
45-degree line
b. When real GDP equals $600 billion, planned aggregate spending is $1,000 billion
[= $600 billion + 2⁄3 × $600 billion]. Unplanned inventory investment equals real
GDP minus planned aggregate spending, or −$400 billion.
c. Y* occurs where real GDP equals planned aggregate spending. From the accompa-
KrugWellsECPS4e_Macro_CH11.indd S-155KrugWellsECPS4e_Macro_CH11.indd S-155 1/29/15 8:07 AM1/29/15 8:07 AM
Solution
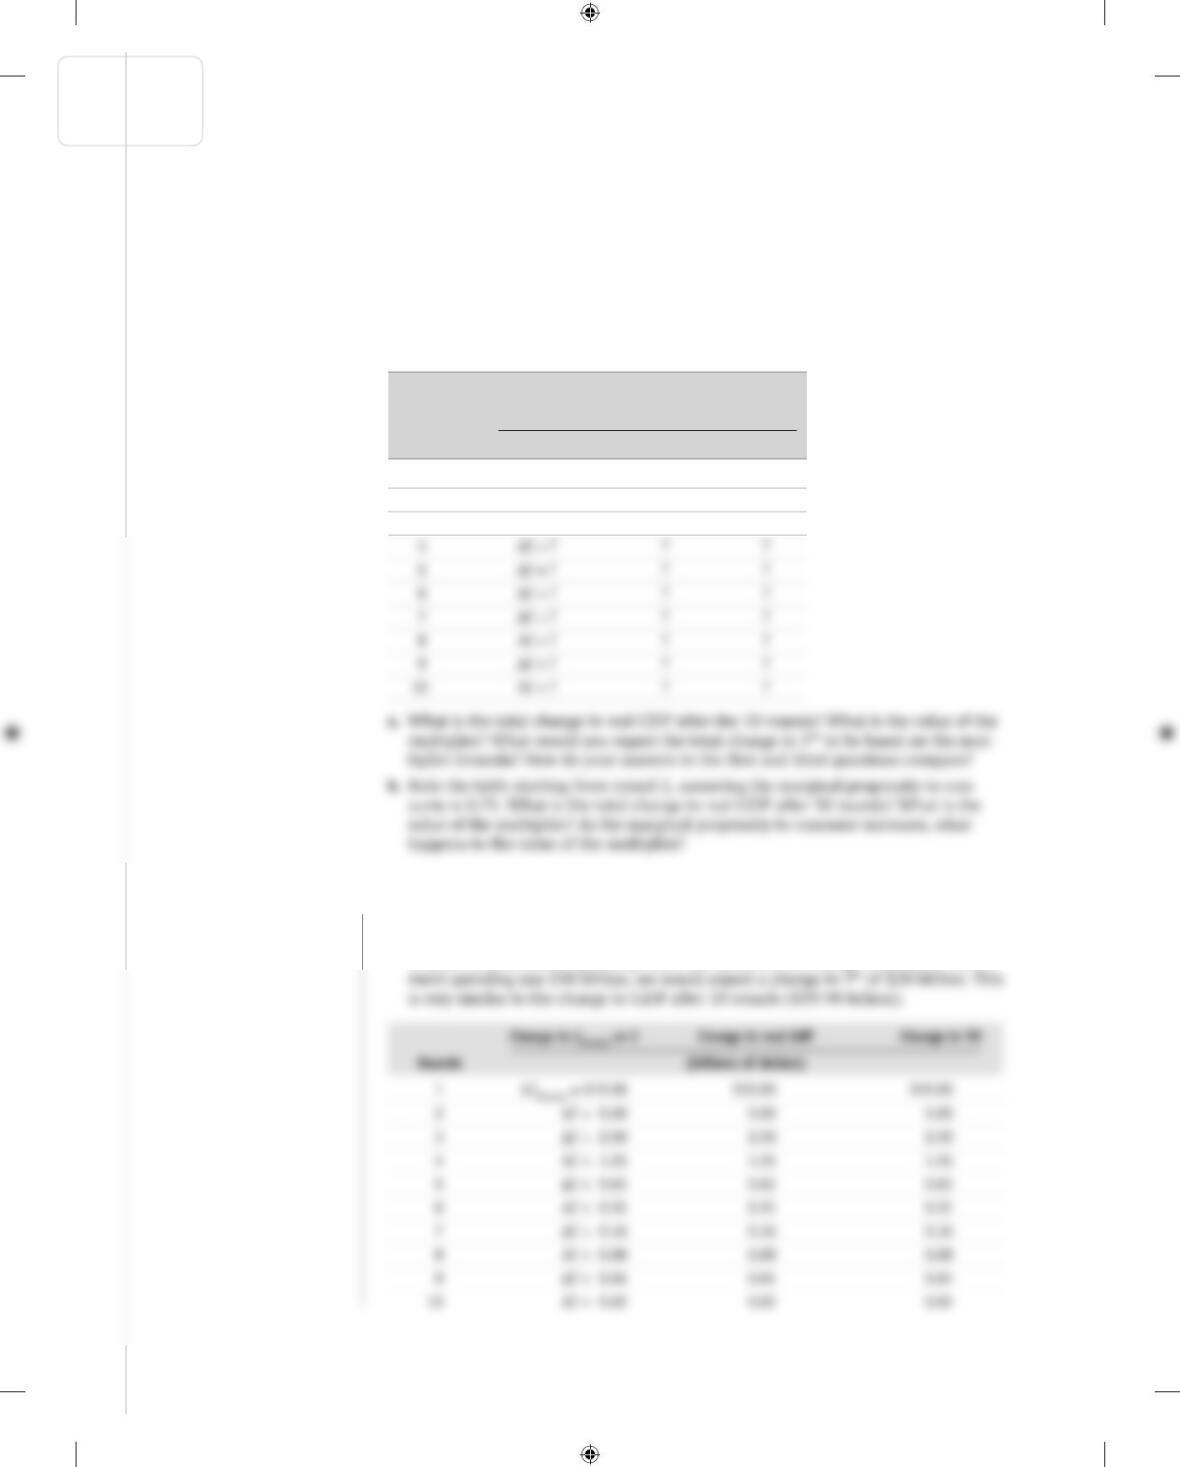
10. An economy has a marginal propensity to consume of 0.5, and Y*, income–
expenditure equilibrium GDP, equals $500 billion. Given an autonomous increase in
planned investment of $10 billion, show the rounds of increased spending that take
place by completing the accompanying table. The first and second rows are filled in
for you. In the first row, the increase of planned investment spending of $10 billion
raises real GDP and YD by $10 billion, leading to an increase in consumer spending
of $5 billion (MPC × change in disposable income) in row 2, raising real GDP and YD
by a further $5 billion.
Change in
IPlanned Change in Change in
or C real GDP YD
Rounds
(billions of dollars)
1 ΔIPlanned = $10.00 $10.00 $10.00
2 ΔC = $ 5.00 $ 5.00 $ 5.00
3 ΔC = ? ? ?
10. a. The total change in GDP after the 10 rounds is $19.98 billion, obtained by
adding up the change in GDP for each of the first 10 rounds. The multiplier is
2 [= (1/(1 − 0.5))]. We would expect the total change in Y* to be twice the change
in planned investment spending. Since the autonomous change in planned invest-
S-156 CHAPTER 11 INCOME AND EXPENDITURE
KrugWellsECPS4e_Macro_CH11.indd S-156KrugWellsECPS4e_Macro_CH11.indd S-156 1/29/15 8:07 AM1/29/15 8:07 AM

Solution
CHAPTER 11 INCOME AND EXPENDITURE S-157
b. The total change in GDP after 10 rounds is $37.74 billion, obtained by adding up the
change in GDP for each of the first 10 rounds. The value of the multiplier is 4. As the
marginal propensity to consume increases, so does the value of the multiplier.
Change in IPlanned or C Change in real GDP Change in YD
Rounds (billions of dollars)
1 ⌬IPlanned = $10.00 $10.00 $10.00
2 ⌬C = 7.50 7.50 7.50
11. Although the United States is one of the richest nations in the world, it is also the
world’s largest debtor nation. We often hear that the problem is the nation’s low sav-
11. If policy makers successfully encouraged greater savings, there would be a decrease in
12. The U.S. economy slowed significantly in early 2008, and policy makers were
extremely concerned about growth. To boost the economy, Congress passed several
relief packages (the Economic Stimulus Act of 2008 and the American Recovery and
Reinvestment Act of 2009) that combined would deliver about $700 billion in govern-

S-158 CHAPTER 11 INCOME AND EXPENDITURE
Solution
12. a. Government spending increases the disposable income of American consumers.
The MPC can be used to calculate the effect of government spending on consumer
spending: ΔC = MPC × ΔYD = 0.5 × $700 billion = $350 billion. We can then use
= $700 billion.
b. As shown in the accompanying diagram, the payments result in an autonomous
increase in planned aggregate spending. This change results in an increase in real GDP.
Planned
aggregate
AEPlanned2
13. a. The accompanying table shows gross domestic product (GDP), disposable income
(YD), consumer spending (C), and planned investment spending (IPlanned) in
an economy. Assume there is no government or foreign sector in this economy.
Complete the table by calculating planned aggregate spending (AEPlanned) and
unplanned inventory investment (IUnplanned).
GDP YD C IPlanned AEPlanned IUnplanned
(billions of dollars)
$0 $0 $100 $300 ? ?
400 400 400 300 ? ?
800 800 700 300 ? ?
1,200 1,200 1,000 300 ? ?
KrugWellsECPS4e_Macro_CH11.indd S-158 1/29/15 8:07 AM

Solution
13. a.
b. We can find the aggregate consumption function by calculating aggregate
auton omous consumer spending and the marginal propensity to consume.
Aggregate autonomous consumer spending equals aggregate consumer spending
when disposable income is zero; in this case, aggregate autonomous consumer
spending is $100 billion. The marginal propensity to consume is the change in
f. If autonomous consumer spending rises to $200 billion, the new Y* will equal
$2,000 billion. If autonomous consumer spending equals $200 billion, it has risen
by $100 billion. Since the multiplier is 4, Y* will change by four times the change
in autonomous consumer spending, or increase by $400 billion.
GDP YD C IPlanned AEPlanned IUnplanned
(billions of dollars)
$0 $0 $100 $300 $400 −$400
400 400 400 300 700 −300
800 800 700 300 1,000 −200
1,200 1,200 1,000 300 1,300 −100
CHAPTER 11 INCOME AND EXPENDITURE S-159
KrugWellsECPS4e_Macro_CH11.indd S-159KrugWellsECPS4e_Macro_CH11.indd S-159 1/29/15 8:07 AM1/29/15 8:07 AM